. 2019 Mar 6;101(5):894-904.e5.
doi: 10.1016/j.neuron.2019.01.008. Epub 2019 Jan 30.

Cell-type-Specific Patterned Stimulus-Independent Neuronal Activity in the Drosophila Visual System during Synapse Formation

Affiliations

Cell-type-Specific Patterned Stimulus-Independent Neuronal Activity in the Drosophila Visual System during Synapse Formation

Orkun Akin et al. Neuron. .

Abstract

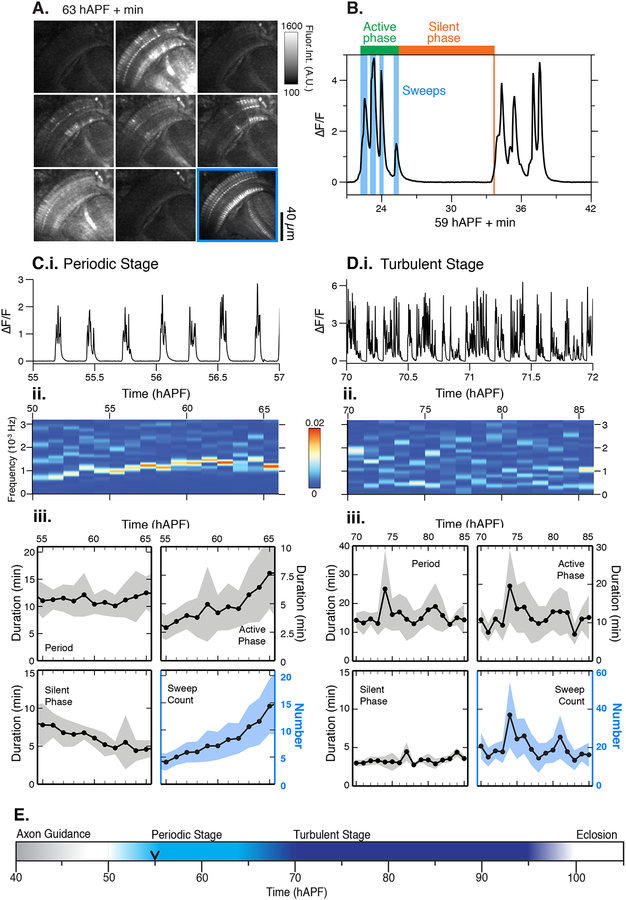
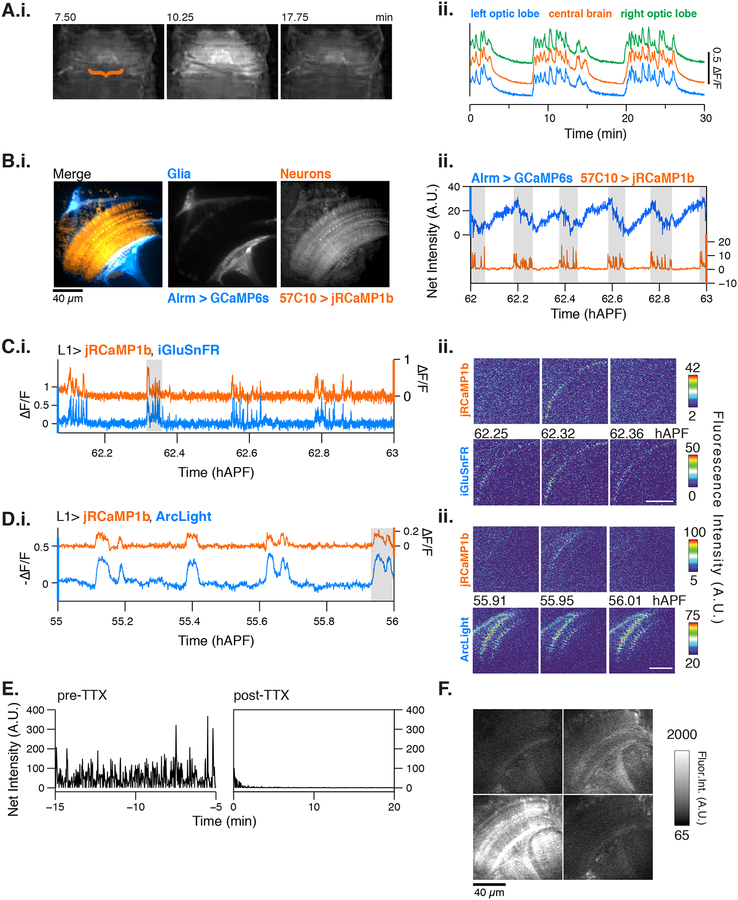
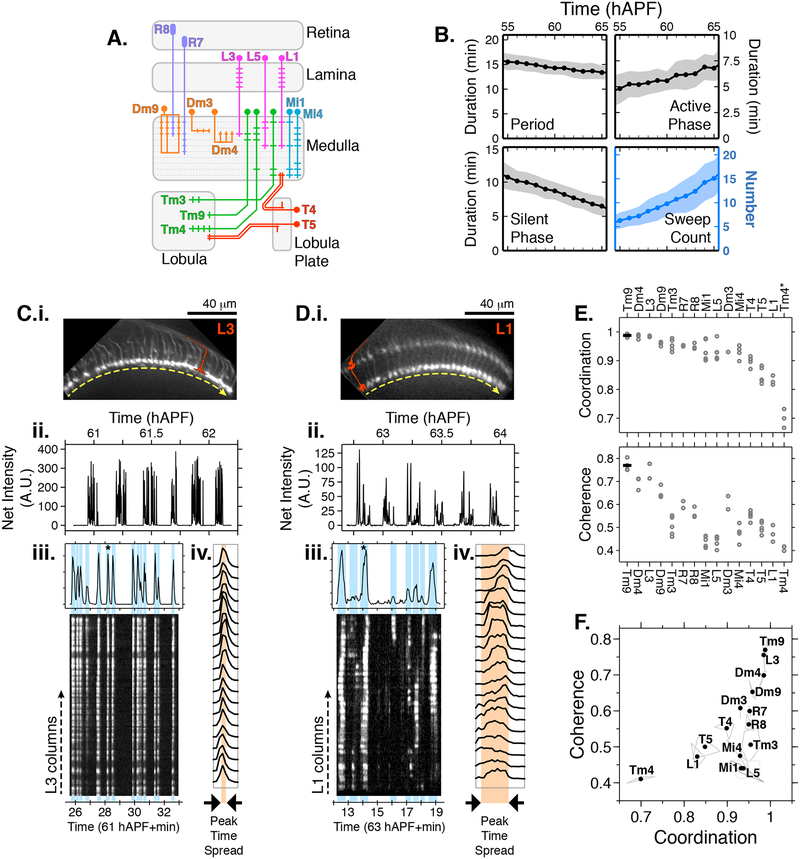
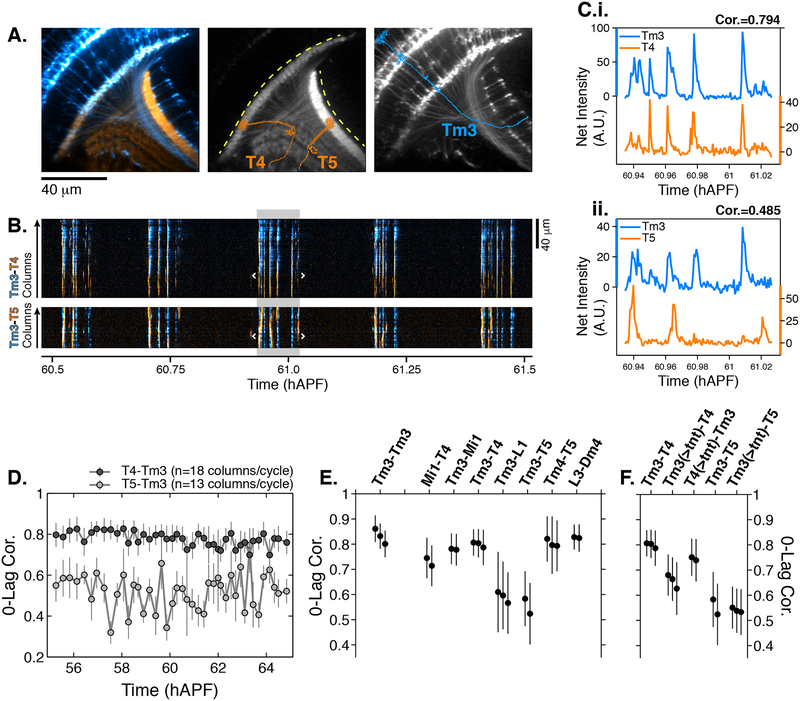
Stereotyped synaptic connections define the neural circuits of the brain. In vertebrates, stimulus-independent activity contributes to neural circuit formation. It is unknown whether this type of activity is a general feature of nervous system development. Here, we report patterned, stimulus-independent neural activity in the Drosophila visual system during synaptogenesis. Using in vivo calcium, voltage, and glutamate imaging, we found that all neurons participate in this spontaneous activity, which is characterized by brain-wide periodic active and silent phases. Glia are active in a complementary pattern. Each of the 15 of over 100 specific neuron types in the fly visual system examined exhibited a unique activity signature. The activity of neurons that are synaptic partners in the adult was highly correlated during development. We propose that this cell-type-specific activity coordinates the development of the functional circuitry of the adult brain.

Keywords: calcium imaging; nervous system development; neuronal activity; synaptogenesis; two-photon microscopy; visual system development.


Conflict of interest statement

Declaration of Interests

The authors declare no competing interests.

Figures

Figure 1.
Figure 1.. Patterned stimulus independent neural activity (PSINA) in the developing visual system
A. Micrograph montage showing a single cycle at 63 hAPF; framed panel (lower right) is the average intensity projection through the active phase. B. Representative cycle. C.i. Representative trace during the periodic stage (55–65 hAPF). C.ii. Frequency analysis (Fourier transform) between 50–65 hAPF; C.iii. Average traces of cycle metrics in the periodic stage (n = 54 columns from 6 flies). Shaded area, standard deviation. D.i. Representative trace during the turbulent stage (70 hAPF to eclosion); D.ii. Frequency analysis (Fourier transform) between 70–85 hAPF; D.iii. Average traces of cycle metrics in the turbulent stage (n = 46 columns from 4 flies). Shaded area, standard deviation; E. Summary of spontaneous activity stages during pupal development. Black arrowhead marks the time point after which 100% of columns participate in each cycle. See Table S1 for genotypes.
Figure 2.
Figure 2.. Characterization of PSINA
A.i. Representative epifluorescence images of a single cycle in an intact pupa expressing pan-neuronal GCaMP6s.. A.ii. Average traces from ROIs encircling the left optic lobe (blue), central brain (orange), and right optic lobe (green) between 58–60 hAPF. B.i. Representative micrograph showing astrocytes expressing GCaMP6s (blue) and pan-neuronal expression of jRCaMP1b (orange). Scale bar, 40 μm. B.ii. Representative trace comparing glial (blue) and neuronal activity from (orange) between 62–63 hAPF. Active phases of the neuronal cycles are shaded in gray. C. Representative traces (i.) and micrographs (ii.) from L1 neurons expressing jRCaMP1b (orange, top) and iGluSnFr (blue, bottom). Note that iGluSnFr reports more sweeps than jRCaMP1b; we suspect that the L1-expressed glutamate sensor’s responds to neurotransmitter released by L1 itself, neighboring cells or both. D. Representative traces (i.) and micrographs (ii.) from L1 neurons expressing jRCaMP1b (orange, top) and ArcLight (blue, bottom). E. Representative traces of activity as reported by panneuronal GCaMP6s before (left) and after (right) addition of 1μM tetrodotoxin. F. Micrographs of norpAnull mutant flies expressing pan-neuronal GCaMP6s shows that visual stimuli are not required for activity. See Table S1 for genotypes.
Figure 3.
Figure 3.. Cell type specific PSINA dynamics
A. Schematic of visual system cell types described in Figures 3 and 4. B. Cycle metrics in the periodic stage, averaged over 15 cell types and 55 time series (i.e. flies). Shaded areas, standard deviation. C. PSINA dynamics in L3 cells. C.i. Average intensity projection of GCaMP6s expressing L3 processes in the M3 layer of the medulla neuropil. Single L3 schematically shown in red. Dashed yellow arrow sits below the thin profile through M3 used to generate the kymograph in (iii); direction matches the layout of the columns in the kymograph. C.ii. Average net fluorescence intensity along the profile described in (i). Active phase with gray background shown in greater detail in (iii). C.iii. Plot shows expanded view of an active phase with sweeps highlighted in light blue. Star marks the sweep expanded into individual column traces in (iv). Kymograph of net fluorescence derived from the profile described in (i). C.iv. Plot of fluorescence change in individual medulla columns in the star marked sweep in (iii). D. Same as (C) for an L1 time series. Kymograph generated from a thin profile through the L1 processes in M5 (i.e. layer just above the yellow line). E. Coordination (top) and coherence (bottom) values calculated for different cell types. Round gray markers are individual time series, black bars are the average for each cell type. Data from 2–6 flies shown for each cell type. Metrics for each time series calculated over 55–65 hAPF, using an average of 41+/−9 cycles and 10–20 columns per cycle. *The outlier coordination value of Tm4 is due to sparse labeling of this cell type with the driver used. F. Scatter plot of coordination v. coherence. Vertices of light gray polygons, individual time series; black dots, average for each cell type. See Table S1 for genotypes used in this figure.
Figure 4.
Figure 4.. Synaptic release is required for correlated PSINA activity.
A. Average intensity projection images of GCaMP6s expressing Tm3 (blue) and RCaMP1b expressing T4–5 (orange) cells. Single Tm3, T4, and T5 projections are schematically shown. Dashed yellow arcs in center panel abut the thin profiles through M9–10 and the lobula used to generate the kymographs in (B). B. Tm3-T4 (top) and Tm3-T5 (bottom) kymographs of net fluorescence derived from the profiles described in (A). Columns between the white brackets in active phase with gray background were used to generate the plots in (C). C. Tm3-T4 (i) and Tm3-T5 (ii) net fluorescence intensity along the columns marked in (B). D. 0-Lag cross correlation values between 55–65 hAPF for Tm3-T4 (dark gray) and Tm3-T5 (light gray) for the time series used in (A-C). Markers are the average correlation value for 10–20 columns per cycle, gray vertical lines are standard deviation. E. 0-lag correlation values for pairs of cell types, averaged over 55–65 hAPF. Black markers and vertical lines are the average and standard deviation for each time series. Data from 2–3 flies shown per pair. 43+/−10 cycles with 15+/−3 columns per cycle used for each fly. The Tm3-Tm3 pair represents the highest correlation we expect to observe for a perfect match given the signal-to-noise statistics of the data (see Figures S6A–S6B). F. TNT expression in Tm3 reduces Tm3-T4 correlation but has no effect on Tm3-T5 correlation. Data statistics as in (E). Unperturbed pairs reproduced from (E) for ease of comparison. See Table S1 for genotypes used in this figure.

References

    1. Ackman JB, and Crair MC (2014). Role of emergent neural activity in visual map development. Curr. Opin. Neurobiol 24, 166–175. - PMC - PubMed
    1. Ackman JB, Burbridge TJ, and Crair MC (2012). Retinal waves coordinate patterned activity throughout the developing visual system. Nature 490, 219–225. - PMC - PubMed
    1. Akin O, and Zipursky SL (2016). Frazzled promotes growth cone attachment at the source of a Netrin gradient in the Drosophila visual system. eLife 5. - PMC - PubMed
    1. Akrouh A, and Kerschensteiner D (2013). Intersecting circuits generate precisely patterned retinal waves. Neuron 79, 322–334. - PMC - PubMed
    1. Aptekar JW, Keles MF, Mongeau J-M, Lu PM, Frye MA, and Shoemaker PA (2014). Method and software for using m-sequences to characterize parallel components of higher-order visual tracking behavior in Drosophila. Front. Neural Circuits 8, 130. - PMC - PubMed

Publication types