. 2019 Apr;189(4):797-812.
doi: 10.1016/j.ajpath.2018.12.016. Epub 2019 Feb 1.

Lipopolysaccharide-Induced Increase in Intestinal Permeability Is Mediated by TAK-1 Activation of IKK and MLCK/MYLK Gene

Affiliations

Lipopolysaccharide-Induced Increase in Intestinal Permeability Is Mediated by TAK-1 Activation of IKK and MLCK/MYLK Gene

Meghali Nighot et al. Am J Pathol. 2019 Apr.

Abstract

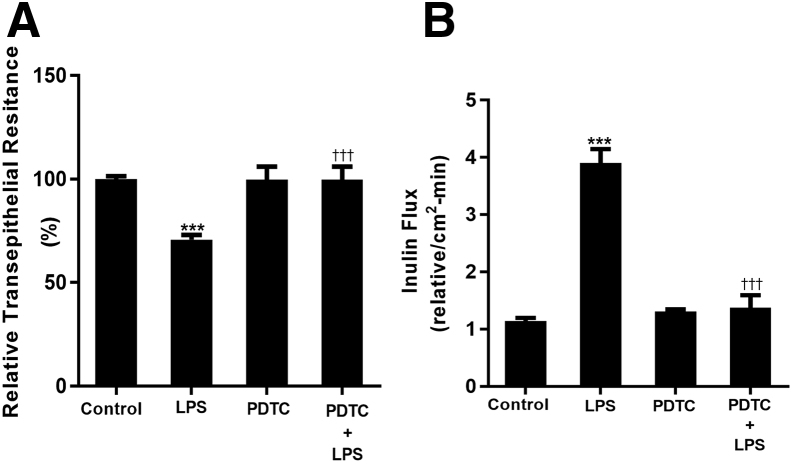
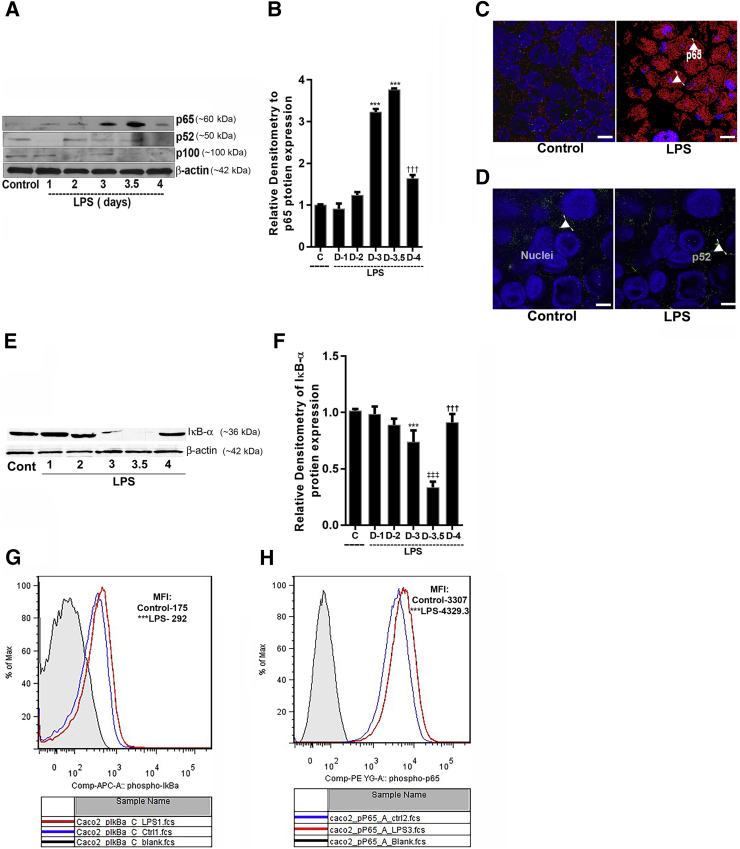
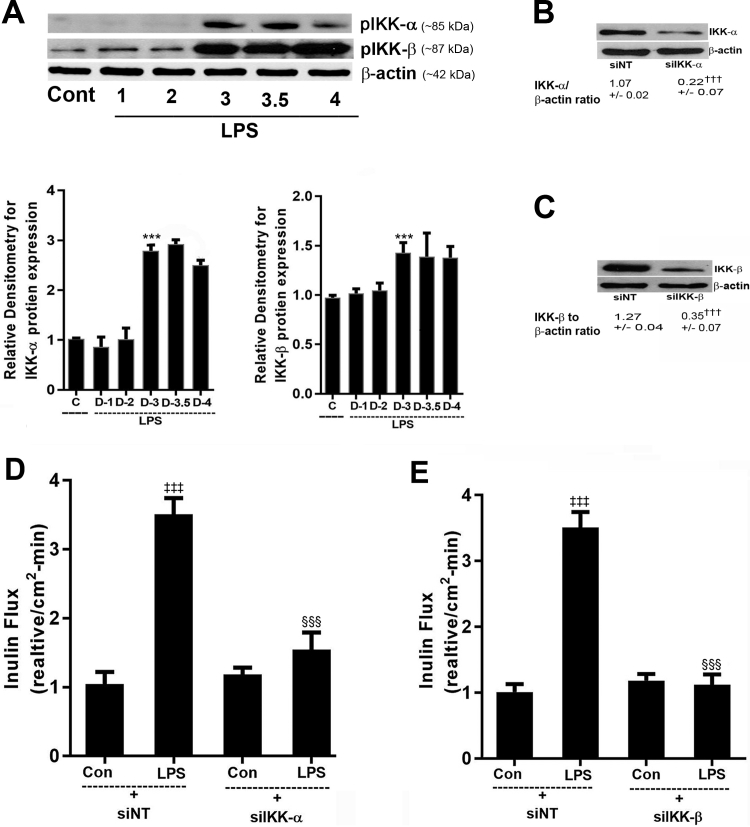
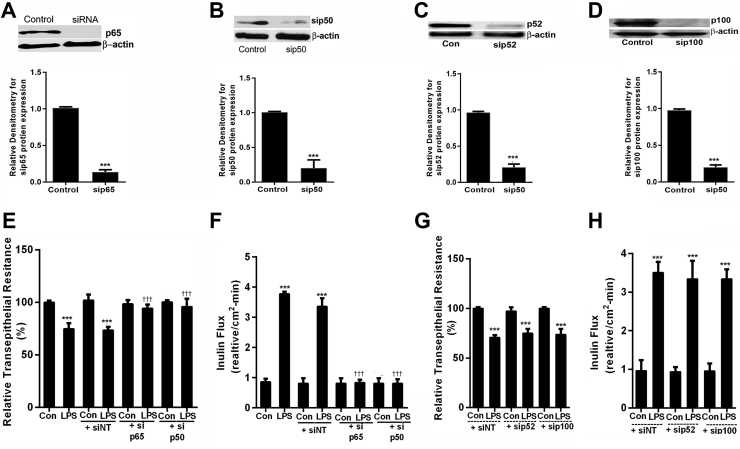
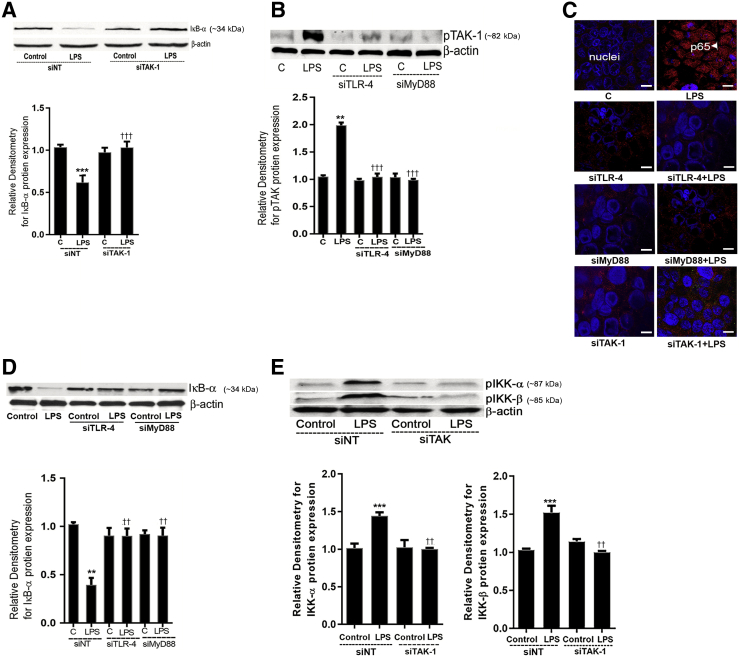
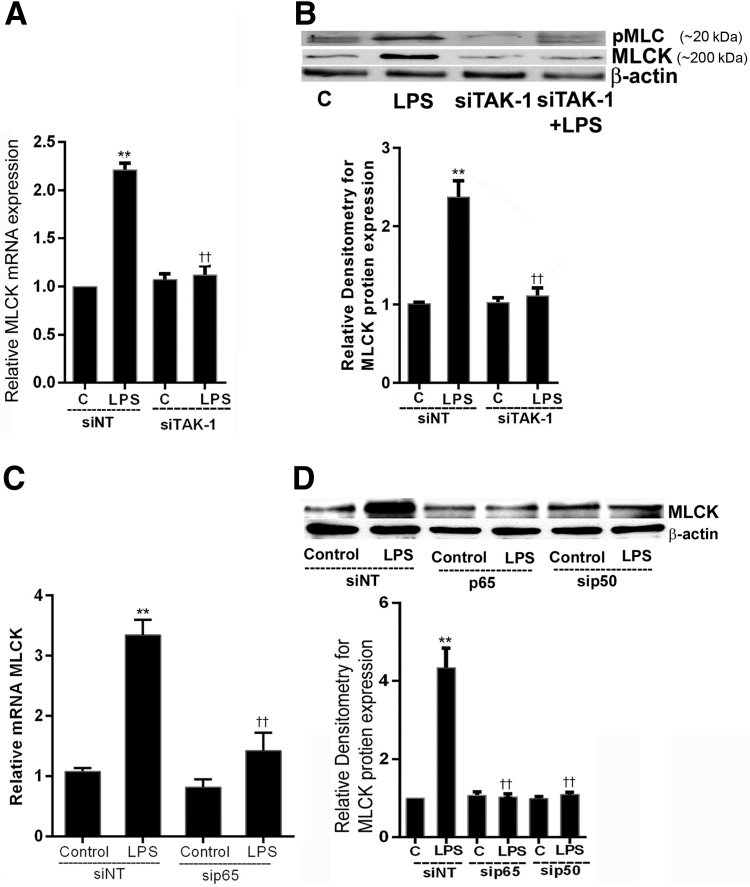
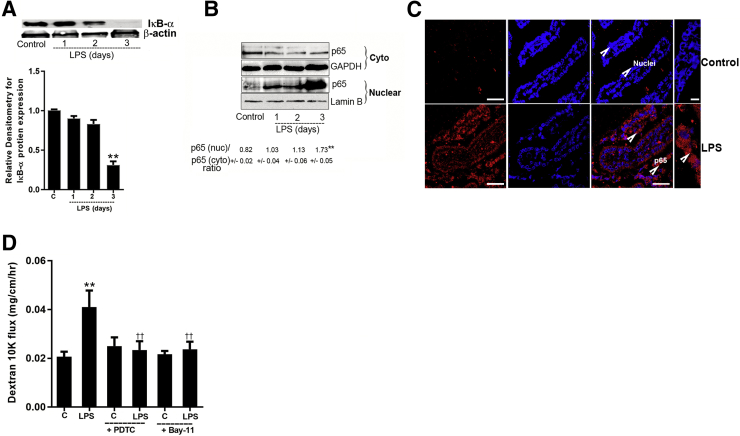
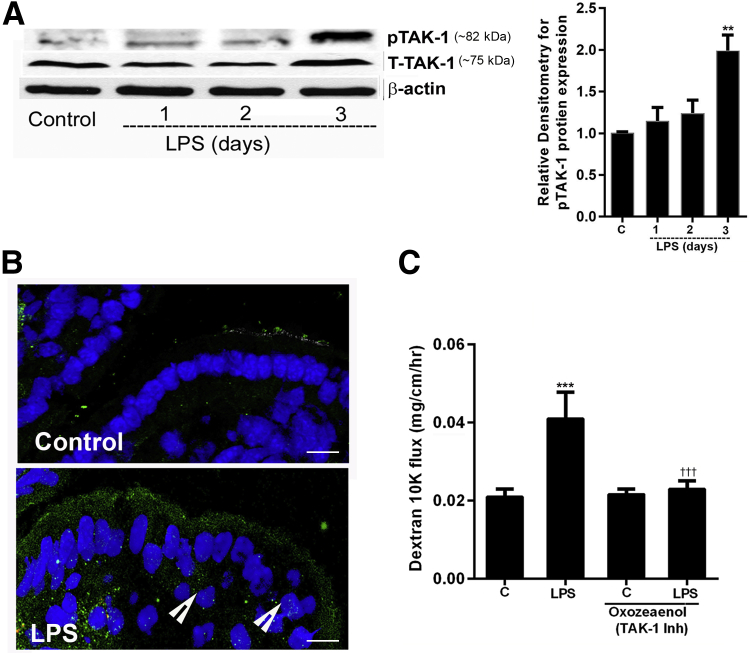
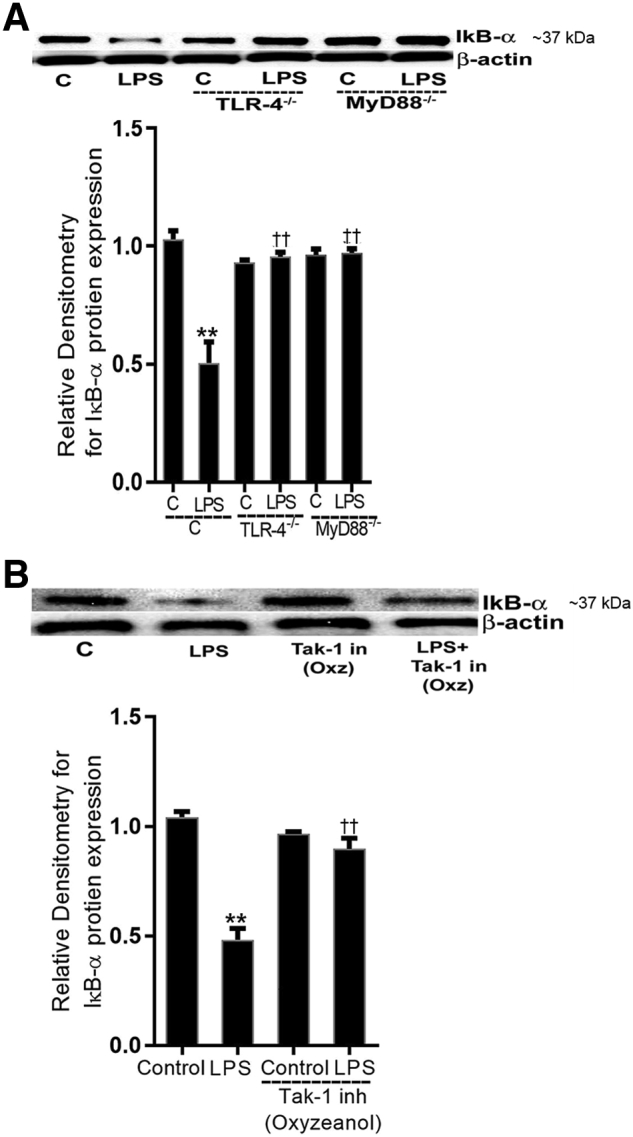
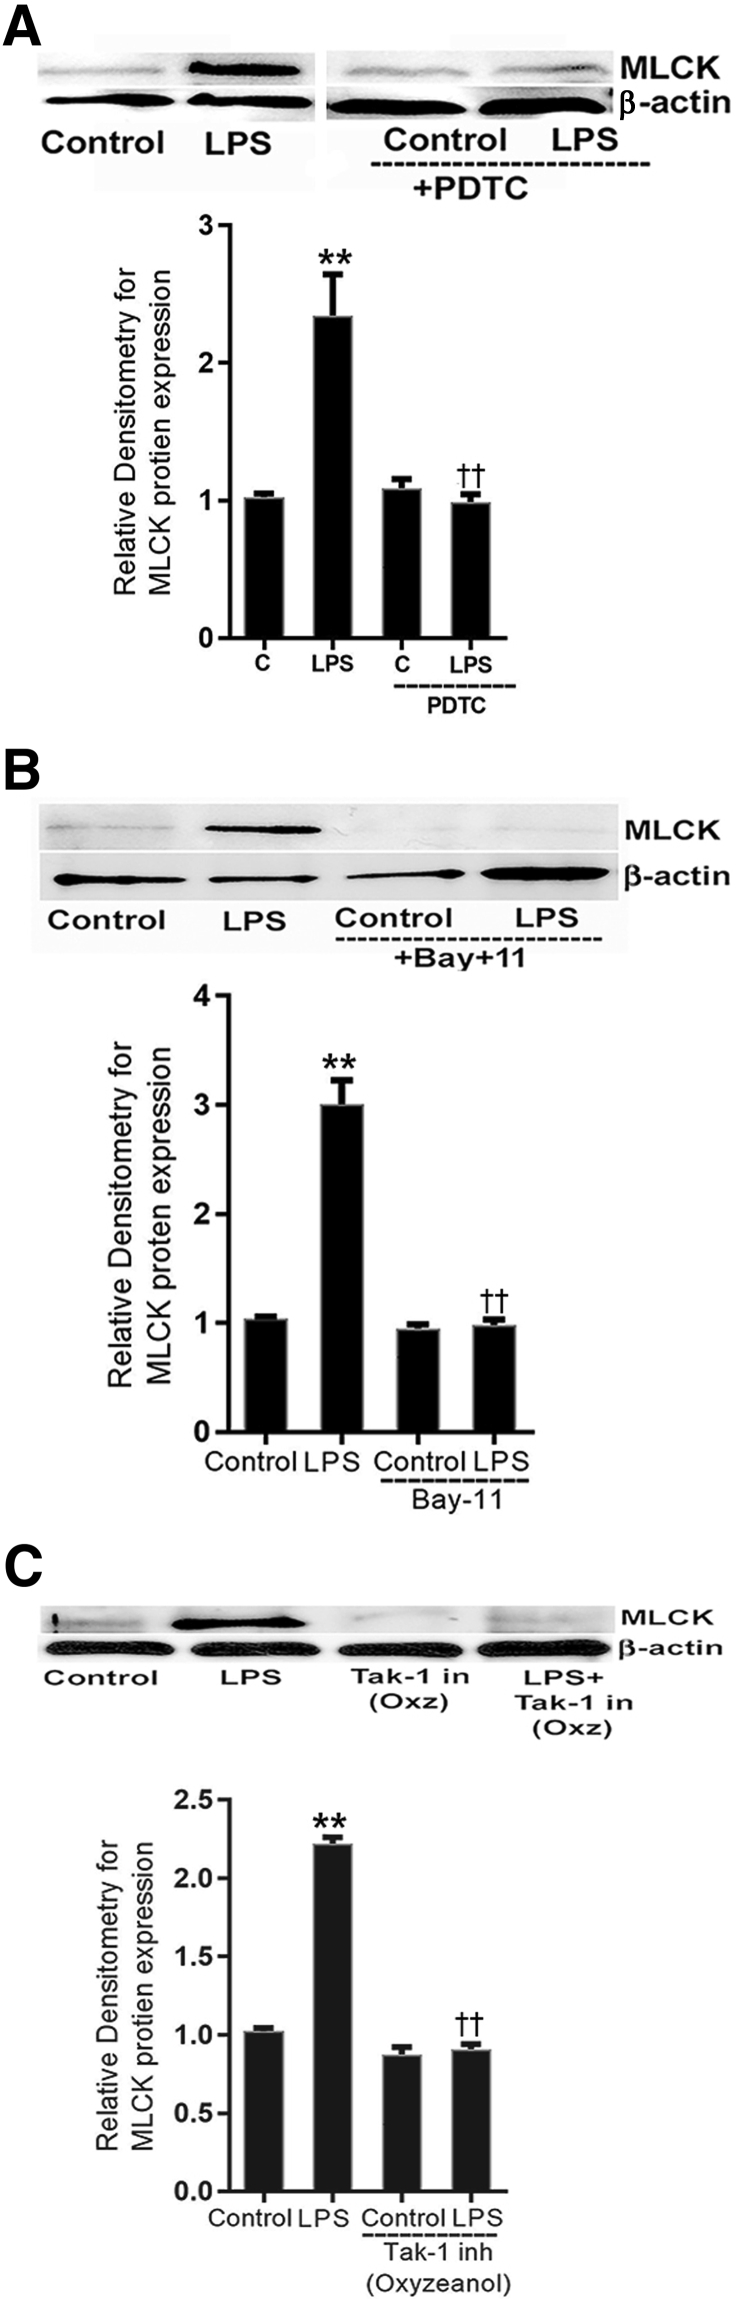
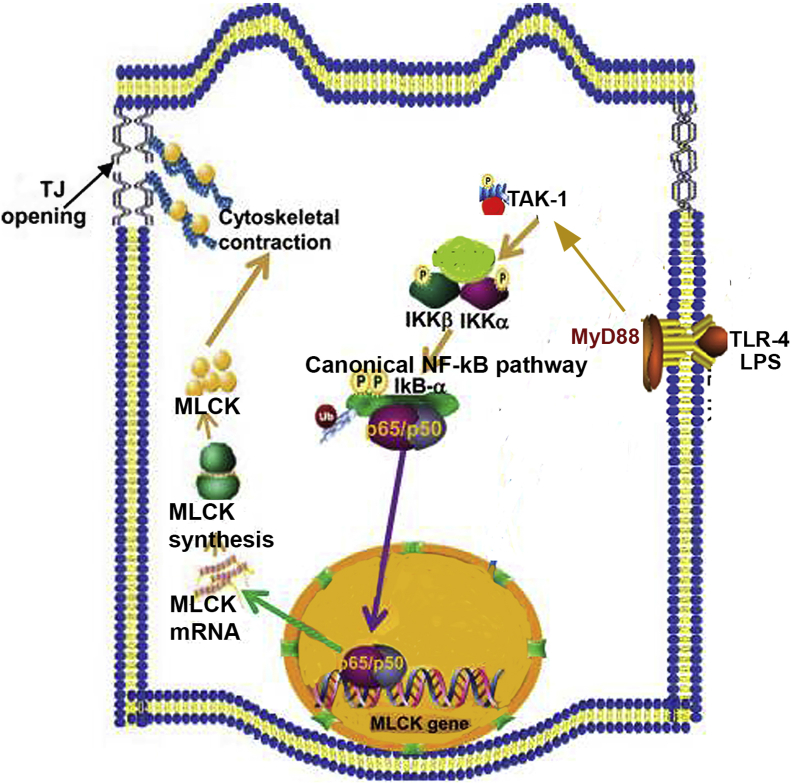
Lipopolysaccharides (LPSs) are a major component of Gram-negative bacterial cell wall and play an important role in promoting intestinal inflammatory responses. Recent studies have shown that physiologically relevant concentrations of LPS (0 to 2000 pg/mL) cause an increase in intestinal epithelial tight junction (TJ) permeability without causing cell death. However, the intracellular pathways and the mechanisms that mediate LPS-induced increase in intestinal TJ permeability remain unclear. The aim was to delineate the intracellular pathways that mediate the LPS-induced increase in intestinal permeability using in vitro and in vivo intestinal epithelial models. LPS-induced increase in intestinal epithelial TJ permeability was preceded by an activation of transforming growth factor-β-activating kinase-1 (TAK-1) and canonical NF-κB (p50/p65) pathways. The siRNA silencing of TAK-1 inhibited the activation of NF-κB p50/p65. The siRNA silencing of TAK-1 and p65/p50 subunit inhibited the LPS-induced increase in intestinal TJ permeability and the increase in myosin light chain kinase (MLCK) expression, confirming the regulatory role of TAK-1 and NF-κB p65/p50 in up-regulating MLCK expression and the subsequent increase in TJ permeability. The data also showed that toll-like receptor (TLR)-4/myeloid differentiation primary response (MyD)88 pathway was crucial upstream regulator of TAK-1 and NF-κB p50/p65 activation. In conclusion, activation of TAK-1 by the TLR-4/MyD88 signal transduction pathway and MLCK by NF-κB p65/p50 regulates the LPS-induced increase in intestinal epithelial TJ permeability.


Figures

Figure 1
Figure 1
Effect of pharmacologic inhibition of NF-κB on lipopolysaccharide (LPS)-induced increase in intestinal epithelial tight junction permeability. A: Filter-grown Caco-2 monolayers were treated with 300 pg/mL LPS for a 5-day experimental period. Pharmacologic inhibition of NF-κB by 10 μm ammonium pyrrolidinedithiocarbamate (PDTC) inhibited the LPS (physiological dose of 300 pg/mL)-induced drop in Caco-2 transepithelial electrical resistance. B: Pharmacologic inhibition of NF-κB by PDTC prevented the LPS-induced increase in inulin flux. NF-κB inhibitor PDTC was added 1 hour before LPS treatment. All experimental treatments were renewed every 24 hours for the 5-day experimental period. Data are expressed as means ± SEM. n = 4 independent experiments. ∗∗∗P < 0.001 versus control; †††P < 0.001 versus LPS.
Figure 2
Figure 2
Time course effect of lipopolysaccharide (LPS) on Caco-2 NF-κB pathway (p65 and p52) activation. A: LPS at the concentration of 300 pg/mL caused significant increase in p65 protein expression in Caco-2 cells on day 3 to 3.5. The expression of p52 and p100 did not change with LPS treatment. β-Actin was used as an internal control for protein loading. B: Relative densitometry analysis for p65 protein levels. C: Confocal immunofluorescence of Caco-2 cells treated with 300 pg/mL LPS (3 to 3.5 days) indicated p65 (red) translocation to the nucleus (blue) (arrowheads). D: P52 (green) did not change after LPS treatment (arowheads). E: LPS caused degradation of inhibitory κ B (IκB)-α expression (3 to 3.5 days), as assessed by Western blot analysis. β-Actin was used as an internal control for protein loading. F: Densitometry analysis of LPS treatment showed significant decrease in IκB-α level on day 3 to 3.5 compared with control untreated cells. G and H: LPS-treated Caco-2 cells (3 to 3.5 days) analyzed by flow cytometry for phospho-IκB-α and phospho-p65, respectively, showed increased expression compared with control untreated cells. Gray indicates isotope control (Cont); blue, control untreated; red, LPS treated day 3. [Mean fluorescence intensity (MFI): pIκB-α, 175 ± 12.12, versus 292 ± 25.63; pp65, 3307 ± 154.7, versus 4329.3 ± 169.4]. Data are expressed as means ± SEM. n = 3 independent experiments. ∗∗∗P < 0.001 versus control; †††P < 0.01 versus LPS (day 4); ‡‡‡P < 0.01 versus LPS (day 3.5). Scale bars = 5 μm (C and D).
Figure 3
Figure 3
Effect of lipopolysaccharide (LPS) on inhibitory κ B kinases (IKKs) and intestinal epithelial tight junction permeability. A: LPS at 300 pg/mL in Caco-2 cells caused significant increase in activation of both IKK-α and IKK-β on day 3 to 3.5 after LPS treatment. β-Actin was used as an internal control (C; Con; Cont) for protein loading. Densitometry analysis of LPS treatment showed significant increase in IKK-α and IKK-β, respectively, on day 3 and 3.5 compared with control untreated cells. B and C: siRNA transfection of IKK-α and IKK-β in Caco-2 cells inhibited the protein expression of IKK-α and IKK-β. D: siRNA transfection of IKK-α in Caco-2 cells partially prevented the LPS-induced increase in inulin flux. E: siRNA transfection of IKK-β in Caco-2 cells inhibited the LPS-induced increase in inulin flux. Data are expressed as means ± SEM. n = 6 experiments (B, C, and E). ∗∗∗P < 0.001 versus control untreated cells; †††P < 0.001 versus control (siNT); ‡‡‡P < 0.001 versus nontarget (NT) siRNA; §§§P < 0.001 versus LPS.
Figure 4
Figure 4
Effects of genetic knockdown of p65/p50 and p52/p100 on lipopolysaccharide (LPS)-induced increase in intestinal epithelial tight junction permeability. A: p65 siRNA transfection resulted in a near-complete depletion of p65. Relative densitometry analysis of p65 protein expression levels. B: The siRNA of p50 transfection resulted in a near-complete depletion of p50 protein expression. Relative densitometry of p50 protein expression levels. C: The p52 siRNA transfection resulted in a near-complete depletion of p52 as shown in densitometry analysis. D: p100 siRNA transfection resulted in a near-complete depletion of p100, as shown in densitometry analysis. E: p65 and p50 siRNA transfection in Caco-2 monolayers inhibited the LPS-induced drop in Caco-2 cell transepithelial electrical resistance (TER). F: p65 and p50 siRNA transfection inhibited the LPS-induced increase in inulin flux. G: p52 and p100 siRNA transfection in Caco-2 monolayers did not prevent the LPS-induced drop in TER. H: p52 and p100 siRNA transfection did not prevent the LPS-induced increase in inulin flux. The Western blot analysis was performed 72 hours after all siRNA transfections. n = 4 experiments (A–D and F); n = 3 experiments (H). ∗∗∗P < 0.001 versus control; †††P < 0.001 versus LPS. Con, control; NT, nontarget.
Figure 5
Figure 5
Role of transforming growth factor-β–activating kinase (TAK)-1 in the lipopolysaccharide (LPS)-induced activation of canonical NF-κB pathway and Caco-2 tight junction permeability. A: LPS treatment at the concentration of 300 pg/mL caused activation of phospho-TAK-1. B and C: LPS treatment did not induce phosphorylation of NF-κB–inducing kinase (NIK) or mitogen-activated kinase kinase (MEKK)-1 at day 3 after LPS exposure compared with untreated Caco-2 cells. D: Confocal immunofluorescence of Caco-2 cells treated with 300 pg/mL LPS for 5 days indicated increase in pTAK-1 (green) on day 3 and 3.5 after LPS treatment. Nucleus, blue. E: TAK-1, NIK, and MEKK-1 siRNA transfections in Caco-2 cells significantly reduced TAK-1, NIK, and MEKK-1 protein expression, as analyzed by Western blot analysis and relative densitometry, respectively. F: TAK-1 siRNA transfection prevented the LPS-induced drop in Caco-2 cell transepithelial electrical resistance (TER). G: TAK-1 siRNA transfection inhibited the LPS-induced increase in Caco-2 inulin flux. H: NIK or MEKK-1 siRNA in transfection in Caco-2 cells did not prevent the LPS-induced drop in Caco-2 TER. Data are expressed as means ± SEM. n = 4 experiments (A). ∗∗∗P < 0.001 versus control; ††P < 0.01 versus LPS day 3; ‡‡P < 0.01 versus LPS day 3.5; §§P < 0.01 versus nontarget (NT) siRNA. Scale bars = 5 μm. C, control.
Figure 6
Figure 6
Effect of toll-like receptor (TLR)-4, myeloid differentiation primary response (MyD)88, and transforming growth factor-β–activating kinase (TAK)-1 siRNA on lipopolysaccharide (LPS)-induced activation of NF-κB canonical pathway in Caco-2 cells. A: TAK-1 siRNA transfection in Caco-2 cells prevented LPS-induced degradation of inhibitory κ B (IκB)-α protein expression compared with nontarget (NT) siRNA-transfected LPS-treated cells. Relative densitometry analysis of IκB-α protein levels. B: TLR-4 siRNA and MyD88 siRNA transfection in Caco-2 cells prevented LPS-induced increase in TAK-1 phosphorylation. Relative densitometry analysis of pTAK-1 protein levels. C: Confocal immunofluorescence showed that TLR-4, MyD88, and TAK-1 siRNA transfection of Caco-2 monolayers prevented the LPS-induced p65 (red) translocation to the nucleus (blue) (arrowhead) at 3 day after LPS exposure D: TLR-4 siRNA and MyD88 siRNA transfection in Caco-2 cells prevented LPS-induced degradation of IκB-α protein expression. Densitometry of IκB-α protein levels. E: TAK-1 siRNA transfection in Caco-2 cells prevented LPS-induced activation of IκB kinase (IKK)-α and IKK-β compared with nontarget (NT) siRNA-transfected LPS-treated cells. Relative densitometry analysis of IKK-α and IKK-β is also shown. n = 4 experiments. ∗∗P < 0.01, ∗∗∗P < 0.001 versus control; ††P < 0.01, †††P < 0.001 versus LPS. Scale bars: 5 μm (C). C, control.
Figure 7
Figure 7
Effect of genetic knockdown of (p65/p50) canonical pathway and transforming growth factor-β–activating kinase (TAK)-1 on lipopolysaccharide (LPS)-induced activation of myosin light chain kinase (MLCK) protein expression. A: TAK-1 siRNA transfection in Caco-2 cells prevented LPS-induced increase in MLCK mRNA. B: Similarly, TAK-1 siRNA transfection in Caco-2 cells also inhibited LPS-induced increase in MLCK and phosphoMLC protein expression by Western blot analysis and was shown by relative densitometry of MLCK protein. C: p65 siRNA transfection in Caco-2 cells prevented LPS-induced increase in MLCK mRNA. D: p50 and p65 siRNA transfection in Caco-2 cells caused marked inhibition of LPS-induced increase in MLCK protein expression, as analyzed by Western blot analysis and relative analysis of MLCK protein levels by densitometry. n = 3 experiments (A); n = 4 experiments (B and D). ∗∗P < 0.01 versus nontarget siRNA control; ††P < 0.01 versus LPS. C, control; NT, nontarget.
Figure 8
Figure 8
Activation of p65/p50 canonical pathway by lipopolysaccharide (LPS) in mice enterocytes and effect of NF-κB inhibitors on LPS-induced increase in mouse intestinal epithelial tight junction permeability. A: LPS i.p. injections (0.1 mg/kg body weight) in mice caused activation of canonical p65/p50 pathway, as assessed by degradation of inhibitory κ B (IκB)-α protein expression on day 3 in mice enterocytes. Densitometry of IκB-α protein levels. B: The immunoblot analysis from LPS-treated mice enterocytes revealed significant increase in nuclear p65 protein expression on day 3 compared with untreated mice enterocytes. Glyceraldehyde-3-phosphate dehydrogenase (GAPDH) and Lamin B were used as loading controls for cytoplasmic (cyto) and nuclear (nuc) fractions, respectively C: Confocal immunofluorescence of mouse intestines treated with LPS (0.1 mg/kg body weight) on day 3 indicated p65 (red) (arrowheads) translocation to the nucleus (blue) compared with control (C) mouse enterocytes. D: NF-κB inhibitor, ammonium pyrrolidinedithiocarbamate (PDTC; 10 mg/kg body weight), and Bay-11 (5 mg/kg body weight) pretreatment prevented the LPS-induced increase in 10K dextran flux. PDTC and Bay-11 were dissolved in dimethyl sulfoxide and injected 1 hour before LPS treatment. Data are expressed as means ± SEM. n = 4 experiments (A and C); n = 3 experiments (B). ∗∗P < 0.01 versus control vehicle; ††P < 0.01 versus LPS. Scale bars = 5 μm.
Figure 9
Figure 9
Lipopolysaccharide (LPS) activated transforming growth factor-β–activating kinase (TAK)-1 in vivo, and TAK-1 inhibition prevented the LPS-induced increase in mouse intestinal epithelial tight junction permeability. A: LPS i.p. injections (0.1 mg/kg body weight) in mice caused activation of TAK-1 (phopshoTAK-1) expression by day 3. Densitometry of phosphoTAK-1 protein levels. B: Confocal immunofluorescence showed increase in phopshoTAK-1 expression (green) (arrowheads) (nucleus, blue) in the intestines (enterocytes) of mice treated with LPS (0.1 mg/kg body weight). C: Pretreatment with TAK-1 inhibitor (Inh), oxozeaenol (5 mg/kg body weight), prevented the LPS-induced increase in 10K dextran flux. Oxozeaenol was dissolved in dimethyl sulfoxide and injected intraperitoneally, 1 hour before LPS injection. n = 3 experiments (A and B). ∗∗P < 0.01, ∗∗∗P < 0.001 versus control; †††P < 0.001 versus LPS. Scale bars = 5 μm. C, control.
Figure 10
Figure 10
Lipopolysaccharide (LPS)-induced activation of NF-κB canonical pathway was inhibited in toll-like receptor (TLR)-4−/− and myeloid differentiation primary response (MyD)88−/− mice and with transforming growth factor-β–activating kinase (TAK)-1 inhibition. A: LPS i.p. injections (0.1 mg/kg body weight) in TLR-4−/− and MyD88−/− mice did not induce inhibitory κ B (IκB)-α degradation (day 3) compared with TLR4+/+ and MyD88+/+ control (C) mice, respectively. Densitometry of IκB-α protein. B: Pretreatment with TAK-1 inhibitor (in; inh), oxyzeanol (Oxz; 5 mg/kg body weight), prevented the LPS-induced degradation of IκB-α expression (day 3) compared with vehicle- or LPS-treated mice. Densitometry of IκB-α protein levels. n = 3 experiments. ∗∗P < 0.01 versus control; ††P < 0.01 versus LPS.
Figure 11
Figure 11
Effect of inhibition of NF-κB pathway and transforming growth factor-β–activating kinase (TAK)-1 on lipopolysaccharide (LPS)-induced activation of myosin light chain kinase (MLCK) expression in mouse enterocytes. A: NF-κB inhibitor ammonium pyrrolidinedithiocarbamate (PDTC) prevented LPS-induced increase in MLCK protein expression (5 day) compared with vehicle- or LPS-treated mice. Densitometry of MLCK protein levels. B: NF-κB inhibitor Bay-11 also prevented LPS-induced increase in MLCK protein expression (5 day) compared with vehicle- or /LPS-treated mice. Densitometry of MLCK protein levels. C: Pretreatment with TAK-1 inhibitor (in; inh), oxyzeanol (Oxz; 5 mg/kg body weight), prevented the LPS-induced increase in MLCK protein expression (5 day) compared with vehicle- or LPS-treated mice. Densitometry of MLCK protein levels. n = 3 experiments. ∗∗P < 0.01 versus control; ††P < 0.01 versus LPS. C, control.
Figure 12
Figure 12
Proposed scheme of the intracellular pathways involved in lipopolysaccharide (LPS)-induced activation of canonical NF-κB pathway. LPS treatment results in activation of the toll-like receptor (TLR)-4 signal transduction and myeloid differentiation primary response (MyD)88-dependent signaling cascade. Activation of TLR-4/MyD88 signal transduction pathway leads to the activation of IL-1 receptor-associated kinase (IRAK)-4 and phosphorylation of transforming growth factor-β–activating kinase (TAK)-1, leading to the activation of canonical NF-κB pathway of both inhibitory κ B (IκB) kinases (IKKs), IKK-α and IKK-β, which further leads to degradation of IκB-α and nuclear translocation of NF-κB p65/p50. The activation of TAK-1 and canonical NF-κB p65/p50 causes up-regulation of myosin light chain kinase (MLCK) gene and protein expression, ultimately increasing tight junction (TJ) permeability in vitro and in vivo.

References

    1. Turner J.R. Intestinal mucosal barrier function in health and disease. Nat Rev Immunol. 2009;9:799–809. - PubMed
    1. Turner J.R. Molecular basis of epithelial barrier regulation: from basic mechanisms to clinical application. Am J Pathol. 2006;169:1901–1909. - PMC - PubMed
    1. Clark J.A., Doelle S.M., Halpern M.D., Saunders T.A., Holubec H., Dvorak K., Boitano S.A., Dvorak B. Intestinal barrier failure during experimental necrotizing enterocolitis: protective effect of EGF treatment. Am J Physiol Gastrointest Liver Physiol. 2006;291:G938–G949. - PubMed
    1. Oriishi T., Sata M., Toyonaga A., Sasaki E., Tanikawa K. Evaluation of intestinal permeability in patients with inflammatory bowel disease using lactulose and measuring antibodies to lipid A. Gut. 1995;36:891–896. - PMC - PubMed
    1. Arrieta M.C., Madsen K., Doyle J., Meddings J. Reducing small intestinal permeability attenuates colitis in the IL10 gene-deficient mouse. Gut. 2009;58:41–48. - PMC - PubMed

Publication types

MeSH terms