. 2019 May;156(6):1849-1861.e13.
doi: 10.1053/j.gastro.2019.01.252. Epub 2019 Jan 31.

MET Inhibitors Promote Liver Tumor Evasion of the Immune Response by Stabilizing PDL1

Affiliations

MET Inhibitors Promote Liver Tumor Evasion of the Immune Response by Stabilizing PDL1

Hui Li et al. Gastroenterology. 2019 May.

Abstract

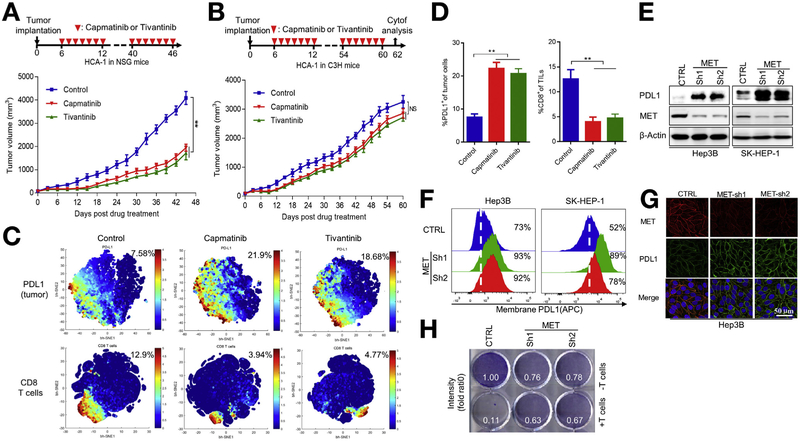
Background & aims: Inhibitors of MET have not produced satisfactory outcomes in trials of patients with liver cancer. We investigated the mechanisms of liver tumor resistance to MET inhibitors in mice.

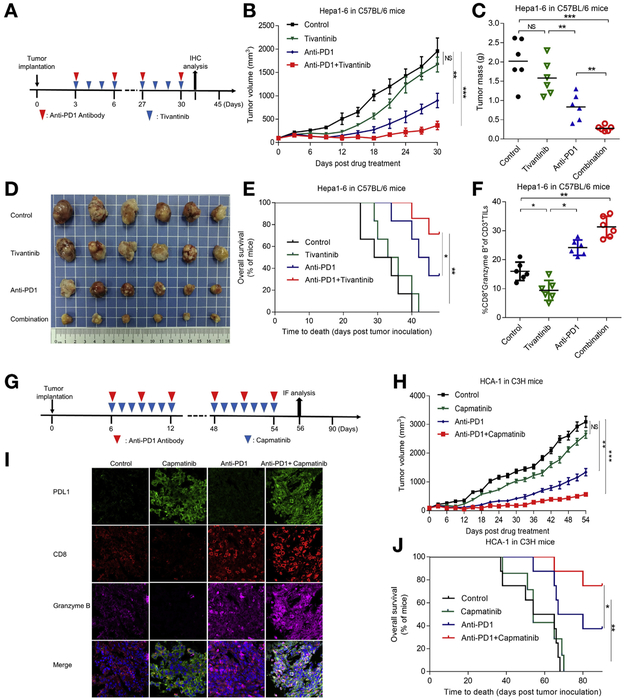
Methods: We tested the effects of MET inhibitors tivantinib and capmatinib in the mouse hepatocellular carcinoma (HCC) cell line HCA-1 and in immune-competent and immunodeficient mice with subcutaneous tumors grown from this cell line. Tumors were collected from mice and tumor cells were analyzed by time-of-flight mass cytometry. We used short hairpin RNAs to weaken expression of MET in Hep3B, SK-HEP-1, HA59T, and HA22T liver cancer cell lines and analyzed cells by immunoblot, immunofluorescence, and immunoprecipitation assays. Mass spectrometry was used to assess interactions between MET and glycogen synthase kinase 3β (GSK3B), and GSK3B phosphorylation, in liver cancer cell lines. C57/BL6 mice with orthotopic tumors grown from Hep1-6 cells were given combinations of capmatinib or tivantinib and antibodies against programmed cell death 1 (PDCD1; also called PD1); tumors were collected and analyzed by immunofluorescence. We analyzed 268 HCCsamples in a tissue microarray by immunohistochemistry.

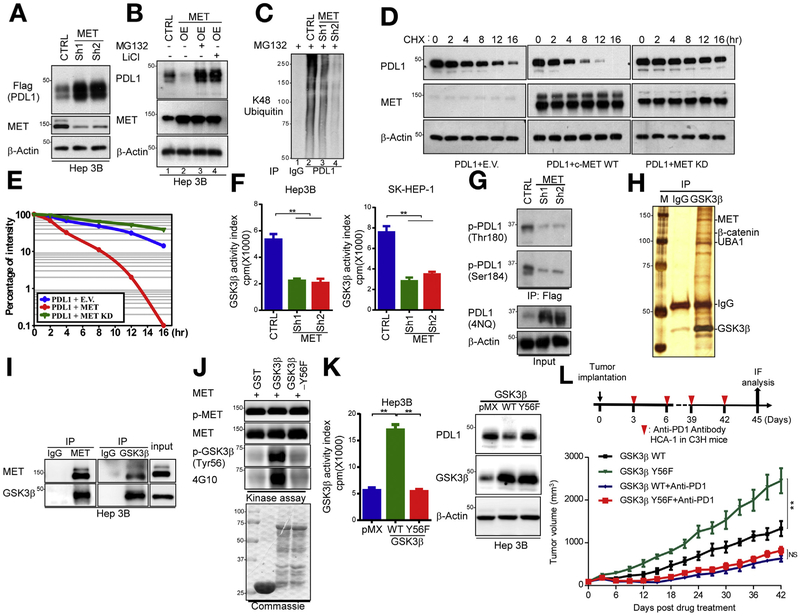
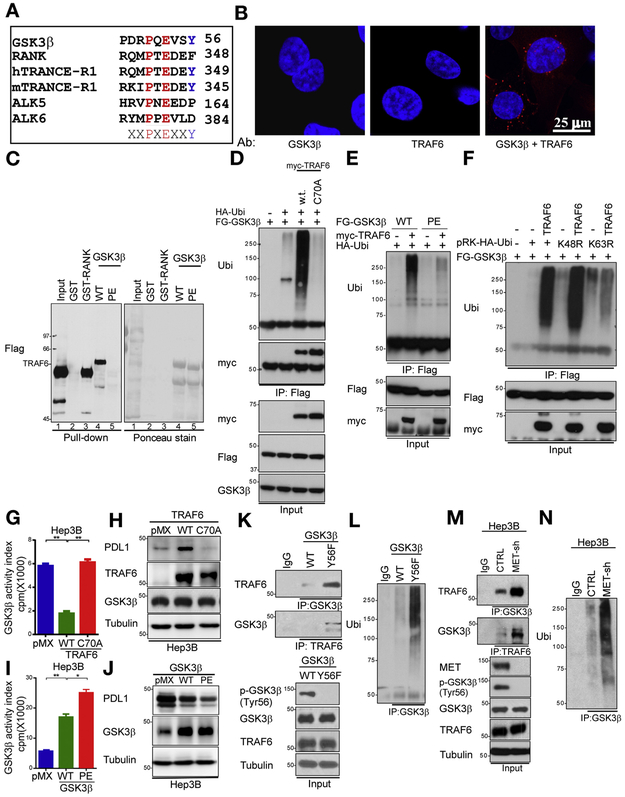
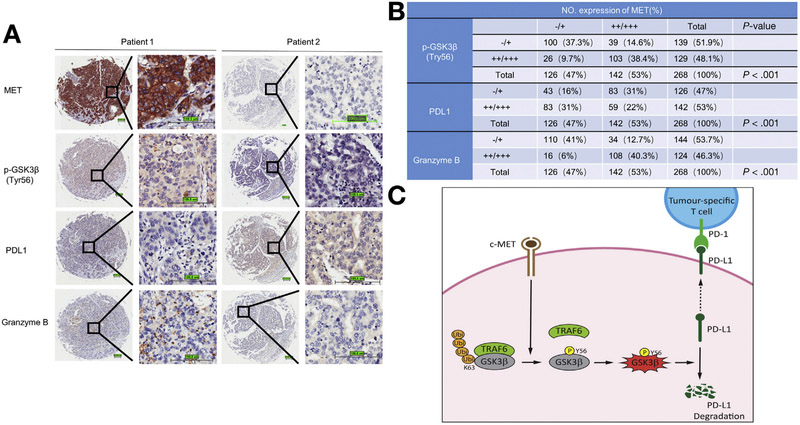
Results: Exposure of liver cancer cell lines to MET inhibitors increased their expression of PD ligand 1 (PDL1) and inactivated cocultured T cells. MET phosphorylated and activated GSK3B at tyrosine 56, which decreased the expression of PDL1 by liver cancer cells. In orthotopic tumors grown in immune-competent mice, MET inhibitors decreased the antitumor activity of T cells. However, addition of anti-PD1 decreased orthotopic tumor growth and prolonged survival of mice compared with anti-PD1 or MET inhibitors alone. Tissue microarray analysis of HCC samples showed an inverse correlation between levels of MET and PDL1 and a positive correlation between levels of MET and phosphorylated GSK3B.

Conclusions: In studies of liver cancer cell lines and mice with orthotopic tumors, MET mediated phosphorylation and activated GSK3B, leading to decreased expression of PDL1. Combined with a MET inhibitor, anti-PD1 and anti-PDL1 produced additive effect to slow growth of HCCs in mice.

Keywords: Glycogen Synthase Kinase 3; Hepatocellular Carcinoma; Programmed Cell Death Ligand 1; Tumor Necrosis Factor Receptor-Associated Factor 6.


Conflict of interest statement

Conflicts of interest

The authors disclose no competing financial interests (financial, professional, and personal).

Figures

Figure 1.
Figure 1.
MET inhibition up-regulates PDL1 expression in HCC cells and induces T-cell suppression. (A) Growth of tumors generated by HCA-1 cells in NSG mice after drug intervention with capmatinib or tivantinib. (Top) Summary of drug intervention protocol. Tumors were measured at the indicated time points. (Bottom) Quantification of tumor-volume changes. (B) HCA-1 tumor growth in C3H mice after drug intervention with capmatinib or tivantinib. (Bottom) Quantification of tumor-volume changes. (C) viSNE map derived from time-of-flight mass spectrometric analysis of HCA-1 tumors in mice after drug intervention with capmatinib or tivantinib. Tumor cell populations were detected using PDL1 and CD8 as markers. Cells in the map are color coded according to the intensity of the expression of the indicated markers. (D) Quantification of PDL1+ tumor cell populations and CD8+ TIL populations in HCA-1 tumors assessed using time-of-flight mass spectrometric analysis and analyzed using viSNE (n = 3). **P < .01 by Student t test. All error bars represent mean ± standard deviation. (E) Immunoblot of MET protein expression and PDL1 expression induced by a vector control and MET knockdown in Hep3B and SK-HEP-1 cells. (F) Flow cytometric analysis of cell-surface PDL1 expression in Hep3B (left) and SK-HEP-1 (right) cells. (G) Confocal microscopic images showing MET and PDL1 protein expression in vector control and MET-knockdown Hep3B cells. Scale bar, 50 γm. (H) T-cell-mediated tumor cell killing assay of Hep3B cells expressing vector control or MET shRNA. Activated T cells and Hep3B cells were cocultured in 12-well plates for 4 days, and the surviving tumor cells were visualized using crystal violet staining. Relative fold ratios of surviving cell intensities are shown. APC, allophycocyanin; CTRL, control; Cytof, time-of-flight mass cytometry; NSG, nonobese diabetic and severe combined immunodeficiency gamma; TIL, tumor-infiltrating lymphocyte.
Figure 2.
Figure 2.
MET blockade drives PDL1 expression by suppression of GSK3B-mediated PDL1 degradation in HCC cells. (A) Western blot analysis of Flag-PDL1 expression using Flag antibody in MET-knockdown Hep3B cells transfected with Flag-PDL1. (B) Immunoblot analysis of whole cell lysates derived from vector control or MET-overexpressing Hep3B cells given MG132 (5 μmol/L) for 16 hours and LiCl (25 μmol/L) for 5 hours. (C) Ubiquitination assay of PDL1 in MET-knockdown Hep3B cells. Ubiquitinated PDL1 was immuno-precipitated and subjected to western blot analysis with antibody against ubiquitin. Cells were treated with MG132 before ubiquitination analysis. (D) Stability of PDL1 protein in Hep3B cells transfected with HA-PDL1 and WT Flag-MET or MET-KD. Cells were treated with CHX 20 mmol/L at the indicated intervals and subjected to western blot analysis. (E) Quantification of PDL1 half-life in indicated groups. (F) Kinase activity of GSK3B in MET-knockdown Hep3B and SK-HEP-1 cells according to an in vitro kinase assay and phosphorylation analysis. Columns indicate mean activity after subtraction of background phosphorylation. **P < .01. (G) Western blot analysis of PDL1 phosphorylation at T180 and S184 by phospho-Y180 and phospho-S184 PDL1 antibodies in vector control and MET-knockdown Hep3B cells, respectively. (H) Coomassie blue staining of GSK3B-interacting proteins in Hep3B cells. Interacting proteins were isolated and identified by mass spectrometry. (I) Endogenous co-immunoprecipitation of Hep3B cells using MET and GSK3B antibodies. Cell lysates were analyzed by western blotting. (J) In vitro assay of GSK3B phosphorylation by MET at Y56. Purified WT GST-GSK3B and Y56F were incubated with recombinant MET kinase in the presence of adenosine triphosphate at 30°C for 30 minutes. Protein lysates were analyzed by western blotting. (K) (Left) Kinase activity of GSK3B in Hep3B and SK-HEP-1 cells expressing pMX (empty vector), WT GSK3B, or GSK3B Y56F by in vitro kinase assay and phosphorylation analysis. **P < .01. (Right) immunoblot of PDL1 and GSK3B expression in Hep3B cells transiently transfected with pMX (empty vector), WT GSK3B, and/or GSK3B Y56F. (L) (Top) Schematic of drug intervention protocol for PD1 antibody in C3H mice. At the drug intervention end point, tumors were isolated for immunofluorescent analysis. (Bottom) Growth of HCA-1 tumors in C3H mice that were treated with or without the PD1 antibody. Tumors were measured at the indicated time points. CHX, cycloheximide; CTRL, control; E.V., empty vector; GST, glutathione S-transferase; HA-PDL1, hemagglutinin-tagged PDL1; IgG, immunoglobulin G; IP, immuno-precipitated; KD, kinase-dead; OE, overexpression.
Figure 3.
Figure 3.
Y56 phosphorylation up-regulates GSK3B activity by suppression of TRAF6-mediated GSK3B K63 ubiquitination. (A) Sequence alignment of TRAF6 consensus motif in GSK3B. The MET phosphorylation site (GSK3B Y56) is located in a consensus TRAF6-binding motif (PXEXXAc). (B) Interaction of endogenous GSK3B and TRAF6 proteins in Hep3B cells. Cells were immunostained with GSK3B and TRAF6 antibodies and assessed by a Duolink II assay. Red foci indicate associations between GSK3B and TRAF6 proteins. Scale bar, 25 μm. (C) Hep3B cells expressing TRAF6 were incubated with bacteria-purified GST-RANK, WT GSK3B, or GSK3B PE. An in vitro binding assay was performed, and the results were analyzed by western blotting. (D) Hep3B cells were transfected with the indicated plasmids and subjected to immunoprecipitation using a Flag antibody. Ubiquitination of transfected cells was analyzed by western blotting. (E) Hep3B cells were transfected with the indicated plasmids and subjected to immunoprecipitation using a Flag antibody. Ubiquitination of transfected cells was analyzed by western blotting. (F) Hep3B cells were transfected with the indicated plasmids. Then, cells were immuno-precipitated with a Flag antibody and subjected to western blotting with a ubiquitin antibody. (G) The kinase activity of GSK3B in Hep3B cells expressing pMX (empty vector), WT TRAF6, or TRAF6 C70A as determined by in vitro kinase assay and phosphorylation analysis. **P < .01. (H) Immunoblot of PDL1 expression in Hep3B cells transiently transfected with pMX (empty vector), WT TRAF6, or TRAF6 C70A. (I) Kinase activity of GSK3B in Hep3B cells expressing pMX (empty vector), WT GSK3B, or GSK3B PE as determined by in vitro kinase assay and phosphorylation analysis. **P < .01. (J) Immunoblot of PDL1 expression in Hep3B cells transiently transfected with pMX (empty vector), WT GSK3B, or GSK3B PE. (K) Co-immunoprecipitation of TRAF6 and GSK3B in WT GSK3B and GSK3B PE Hep3B cells with GSK3B and TRAF6 antibodies. (L) GSK3B was immuno-precipitated from Hep3B cells transfected with WT GSK3B and GSK3B PE. Ubiquitination in the transfected cells was examined by Western blotting. (M) Co-immunoprecipitation of TRAF6 and GSK3B in vector control and MET-knockdown Hep3B cells with GSK3B and TRAF6 antibodies. (N) Endogenous GSK3B was immuno-precipitated from Hep3B cells transfected with a vector control or MET shRNA. A ubiquitination assay in vector control and MET-knockdown Hep3B cells was performed by western blotting. Ab, antibody; GST, glutathione S-transferase; IgG, immunoglobulin G; IP, immunoprecipitation; RANK, receptor activator of nuclear factor κB; Ub, ubiquitination.
Figure 4.
Figure 4.
Anti-PD1 therapy in combination with MET blockade improves antitumor activity of MET inhibitor in HCC. (A) Schematic of drug intervention protocol for tivantinib and PD1 antibody in C57/BL6 mice. At the drug intervention end point, tumors were obtained for immunohistochemical analysis. (B) Growth of orthotopic Hep1-6 tumors in tivantinib- and/or PD1 antibody-treated C57/BL6 mice. Tumors were measured at the indicated time points. (C) Weights of tumors at drug intervention end point. (D) Representative images of orthotopic C57/BL6 mouse tumors without the liver. (E) Survival of mice bearing Hep1-6 tumors after drug intervention with capmatinib and/or PD1 antibody. Significance was determined using log-rank test. (F) Intracellular cytokine staining of CD8+ and granzyme B+ cells in CD3+ T-cell populations from isolated tumor-infiltrating lymphocytes. Results are presented as mean ± standard deviation from a representative experiment. (G) Schematic of drug intervention protocol for the MET inhibitor capmatinib and PD1 antibody in C3H mice. At the drug intervention end point, tumors were isolated for immunofluorescent analysis. (H) Growth of HCA-1 tumors in C3H mice given capmatinib and/or PD1 antibody. Tumors were measured at indicated time points. (I) Immunofluorescent staining of PDL1, CD8, and granzyme B protein expression patterns in HCA-1 cells. (J) Survival of mice bearing HCA-1 tumors after drug intervention with capmatinib and/or PD1 antibody. *P < .05; **P < .01; ***P < .001. All error bars represent mean ± standard deviation. NS, not significant.
Figure 5.
Figure 5.
Clinical relevance of MET, p-GSK3B (Y56), PDL1, and granzyme B expression in patients with HCC. (A) Representative immunohistochemical staining of HCC tumors for MET, p-GSK3B (Y56), PDL1, and granzyme B expression. (B) Correlations among MET, p-GSK3B (Y56), PDL1, and granzyme B expression levels in patients with liver cancer. P value by Pearson χ2; −/+, negative or low expression; ++/+++, medium or high expression. Scale bar, 100 μm. (C) Proposed working model. MET directly phosphorylates GSK3B at Y56, activates GSK3B by blocking TRAF6-mediated K63 ubiquitination, and decreases PDL1 expression by K48 ubiquitination in HCC. Ubi, ubiquitination.

Comment in

References

    1. El-Serag HB. Hepatocellular carcinoma. N Engl J Med 2011;365:1118–1127. - PubMed
    1. Llovet JM, Ricci S, Mazzaferro V, et al. Sorafenib in advanced hepatocellular carcinoma. N Engl J Med 2008; 359:378–390. - PubMed
    1. Bruix J, Qin S, Merle P, et al. Regorafenib for patients with hepatocellular carcinoma who progressed on sorafenib treatment (RESORCE): a randomised, double-blind, placebo-controlled, phase 3 trial. Lancet 2017; 389:56–66. - PubMed
    1. Kudo M, Finn RS, Qin S, et al. Lenvatinib versus sorafenib in first-line treatment of patients with unresectable hepatocellular carcinoma: a randomised phase 3 non-inferiority trial. Lancet 2018; 391:1163–1173. - PubMed
    1. Abou-Alfa GK, Meyer T, Cheng AL, et al. Cabozantinib in patients with advanced and progressing hepatocellular carcinoma. N Engl J Med 2018;379:54–63. - PMC - PubMed

Publication types

MeSH terms