. 2019 Feb 11;35(2):283-296.e5.
doi: 10.1016/j.ccell.2018.12.013. Epub 2019 Jan 31.

A Murine Model of Chronic Lymphocytic Leukemia Based on B Cell-Restricted Expression of Sf3b1 Mutation and Atm Deletion

Affiliations

A Murine Model of Chronic Lymphocytic Leukemia Based on B Cell-Restricted Expression of Sf3b1 Mutation and Atm Deletion

Shanye Yin et al. Cancer Cell. .

Abstract

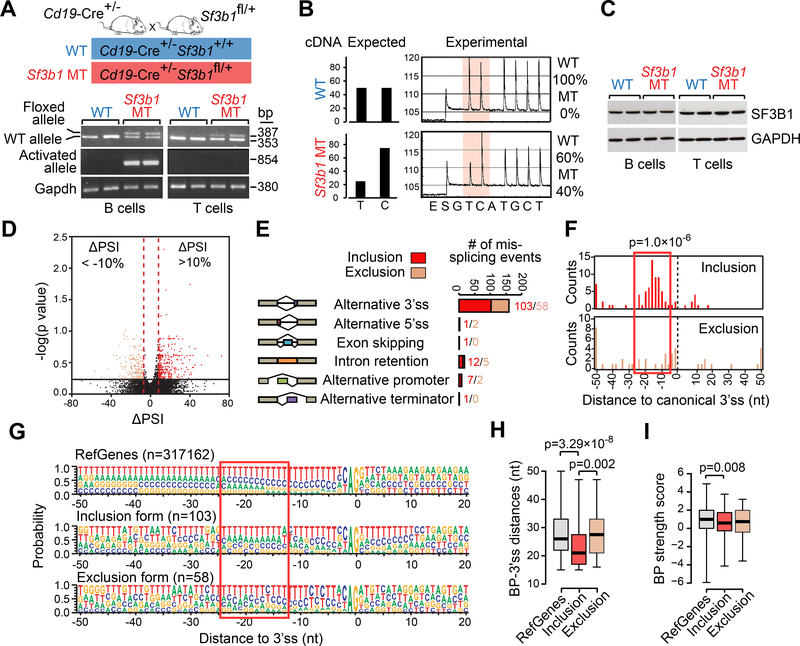
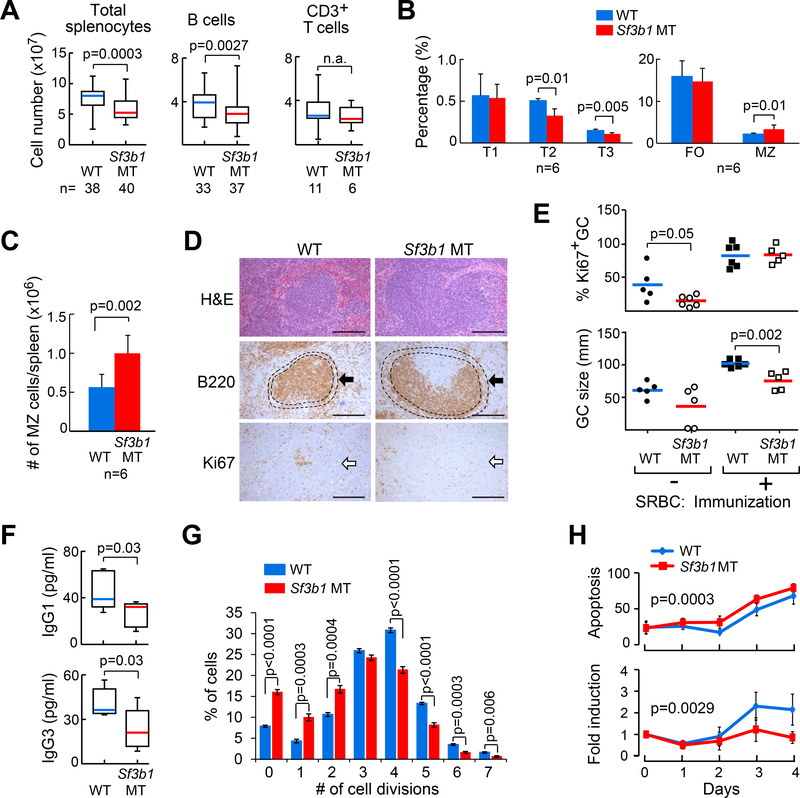
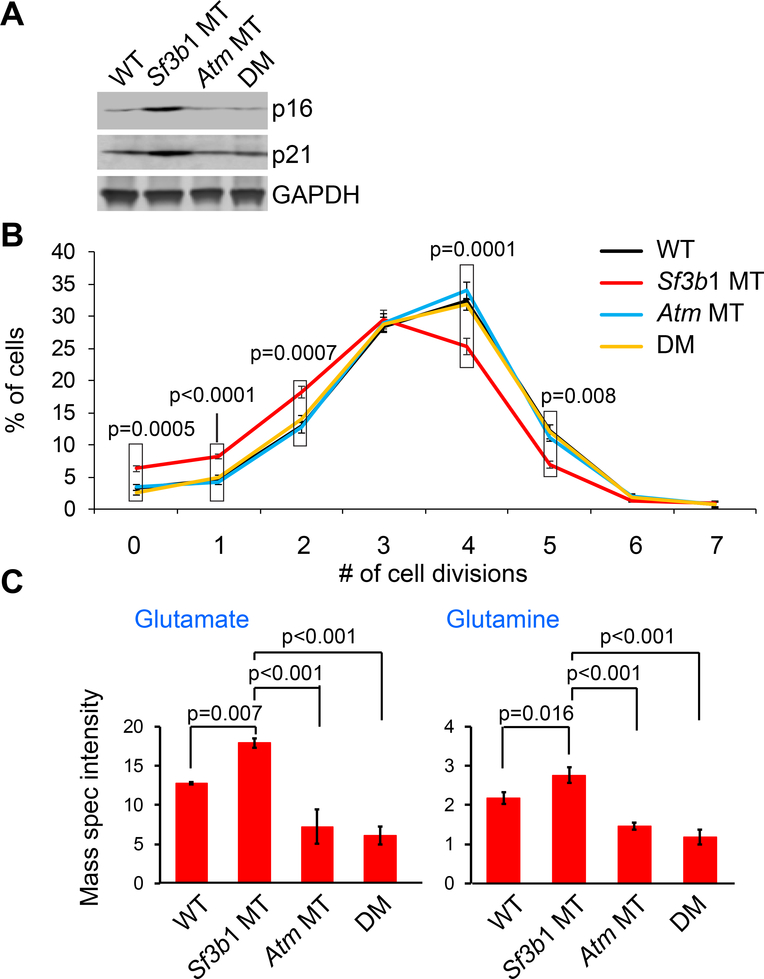
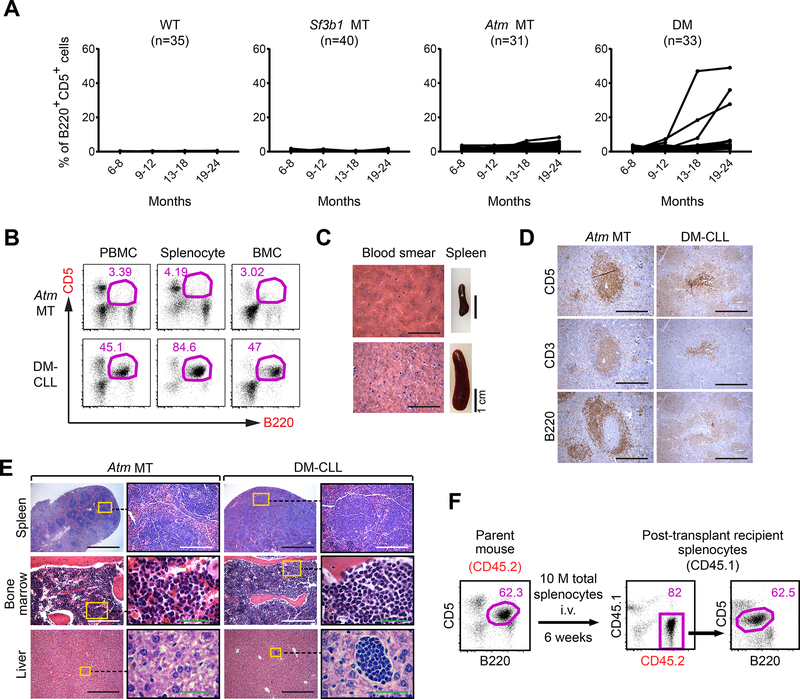
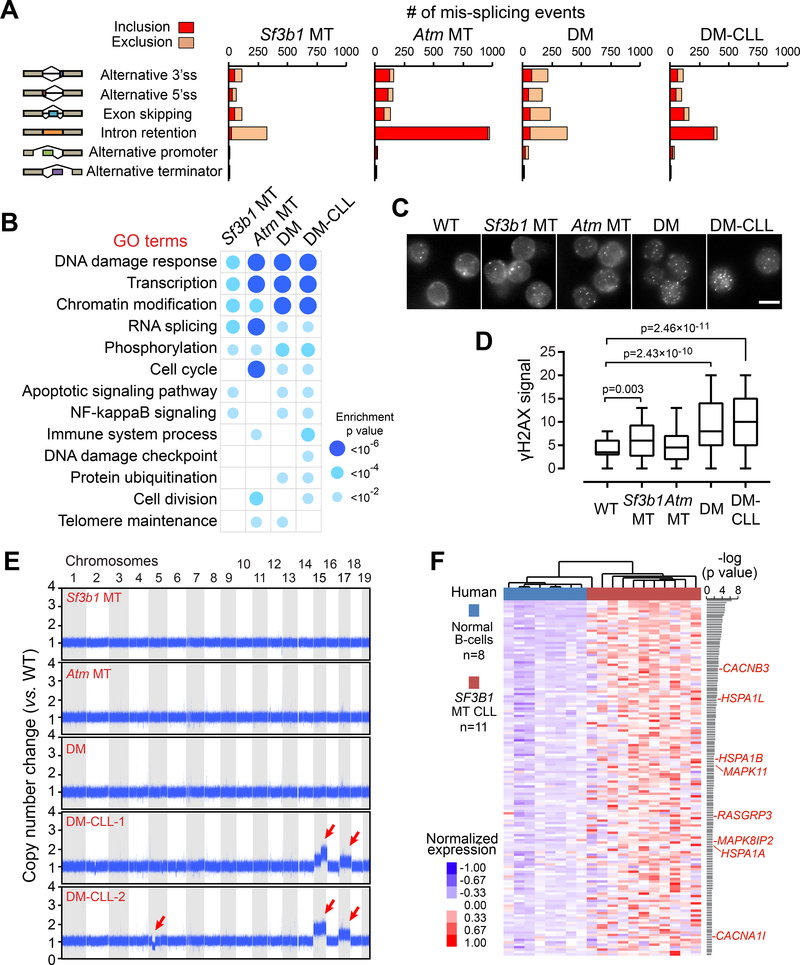
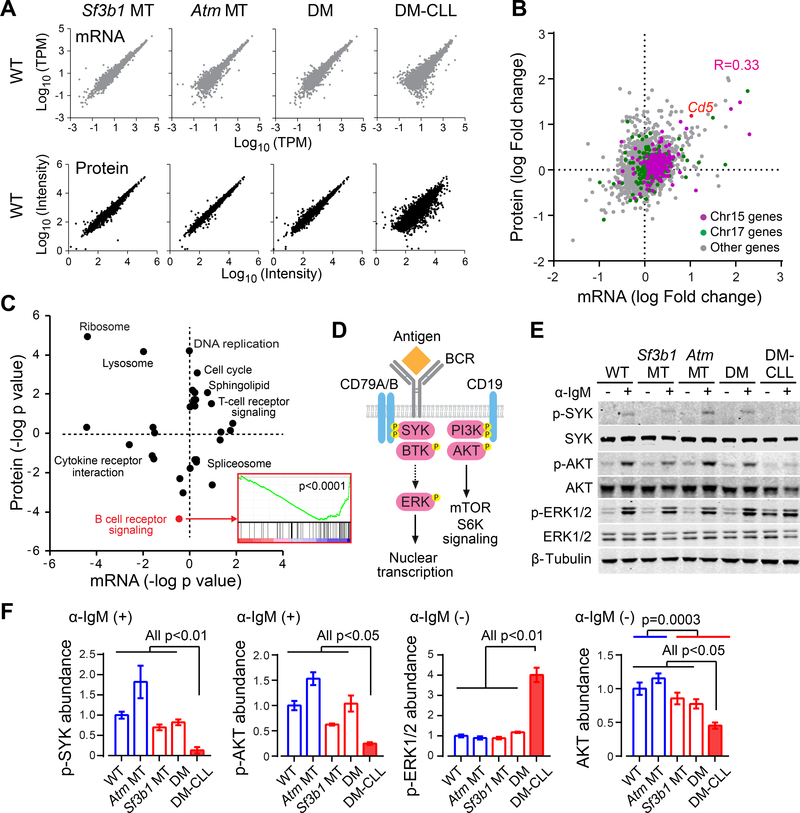
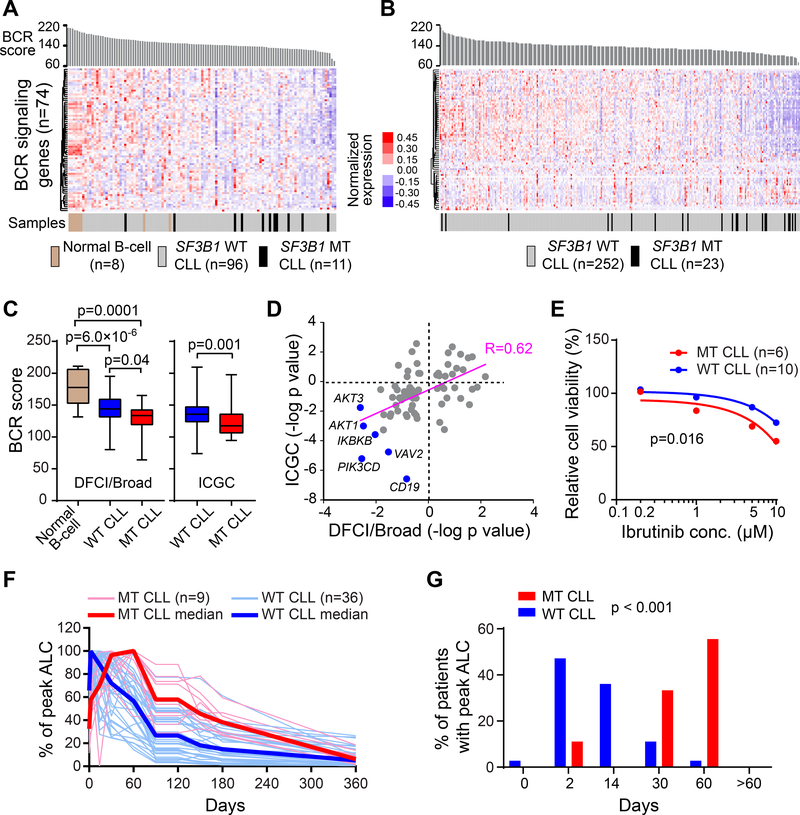
SF3B1 is recurrently mutated in chronic lymphocytic leukemia (CLL), but its role in the pathogenesis of CLL remains elusive. Here, we show that conditional expression of Sf3b1-K700E mutation in mouse B cells disrupts pre-mRNA splicing, alters cell development, and induces a state of cellular senescence. Combination with Atm deletion leads to the overcoming of cellular senescence and the development of CLL-like disease in elderly mice. These CLL-like cells show genome instability and dysregulation of multiple CLL-associated cellular processes, including deregulated B cell receptor signaling, which we also identified in human CLL cases. Notably, human CLLs harboring SF3B1 mutations exhibit altered response to BTK inhibition. Our murine model of CLL thus provides insights into human CLL disease mechanisms and treatment.

Keywords: ATM; BCR signaling; CLL; SF3B1; murine model.


Conflict of interest statement

DECLARATION OF INTERESTS

C.J.W. is a co-founder of Neon therapeutics. C.J.W., D.N. and G.G. receive research funding from Pharmacyclics. B.L.E. has been a consultant for H3 Biomedicine and received research funding from Celgene. G.G receives research funds from IBM. G.G. is an inventor on patent applications related to MuTect, ABSOLUTE and other bioinformatics methods. J.A.D. has received honoraria for participation in advisory board from Merck. J.A.D. has received research funding from Constellation Pharmaceuticals. J.S. is a current employee of Moderna Therapeutics. All other authors do not have any relevant conflict of interest.

Figures

Figure 1.
Figure 1.. Conditional expression of Sf3b1-K700E in mouse B cells.
(A) PCR of genomic DNA from B and T cells from mice with WT or MT Sf3b1 to detect the floxed allele and the activated Sf3b1-K700E allele. (B) The percentages of WT or MT Sf3b1 alleles from pyrosequencing profiles in B cells are shown. (C) Western blot of SF3B1 in B cells and T cells with WT and MT Sf3b1 are shown. Two biological replicates are shown for each group. (D) Volcano plot shows ΔPSI versus log10 (p value) of all splicing changes identified by JuncBASE. Events with |ΔPSI|>10% and p<0.05 were considered significant. (E) Different categories of mis-splicing events in MT versus WT cells are shown. Events with ΔPSI>10% were defined as inclusion and events with ΔPSI<−10% were defined as exclusion in MT compared to WT cells. (F) Histogram shows the distance between the alternative and canonical 3’ss. The 0 point defines the position of the canonical 3’ss. (G) Sequence motifs around all RefGene 3’ss, MT inclusion 3’ss and MT exclusion 3’ss are shown. The height of each letter indicates the probability that nucleotide is used at that position. The red box highlights the region with heightened usage of adenosine upstream of the inclusion 3’ss. (H) The distance between the predicted branch point and the corresponding 3’ss are shown. The 0 point defines the position of the 3’ss. (I) The strength of the branch point associated with different groups of 3’ss are shown. In H and I, center lines show the means; box limits indicate the 25th and 75th percentiles and whiskers extend to minimum and maximum values. See also Figures S1 and S2, and Table S1.
Figure 2.
Figure 2.. Expression of Sf3b1-K700E affects B cell proliferation in vitro and in vivo.
(A) The number of total splenocytes, splenic B cells and CD3+ T cells in WT and Sf3b1 MT mice are shown. Center lines indicate the means; box limits indicate the 25th and 75th percentiles; whiskers extend to minimum and maximum values. (B) The percentages of different B cell populations in the spleens of WT and Sf3b1 MT mice are shown. T1-T3: transitional B cells, FO: follicular B cells, MZ: marginal zone B cells. (C) The absolute counts of marginal zone B cells per spleen are shown. Average and standard deviation are plotted. For both B and C, data represent Mean±SD of results derived from 6 WT and 6 MT mice, and were analyzed using Student’s t-test. (D) Hematoxylin and Eosin (HE) staining and immunohistochemical staining of spleen sections from WT and MT mice are shown. Arrow indicates marginal zone stained with an α-B220 antibody. Proliferative germinal centers were stained with an α-Ki67 antibody. Scale bar: 250 μm. (E) The percentage and size of germinal centers identified by Ki67 staining in WT and Sf3b1 MT mice are shown. Center lines indicate the means. (F) Abundance of serum IgG3 and IgG1 antibodies in WT (n=9) and Sf3b1 MT (n=7) mice are shown. Center lines indicate the means; box limits indicate the 25th and 75th percentiles; whiskers extend to minimum and maximum values. (G) WT and Sf3b1 MT cells were stimulated with LPS+IL4 for 3 days in vitro and multiple generations were traced using CellTrace violet dye dilution and flow cytometry. Data represent Mean±SD of results derived from 5 WT and 5 MT mice, and were analyzed using ANOVA. (H) Apoptosis and proliferation of cells described in (G) are shown. Apoptosis rates were determined by Annexin V staining and flow cytometry. Data represent Mean±SD of results derived from 6 WT and 7 MT mice. See also Figure S3.
Figure 3.
Figure 3.. Atm deletion overcomes Sf3b1 mutation induced-cellular senescence.
(A) Western blot of senescence markers p16 and p21 in B cells from the different groups of mice are shown. (B) The percentage of B cells undergoing different numbers of cell divisions upon stimulation with LPS+IL4 were shown. Data represent Mean±SD of three replicates. The p values indicate the difference between Sf3b1 MT and other groups in each division point, using ANOVA. (C) Abundance of glutamate and glutamine in splenic B cells from the different mice groups are shown. Data represent Mean±SD of mass spectrometry intensities of three replicates and were analyzed using a one-way ANOVA with the Scheffe correction for multiplicity of testing. See also Figures S4.
Figure 4.
Figure 4.. Combined Sf3b1 mutation and Atm deletion cause CLL.
(A) The percentage of CLL-like cells (B220+CD5+) within the lymphocyte population in the different groups of mice over time are shown. (B) Flow cytometry data identified B220+CD5+ cells within peripheral blood mononuclear cells (PBMCs), splenocytes and bone marrow mononuclear cells (BMCs) of Atm MT and DM-CLL mice. (C) H&E staining of blood smears and spleen of Atm MT and DM-CLL mice are shown. Scale bar for blood smear images:1 mm. (D) Immunohistochemical staining show CD5, CD3 and B220 signals on the consective sections of spleens from Atm MT and DM-CLL mice. Scale bar: 250 μm. (E) H&E staining shows leukemia cells infiltration in the spleen, bone marrow and liver tissues in the Atm MT and DM-CLL mice. Black scale bar: 1 mm; White scale bar: 250 μm; Green scale bar: 50 μm. (F) 10 million total splenocytes and bone marrow cells from a DM-CLL mouse were engrafted into either immunodeficient (NSG) or immunocompetant (CD45.1) mice 6 weeks after the engraftment. mice were sacrificed and B220+CD5+ in the spleen were detected by flow cytometry. See also Figure S5 and Table S2.
Figure 5.
Figure 5.. Sf3b1 mutation and Atm deletion are associated with increased DNA damage.
(A) The number of alternative splicing events significantly included or excluded in MT groups versus WT are shown. (B) Top Gene Ontology categories significantly enriched for mis-spliced transcripts in different MT versus WT groups are shown. (C) Representative data of γH2AX immunofluoresent staining in splenic B cells obtained from WT and different MT mice. Scale bars, 5 μm. (D) γH2AX signal intensities in WT and different MT mice. 70–91 cells were measured for each group. Center lines show the medians, box limits indicate the 25th and 75th percentiles and whiskers extend to minimum and maximum values. (E) Chromosomal copy number variants are detected using whole-genome sequencing. The copy number ratio to WT mice are shown. Red arrows indicate chromosome amplification and deletions. (F) Heatmap showing the normalized gene expression of 146 human genes (homologs of mouse Chr 15 and 17 genes) significantly upregulated (p<0.05) in 11 human CLL with SF3B1 mutations versus 8 normal B cells. Genes involved in MAPK/ERK signaling are labeled red. See also Figure S6 and Tables S3–S5.
Figure 6.
Figure 6.. Integrative transcriptome and proteomics analyses of CLL cells.
(A) Correlations in mRNA and protein levels between different MT and WT cells are shown. Expression values were log transformed. Abundance of mRNA was measured by TPM (Transcripts Per Kilobase Million) and protein abundance was measured by Tandem mass tag (TMT) signal intensity. (B) Correlation between changes in mRNA expression and changes in protein expression between DM-CLL and DM are shown. DM-CLL/DM fold changes were log transformed, with positive values indicating upregulation and negative values indicating downregulation in DM-CLL versus DM. (C) GSEA analysis of KEGG pathways enriched for differentially expressed genes/proteins between DM-CLL and DM. KEGG pathways were plotted by the log transformed enrichment p values, with upregulated or downregulated pathways indicated by positive or negative values, respectively. GSEA enrichment plot for BCR signaling genes is shown. (D) A schematic shows a simplified overview of the BCR signaling pathway. (E) Western blot of BCR signaling components in non-CLL or CLL cells either untreated or treated with 20 μg/ml α-IgM for 5 min. (F) Quantification of the western blot results. Abundances of p-SYK and p-AKT upon α-IgM stimuli, as well as of p-ERK1/2 and total AKT without α-IgM stimuli, are shown. Data represent Mean±SD of three independent experiments. See also Figure S6.
Figure 7.
Figure 7.. Distinct patterns of BCR signaling in CLL cells with SF3B1 mutation.
(A and B) Heatmap of the expression of BCR signaling pathway genes in DFCI/Broad cohort (n=115) (A) and ICGC cohort (n=275) (B). Samples were ranked by BCR scores, which indicate the mean TPM of 74 BCR signaling genes within individual samples. (C) Statistics of the BCR scores in different groups are shown. Center lines indicate the means; box limits indicate the 25th and 75th percentiles; whiskers extend to minimum and maximum values. (D) Correlation between changes in the expression of BCR signaling pathway genes in the two CLL patient cohorts. Positive log-transformed p values indicate upregulation and negative values indicate downregulation in SF3B1 MT compared to WT CLLs. (E) 6 SF3B1 MT and 10 WT human CLLs treated with different doses of ibrutinib for 48 hr in vitro, and the relative cell viability compared to the DMSO control group were calculated. The mean percentage viability of all SF3B1 WT or MT CLL samples upon ibrutinib treatment is shown. (F) Changes in absolute lymphocyte count (ALC) overtime in 36 cases and 9 cases with WT and MT SF3B1, respectively, CLL treated with ibrutinib. ALC was measured by 2, 14 days and 1, 2, 3, 4, 5, 6 and 12 months on ibrutinib and was presented as percentage of the peak ALC for individual cases (thin red lines, MT CLLs; thin blue lines, WT CLLs). Red line - Median values of all MT CLLs; blue line – median value of all WT CLLs. (G) The percentage of cases reaching peak circulating ALC at each time point. All cases reached their peak by 60 days; p value was calculated using the Kruskal-Wallis test. See also Figure S7 and Table S7

References

    1. Aird KM, Worth AJ, Snyder NW, Lee JV, Sivanand S, Liu Q, Blair IA, Wellen KE, and Zhang R (2015). ATM couples replication stress and metabolic reprogramming during cellular senescence. Cell reports 11, 893–901. - PMC - PubMed
    1. Alfarano A, Indraccolo S, Circosta P, Minuzzo S, Vallario A, Zamarchi R, Fregonese A, Calderazzo F, Faldella A, Aragno M, et al. (1999). An alternatively spliced form of CD79b gene may account for altered B-cell receptor expression in B-chronic lymphocytic leukemia. Blood 93, 2327–2335. - PubMed
    1. Alsafadi S, Houy A, Battistella A, Popova T, Wassef M, Henry E, Tirode F, Constantinou A, Piperno-Neumann S, Roman-Roman S, et al. (2016). Cancer-associated SF3B1 mutations affect alternative splicing by promoting alternative branchpoint usage. Nature communications 7, 10615. - PMC - PubMed
    1. Bartkova J, Rezaei N, Liontos M, Karakaidos P, Kletsas D, Issaeva N, Vassiliou LV, Kolettas E, Niforou K, Zoumpourlis VC, et al. (2006). Oncogene-induced senescence is part of the tumorigenesis barrier imposed by DNA damage checkpoints. Nature 444, 633–637. - PubMed
    1. Berger MF, Lawrence MS, Demichelis F, Drier Y, Cibulskis K, Sivachenko AY, Sboner A, Esgueva R, Pflueger D, Sougnez C, et al. (2011). The genomic complexity of primary human prostate cancer. Nature 470, 214–220. - PMC - PubMed

Publication types

MeSH terms