. 2019 Feb 7;176(4):844-855.e15.
doi: 10.1016/j.cell.2019.01.007. Epub 2019 Jan 31.

Optimal Decoding of Cellular Identities in a Genetic Network

Affiliations

Optimal Decoding of Cellular Identities in a Genetic Network

Mariela D Petkova et al. Cell. .

Abstract

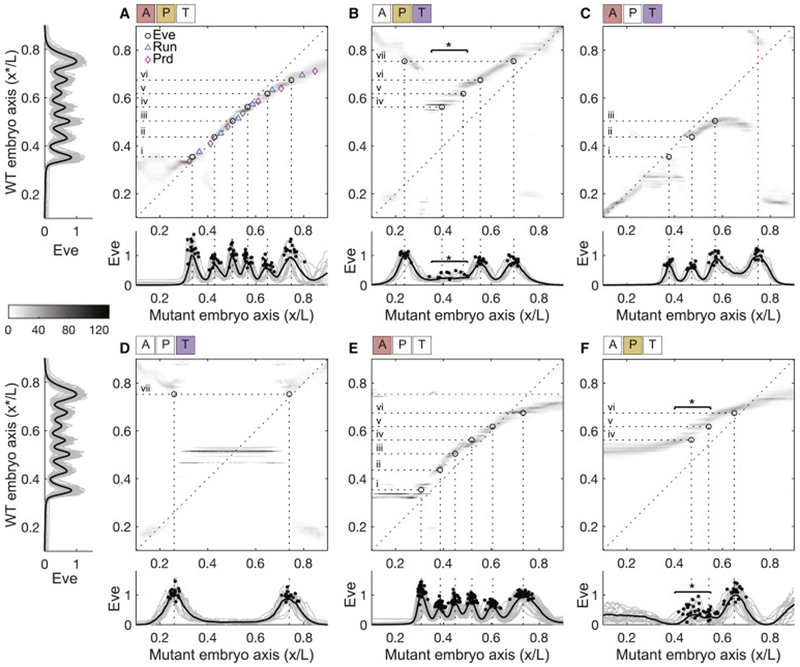
In developing organisms, spatially prescribed cell identities are thought to be determined by the expression levels of multiple genes. Quantitative tests of this idea, however, require a theoretical framework capable of exposing the rules and precision of cell specification over developmental time. We use the gap gene network in the early fly embryo as an example to show how expression levels of the four gap genes can be jointly decoded into an optimal specification of position with 1% accuracy. The decoder correctly predicts, with no free parameters, the dynamics of pair-rule expression patterns at different developmental time points and in various mutant backgrounds. Precise cellular identities are thus available at the earliest stages of development, contrasting the prevailing view of positional information being slowly refined across successive layers of the patterning network. Our results suggest that developmental enhancers closely approximate a mathematically optimal decoding strategy.

Keywords: Drosophila; cell fate; cell specification; developmental precision; embryonic patterning; genetic networks; optimality; quantitative imaging.


Conflict of interest statement

Declaration of interests

The authors declare no competing interests.

Figures

Figure 1:
Figure 1:. Decoding in a genetic network.
(A) In the early Drosophila embryo, maternally provided morphogens (bcd, nos, tor) regulate the expression of gap genes (kni, kr, gt, hb), which is visualized here in a mid-sagittal slice through an embryo during n.c. 14 (scale bars, 100 μm). Enhancers (schematically depicted as circles) respond to combinations of gap protein concentrations to drive pair-rule gene expression that occurs in a precise and reproducible striped pattern (Gregor et al., 2014). (B) Schematic depiction of the decoding problem. Positional information is supplied by three morphogens primarily acting in the anterior A, posterior P, or terminal T domains. The network can be viewed as an input/output device that encodes physical location x in the embryo using concentrations {g1, g2, g3, g4} of the gap gene proteins. Optimal decoding is a well-posed mathematical problem, whose solution is found in the posterior distribution P(x*∣{gi}) (Equation 3); results can be visualized as a decoding map, P(x*∣x) (Equation 4 and Figure 2). The posterior distribution is constructed from measurements (average gap gene expressions, {gi(x)} and their covariability, Cij(x), and contains no arbitrary parameters. (C) Testable predictions from optimal decoding. Pair-rule stripes are expected wherever decoding a combination of concentrations yields an implied position, X*, associated with a pair-rule stripe, Xstr, in WT.
Figure 2:
Figure 2:. Coding and decoding of position in fly embryos.
(A) Optical section through the midsagittal plane of a Drosophila embryo with immunofluorescence labelling for Krüppel (Kr) protein (scale bar, 100μm). Raw dorsal fluorescence intensity profile of depicted embryo (blue curve, (x)) and encoding probability distribution P(Krx) (gray) constructed from 38 WT embryos of ages between 40–44 min into n.c. 14. Position x along the AP axis is normalized by embryo length L, with x/L = 0 (1) for the anterior (posterior) poles. Probability distribution of Kr expression levels (left). (B) Decoding probability distribution P(xKr) constructed via Bayes’ rule from the measured probability distributions P(g) and P(gx) in (A), using a uniform prior PX(x) = 1/L. P(xKr) is input for the optimal decoder, which maps Kr levels to positions along the AP axis. Posterior probability distributions of locations x consistent with observing Kr levels 0.05, 0.5, or 1 are the conditional probability densities P(xKr) shown in top panels. (C) Decoding map Pgα(xx) for a single embryo α. Top cartoons display regions of inferred positions based on Kr alone. Dynamic range (gray bar, right) applies to all three probability panels. See also Figure S1.
Figure 3:
Figure 3:. Decoding with increasing number of gap genes in WT embryos.
Top row: dorsal fluorescence intensity profile(s) from simultaneously stained embryos (mean ± SD); units scaled so that 0 (1) corresponds to minimum (maximum) mean expression. Bottom row: decoding maps, P(x*∣x) from Equation (4), averaged over 38 embryos. (A) Decoding using single gene (Kr, blue) (also Figures 2 and S1C). (B) Decoding using a combination of two genes, Kr (blue) and Hb (red) (also Figure S1D). (C) Decoding using three genes, Kr (blue), Hb (red), and Gt (orange) (also Figure S1E). (D) Decoding using all four gap genes. See also Figure S1.
Figure 4:
Figure 4:. Decoding maps and stripe locations in mutant embryos.
Average decoding maps for six maternal mutant backgrounds (whitened APT symbols above the panels signify whether the anterior A, posterior P, or terminal T systems are deficient): (A) etsl4; (B) bcdE1; (C) osk166; (D) bcdE2 osk166; (E) Bcd-only germline clone; (F) bcdE etsl1; same gray-scale as in Figure 3D. Measured Eve expression profiles in WT embryos (left side of A and D), and in mutant embryos (below each corresponding decoding map); individual profiles (gray), mean profile (black), and peak locations (black dots), units scaled so that 0 (1) corresponds to minimum (maximum) mean Eve expression within each genotype. Average locations of WT Eve stripes (horizontal dotted lines) are used to predict Eve stripes in the mutant backgrounds: stripes expected at AP locations in mutant embryos where horizontal dotted lines intersect peak(s) of the probability density. Open black circles mark intersections of horizontal dotted lines and respective average locations of Eve stripes in mutant embryos (vertical dotted lines). Variable number of Eve stripes highlighted by horizontal starred bars (see B and F; see Figure S6). Red line in C marks observed Eve stripe that is not predicted by the decoding map. Red line in E shows a predicted Eve stripe that is not observed in the mutant embryo. When horizontal lines intersect a broad probability distribution, we expect to observe diffuse Eve stripes as in F. A shows additional predictions for Run (cyan) and Prd (magenta) stripes; the dense collection of markers traces the ridge of implied positions in the decoding map with very high accuracy. See also Figures S2, S3, and S4 and Movie M1.
Figure 5:
Figure 5:. Predicted vs observed locations of 70 pair-rule stripes in mutant embryos.
Horizontal axis: measured pair-rule stripe positions in mutant embryos (mean ± SD across embryos of a given genotype). Vertical axis: predictions from decoding the gap gene expression levels in mutant embryos (mean ± SD across embryos of a given genotype). Color scale indicates the displacement of the observed peak from its WT location (Δx/L). 11 diffuse stripes are analyzed separately (Figure S5). In addition, we observe, but do not predict 3 stripes; and predict, but do not observe 3 stripes. See also Figures S5 and S6.
Figure 6:
Figure 6:. Decoding maps from dynamic gap gene expression patterns.
(A–C) A single decoder built from gap gene expression at 40–44 min into n.c. 14 is used to decode gap gene expression patterns in embryos from 15 ±2, 30 ± 2, and 50 ± 2 min into n.c. 14, respectively. Grayscale as Figure 2D. Top panels show the mean gap gene expression ± s.d. (shading) across embryos in each decoded time window. Bottom panels show mean (black line) and individual (gray lines) profiles of Eve patterns 8 min later (delay accounts for time to synthesize Eve proteins (Edgar et al., 1986). Dots in main decoding panels mark intersections of average Eve peak locations in time window 45–55 min n.c. 14, with the average locations of Eve peaks in the corresponding time window for each panel. Light grey open circles in C correspond to locations of Eve peaks in B, to illustrate shift. Note that Eve stripe vii shifts by ~ 0.06L during the 20 min separating the two time windows. (D) Measured (black dashed line) and predicted (blue dashed line) mean locations of Eve peaks throughout n.c. 14 marked at 5 min intervals (triangles), horizontal lines mark three time windows in A–C. (E) Predicted vs measured Eve stripe locations throughout n.c. 14. Time (min) depicted in blue scale bar. See also Movies M1 and M2.

References

    1. Albert R, and Othmer HG (2003). The topology of the regulatory interactions predicts the expression pattern of the segment polarity genes in Drosophila melanogaster. J. Theor. Biol - PMC - PubMed
    1. Alberts B, Johnson A, Lewis J, Raff M, Roberts K, P.W. (2002). Molecular Biology of the Cell In Molecular Biology of the Cell, (New York: Garland Science; ), p. chapter 22.
    1. Bialek W (2012). Biophysics: Searching for principles (Princeton University Press, Princeton NJ: ).
    1. Briscoe J, and Small S (2015). Morphogen rules: design principles of gradient-mediated embryo patterning. Development 142, 3996–4009. - PMC - PubMed
    1. Carroll SB (1990). Zebra patterns in fly embryos: Activation of stripes or repression of interstripes? Cell 60, 9–16. - PubMed

Publication types

MeSH terms