. 2019 Feb 7;176(4):928-943.e22.
doi: 10.1016/j.cell.2019.01.006. Epub 2019 Jan 31.

Optimal-Transport Analysis of Single-Cell Gene Expression Identifies Developmental Trajectories in Reprogramming

Affiliations

Optimal-Transport Analysis of Single-Cell Gene Expression Identifies Developmental Trajectories in Reprogramming

Geoffrey Schiebinger et al. Cell. .

Erratum in

Abstract

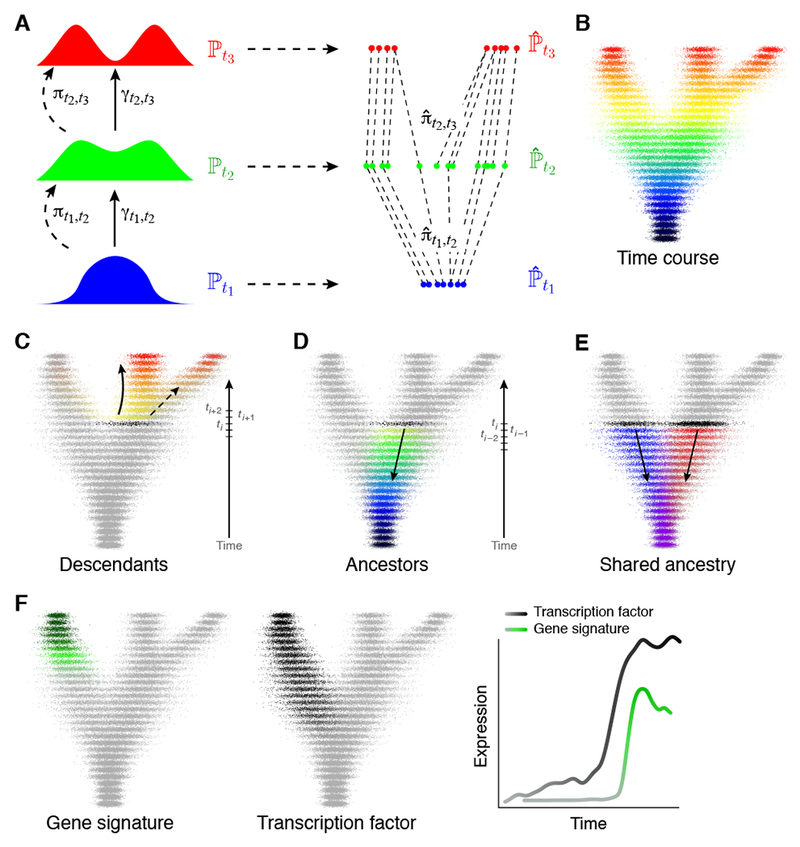
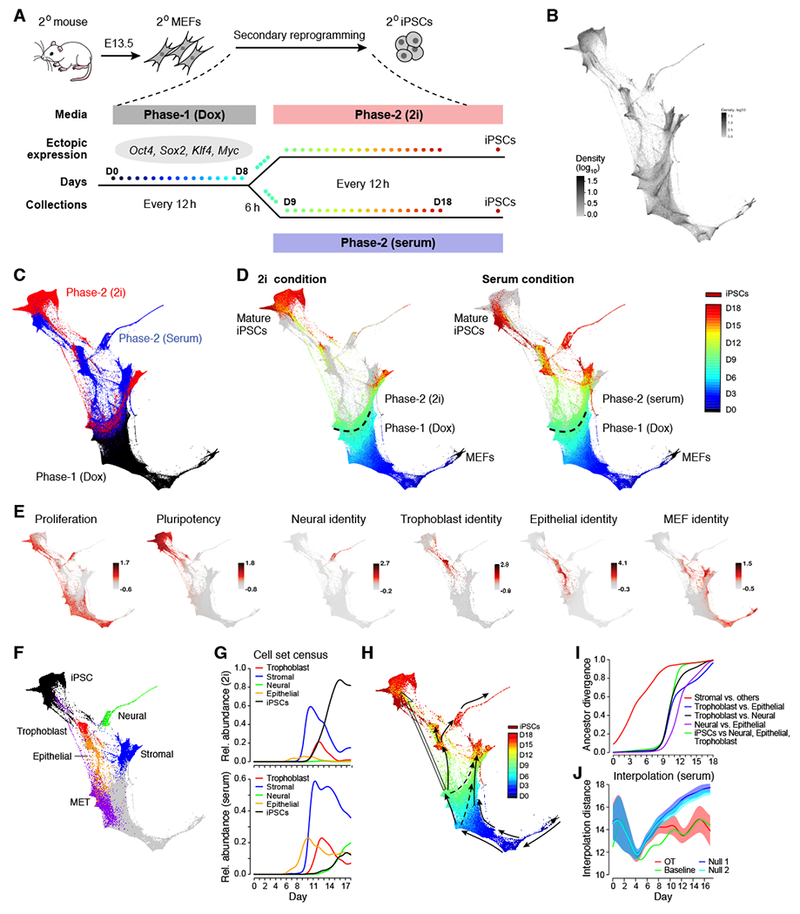
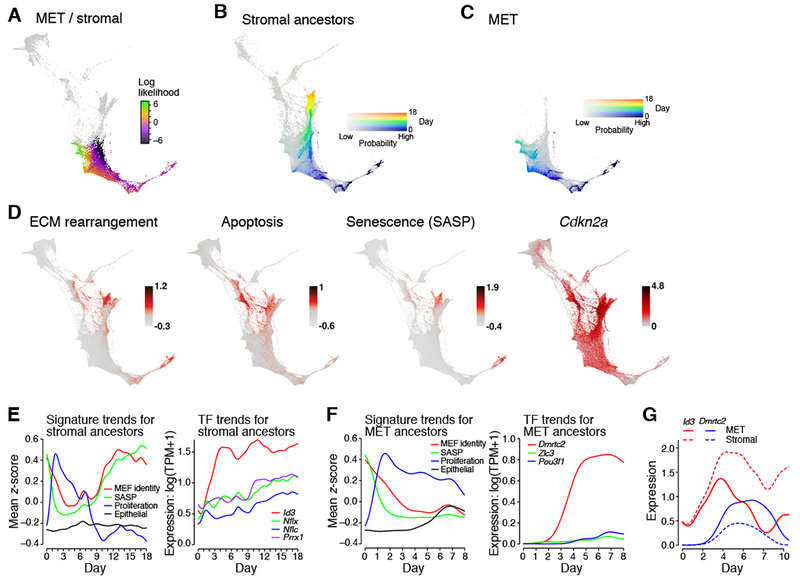
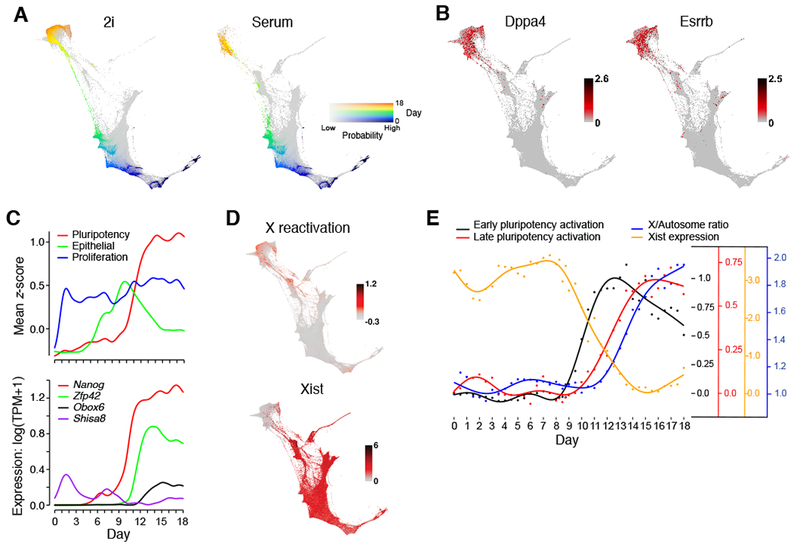
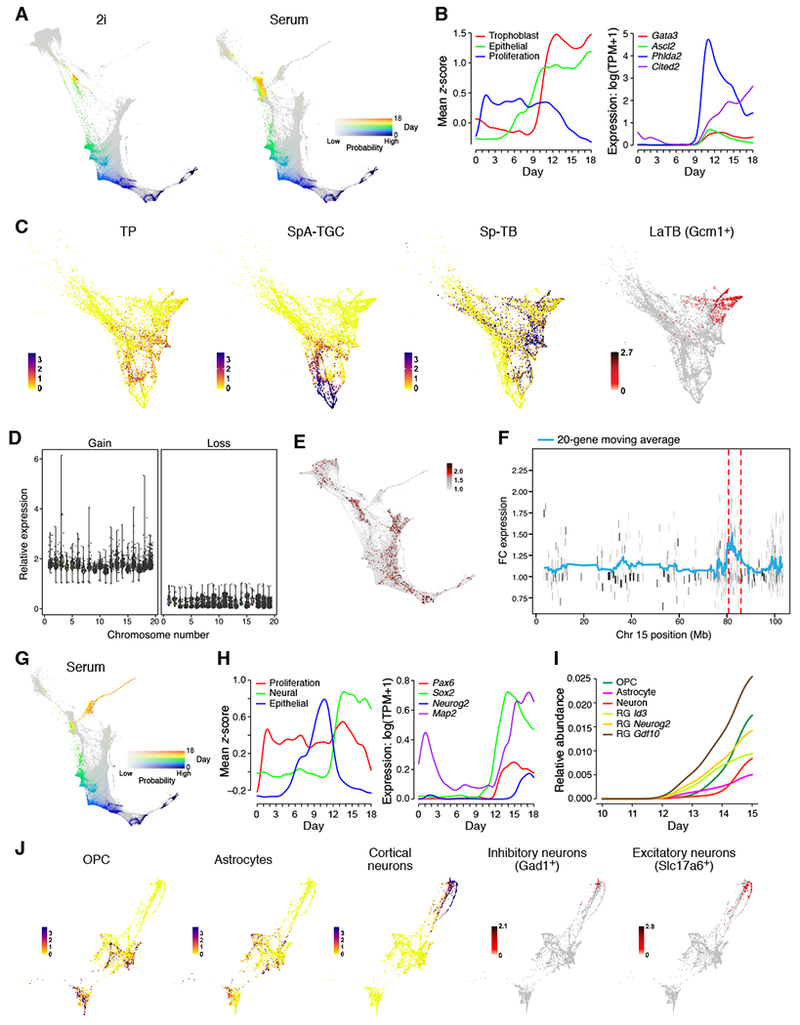
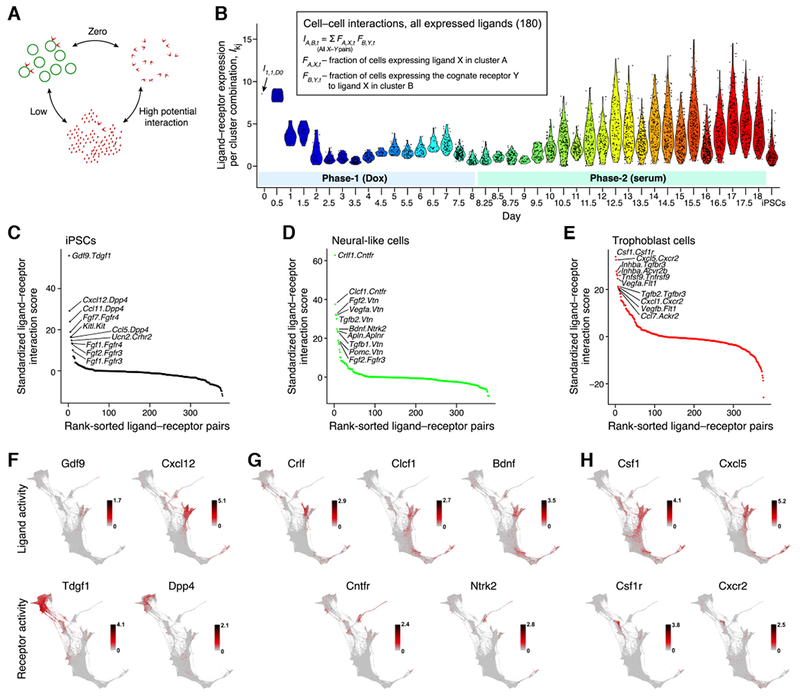
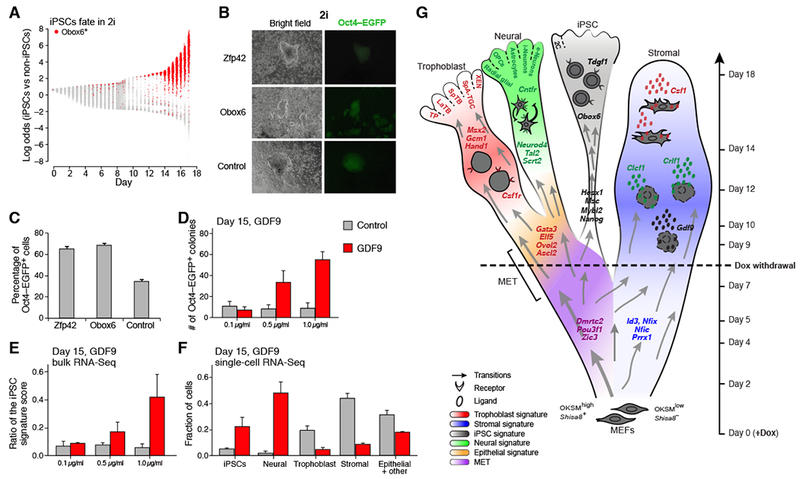
Understanding the molecular programs that guide differentiation during development is a major challenge. Here, we introduce Waddington-OT, an approach for studying developmental time courses to infer ancestor-descendant fates and model the regulatory programs that underlie them. We apply the method to reconstruct the landscape of reprogramming from 315,000 single-cell RNA sequencing (scRNA-seq) profiles, collected at half-day intervals across 18 days. The results reveal a wider range of developmental programs than previously characterized. Cells gradually adopt either a terminal stromal state or a mesenchymal-to-epithelial transition state. The latter gives rise to populations related to pluripotent, extra-embryonic, and neural cells, with each harboring multiple finer subpopulations. The analysis predicts transcription factors and paracrine signals that affect fates and experiments validate that the TF Obox6 and the cytokine GDF9 enhance reprogramming efficiency. Our approach sheds light on the process and outcome of reprogramming and provides a framework applicable to diverse temporal processes in biology.

Keywords: ancestors; descendants; development; iPSCs; optimal-transport; paracrine interactions; regulation; reprogramming; scRNA-seq; trajectories.


Conflict of interest statement

Declaration of Interests:

GS, JS, MT, BC, AR, EL and PR are named inventors on International Patent Application No PCT/US2018/051808 relating to work of this manuscript.

AR is a founder of Celsius Therapeutics and a member of the SAB of Syros Pharmaceuticals, Driver Group and ThermoFisher Scientific.

ESL serves on the Board of Directors for Codiak BioSciences and Neon Therapeutics, and serves on the Scientific Advisory Board of F-Prime Capital Partners and Third Rock Ventures; he also serves on the Board of Directors of the Innocence Project, Count Me In, and Biden Cancer Initiative, and the Board of Trustees for the Parker Institute for Cancer Immunotherapy.

Figures

Figure 1
Figure 1. Modeling developmental processes with optimal transport.
(A) A temporal progression of a time-varying distribution ℙt (left) can be sampled to obtain finite empirical distributions of cells ^ti. at various time points t1, t2, t3 (right). Over short time scales, the unknown true coupling, γt1,t2, is assumed to be close to the optimal transport coupling, πt1,t2, which can be approximated by π^t1,t2 computed from the empirical distributions ^t1 and ^t2. (B) Single-cell profiles (individual dots) are colored by the time of collection. (C) Descendants of a cell set (black) at later times. (D) Ancestors at earlier times. (E) Shared ancestry of two cell sets (black). Ancestors of each population shown in red and blue, shared ancestors in purple. (F) Expression of gene signatures (left; green, high expression; grey, low expression) can be predicted from earlier expression of transcription factors (middle; black, high expression; grey, low expression) in a gene regulatory model by analyzing trends along ancestor trajectories (right).
Figure 2.
Figure 2.. A single cell RNA-Seq time course of iPSC reprogramming.
(A) Reprogramming of secondary (2°) MEFs from E13.5 embryos. Each dot represents a collection time-point. (B-F) FLE visualization of scRNA-seq profiles (individual dots). (B) Intensity indicates density of cells in the 2D FLE. (C) Cells colored by condition, with Phase-1 (dox) in black and Phase 2 in blue (serum) and red (2i). (D) Cells colored by time point, with Phase-2 points from only either 2i condition (left) or serum condition (right). Grey points represent Phase-2 cells from the other condition. (E) Patterns of gene signature scores on the FLE. (F) Cell set membership. (G) Relative abundance (y-axis) of each cell set (colored lines) plotted over time in 2i (top) and serum (bottom). (H) Schematic representation of trajectories. (I) Ancestor divergence for pairs of trajectories. Divergence (y-axis) is quantified as 0.5 times the total variation distance between ancestor distributions. (J) Quality of interpolation in serum for OT (red), null models with growth (blue) and without growth (teal). Shaded regions indicate 1 standard deviation. Note that OT is almost as accurate as the batch-to-batch baseline (green). See also Figure S1, S7, Table S1, S2, S6 and Movie S1.
Figure 3.
Figure 3.. In initial stages of reprogramming, cells progress toward stromal or MET fates
(A) The log-likelihood of obtaining stromal vs. MET fate shows a gradual emergence of fates from day 0 through 8. (B) Ancestors of day 18 stromal cells in serum. Color shows day, intensity shows probability. (C) Ancestors of day 8 MET cells have a distinct trajectory. (D) Activity of gene signatures and individual gene expression (log(TPM+1)) that are associated with stromal activity and senescence. (E) and (F) Gene signature trends along indicated trajectories. (G) TF expression trends along stromal and MET trajectories. See also Figure S2 and Table S2, S3.
Figure 4
Figure 4. iPSCs emerge from cells in the MET Region
(A) Ancestor trajectory of day 18 iPSCs in 2i (left) and serum (right) (color shows day, intensity shows probability). (B) Expression (log(TPM+1)) of pluripotency marker genes. (C) Expression trends along ancestor trajectory in serum for gene signatures (top) and TFs (bottom). (D) X-reactivation signature (mean z-score) and Xist expression (log(TPM + 1)) on the FLE. (E) Trends in X-inactivation, X-reactivation and pluripotency (Table S4) along the iPSC trajectory in 2i. Each curve has a different y-axis, indicated by color. See also Figure S3 and Table S2, S4.
Figure 5
Figure 5. Extra-embryonic and neural-like cells emerge during reprogramming
(A) Ancestor trajectory of day 18 trophoblasts in 2i (left) and serum (right) (color shows day, intensity shows probability). (B) Expression trends along trophoblast trajectory in serum for gene signatures (left) and individual TFs (right). (C) An embedding of trophoblasts, colored by signature scores (−log10( FDR q-value)) of TPs, SpA-TGCs, and SpTBs, or by expression of LaTB marker gene Gcm1 (log(TPM + 1)). (D) Average expression of housekeeping genes on chromosomes in single cells (dots) with evidence of genomic amplification (left) or loss (right), relative to all cells without evidence of aberrations (y-axis). (E) Cells are colored by statistical significance (−log10(q-value)) of sub-chromosomal aberrations. (F) Average expression of genes on chromosome 15 in trophoblast-like cells with evidence of a recurrent sub-chromosomal amplification (y-axis, fold change (FC) in expression relative to other cells). (G) Ancestors of day 18 cells in the neural region. (H) Expression trends along the neural trajectory for gene signatures (left) and individual TFs (right). (I) Abundance of neural subtypes. (J) A Neural FLE colored by significance of signature scores (−log10(FDR q-value)) and expression of markers (log(TPM + 1)). See also Figure S4 and Table S2.
Figure 6
Figure 6. Paracrine signaling
(A) High paracrine signaling interactions occur between groups of cells with high expression of ligand in one group and cognate receptor in the other group. (B) Net paracrine signaling interaction scores in serum. Each dot shows the net score for a pair of cell clusters (Figure S5A). (C-E) Potential ligand-receptor pairs between ancestors of stromal cells and iPSCs (C), neural-like cells (D), and trophoblasts (E). (F-H) Expression level (log(TPM+1)) of ligands (above) and receptors (below) for top interacting pairs between stromal cells and iPSCs (F), neural-like cells (G), and trophoblasts (H). See also Figure S5 and Table S5.
Figure 7
Figure 7. Obox6 and GDF9 enhance reprogramming
(A) Log-likelihood ratio of obtaining iPSC vs non-iPSC fate on each day (x-axis) in 2i. Obox6+ cells in red. (B) Bright field and fluorescence images of iPSC colonies generated in 2i by overexpression of OKSM with either Zfp42 or Obox6 (or negative control). (C) Percentage of Oct4-EGFP+ colonies in 2i on day 16, for one of five experiments (Figure S6D). Error bars show standard deviation of three biological replicates. (D-F) Effect of varying concentration of GDF9 (red) vs control (grey) on (D) Oct4-EGFP+ colonies (error bars show standard deviation); (E) the strength of iPSC signature score in bulk RNA-Seq; and (F) cellular composition assayed by scRNA-seq. (G) Schematic of the reprogramming landscape in serum. Color indicates cell-set membership. Color of TFs indicates which cell set they regulate. Color of cytokine indicates the cell class to which they signal. See also Figure S6.

References

    1. Aigner L, and Bogdahn U (2008). TGF-beta in neural stem cells and in tumors of the central nervous system. Cell and Tissue Research 331, 225–241 - PubMed
    1. Ambrosio L, Gigli N, and Savaré G (2008). Gradient flows in metric spaces and in the space of probability measures. Springer.
    1. Brambrink T, Foreman R, Welstead GG, Lengner CJ, Wernig M, Suh H, Jaenisch R. (2008). Sequential expression of pluripotency markers during direct reprogramming of mouse somatic cells. Cell Stem Cell. 2(2):151–9. - PMC - PubMed
    1. Butler A, Hoffman P, Smibert P, Papalexi E, and Satija R (2018). Integrating single-cell transcriptomic data across different conditions, technologies, and species. Nat Biotec 36, 411. - PMC - PubMed
    1. Cacchiarelli D, Trapnell C, Ziller MJ, Soumillon M, Cesana M, Karnik R, Donaghey J, Smith ZD, Ratanasirintrawoot S, Zhang X, et al. (2015). Integrative Analyses of Human Reprogramming Reveal Dynamic Nature of Induced Pluripotency. Cell 162, 412–424. - PMC - PubMed

Publication types

MeSH terms

Substances