. 2019 Feb 21;176(5):1222-1237.e22.
doi: 10.1016/j.cell.2019.01.004. Epub 2019 Jan 31.

Molecular Classification and Comparative Taxonomics of Foveal and Peripheral Cells in Primate Retina

Affiliations

Molecular Classification and Comparative Taxonomics of Foveal and Peripheral Cells in Primate Retina

Yi-Rong Peng et al. Cell. .

Abstract

High-acuity vision in primates, including humans, is mediated by a small central retinal region called the fovea. As more accessible organisms lack a fovea, its specialized function and its dysfunction in ocular diseases remain poorly understood. We used 165,000 single-cell RNA-seq profiles to generate comprehensive cellular taxonomies of macaque fovea and peripheral retina. More than 80% of >60 cell types match between the two regions but exhibit substantial differences in proportions and gene expression, some of which we relate to functional differences. Comparison of macaque retinal types with those of mice reveals that interneuron types are tightly conserved. In contrast, projection neuron types and programs diverge, despite exhibiting conserved transcription factor codes. Key macaque types are conserved in humans, allowing mapping of cell-type and region-specific expression of >190 genes associated with 7 human retinal diseases. Our work provides a framework for comparative single-cell analysis across tissue regions and species.


Conflict of interest statement

COMPETING INTERESTS

AR is an equity holder in Celsius Therapeutics and an SAB member in Syros Pharmaceuticals and Thermo Fisher Scientific.

Figures
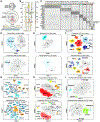
Figure 1:
Figure 1:. Single-cell profiling of peripheral and foveal cells from macaque retina
A. (top) Sketch of a primate eye showing position of fovea and macula. (middle) Central region indicating diameters of the foveola (the foveal pit), fovea, and macula. (bottom) Sketch of a section through macaque fovea, showing foveal pit (red arrow) and displacement of ganglion cell layer (GCL) and inner nuclear layer (INL) cells. B. Sketch of peripheral retina showing its major cell classes – photoreceptors (PR), horizontal cells (HC), bipolar cells (BC), amacrine cells (AC), retinal ganglion cells (RGC) and Muller glia (MG), outer and the inner plexiform (synaptic) layers (OPL, IPL), outer and inner nuclear layers (ONL, INL) and ganglion cell layer (GCL). C. Expression patterns of class specific marker genes (rows) (Table S1) in single foveal cells (columns). Cells are grouped by their class (color bar, top). Plot shows randomly selected 10% of total cells. These signatures were used to separate peripheral cells into classes. D-I. Visualization of foveal (top panel) and peripheral (bottom panel) PRs (D), HCs (E), BCs (F), ACs (G), RGCs (H), non-neuronal cells (I) using tSNE, a 2D non-linear transformation of high-dimensional data, that assigns proximal x-y coordinates to cells (points) with similar expression profiles. Individual cells are colored by their cluster assignments. Cluster labels, corresponding to post hoc assigned types, are indicated. Although substructure is visible in D and I, this reflected batch effects and we were unable to detect subtypes by reanalysis. Because of their low density in the peripheral retina, only three S-cones were observed among the peripheral PRs, but these were not sufficient to form a separate cluster from M/L-cones. Foveal (f) and peripheral (p) AC clusters are divided into GABAergic (Ga) and Glycinergic (Gl) groups, and then numbered from largest to smallest cell number within each group. For RGCs, OFF and ON midget (MGC) and parasol (PGC) ganglion cells are labeled; clusters 5+ numbered from largest to smallest in the fovea (f) and periphery (p), respectively.
Figure 2:
Figure 2:. Matching scRNA-seq clusters to neuronal types of the primate retina
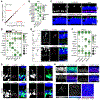
A. Comparison of average transcriptional profiles of foveal M-cones and L-cones. Each dot corresponds to a gene. No genes other than OPN1MW and OPN1LW differ significantly in expression levels (>1.2 fold at p<0.01, MAST test) between the two cone types. B. Dot plot showing expression of genes (rows) that distinguish photoreceptor (PR) types (columns) common to both the fovea and the periphery. The size of each circle is proportional to the percentage of cells expressing the marker (≥1 UMI), and its intensity depicts the average transcript count within expressing cells. C. Validation of S cone specific gene CCDC136 (upper) and M/L cone specific gene THRB (lower) by double and triple FISH with OPN1SW (S-opsin) and OPN1MW/LW (M/L-opsin) in the peripheral retina. Circle highlights an S cone. D. Gene expression patterns of type-enriched markers for selected BC types. Red box highlights a pan-BC, a pan-ON-BC and a pan-OFF-BC marker. See Figure S2G and Table S2 for lists. E. Validation of new markers for two BC types in peripheral retina by FISH combined with immunostaining. (top) DB6 (circle) cells, known to be CD15-positive, also express LHX3. (bottom) DB3a cell (circle) is CALB1+ERBB4+. IPL sublaminae (S1-S5) are demarcated by dashed lines. Sketches redrawn from (Tsukamoto and Omi, 2015, 2016). F. Expression patterns of genes selectively enriched among foveal ON and OFF MGCs and PGCs. G. Validation of markers for MGCs and PGCs from panel F, combining FISH with viral labeling (GFP) to show RGC morphology in the fovea. H. Somata of ON MGCs (TPBG+ and EOMES+) and OFF MGCs/PGCs (MEIS2+) are localized to the inner and outer halves (divided by dashed lines) of the ganglion cell layer, respectively, proximal to the fovea. I. SATB2 positive SBC labeled by GFP-expressing virus in the peripheral retina. Arrowheads indicate the axon (green) and soma. Bottom panels are rotations to show bistratified dendritic lamination. Scale bar is 20 μm. DAPI staining is blue in C, E, G- I.
Figure 3:
Figure 3:. Correspondence between foveal and peripheral clusters
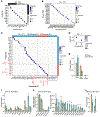
A-D. Transcriptional correspondence between foveal and peripheral clusters, summarized as “confusion matrices.” Circles and colors indicate the percentage of cells of a given foveal cluster (row) assigned to a corresponding peripheral cluster (column) by the classification algorithm trained on peripheral cells. A, BCs; B, RGCs; C, ACs; D, HCs. In panel A, bars on the top and right border mark ON and OFF BC subgroups. In C, bars mark GABAergic and Glycinergic AC subsets; key known types are labeled in red and types that might be periphery-specific are highlighted by blue box in C. Figure S4A provides molecular markers for AC clusters. In panels A-D, the extent of 1:1 cluster matches are quantified by values of the Adjusted Rand Index (ARI), which range from close to 0 (random) to 1 (perfect 1:1 match). Empirical ARI values were highly significant for all classes, as compared to null ARI values (mean ± SD) from random associations. BCs: 10−5±6×10⁻⁴ RGCs: −2×10⁻⁵±6×10⁻⁴ ACs: −8.4×10⁻⁶±3×10⁻⁴, HCs: 3×10⁻⁶±2×10⁻⁴. E-H. Comparison of cell type proportions between the fovea and the periphery (mean±SD, computed across biological replicates). E, PRs; F, BCs; G, RGCs; H, HCs. Foveal type OFFx and DB1 are grouped together as “DB1” due to their transcriptional similarity. To facilitate direct comparison of RGCs, each foveal type is assigned a peripheral identity from B. For ACs, see Figure S4A. Supervised analysis split fRGC11 and fRGC14 into two types each. RGC types underrepresented in the fovea are marked ** in G.
Figure 4:
Figure 4:. Differences in gene expression between foveal and peripheral cell types
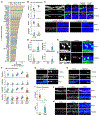
A. Barplot showing the number of DE genes per matched cluster between fovea and periphery (log-fold change >2, p<10−5, MAST test). Bars are labeled based on the corresponding peripheral cluster (except known types), colored by cell class and arranged in decreasing order. Only clusters with ≥50 cells in both the fovea and periphery are shown. B. Box and whisker plots show examples of gene expression differences foveal and peripheral PRs. p-values were calculated using the MAST package. Black horizontal line, median; Bars, interquartile range; vertical lines, minimum and maximum. All differences between fovea and periphery in B,D,F,J are statistically significant with p<1e-19. Stars indicate >2-fold changes based on means. C. In situ validation for B. (upper) Foveal but not peripheral cones express GNGT1. Arrow indicates foveal center. Circles highlight cones; asterisks highlight rods (RHO+). (lower) Peripheral PRs express higher GABRB2 than foveal PRs; neither type expresses GABRA1. D. Same as B, for BCs. E. In situ validation for D. TRPM1 is expressed in peripheral but not foveal DB1. Both are SCGN+. F. Same as B, for RGCs. G., H. In situ validation for F. GABRA1 (G) and GABRB2 (H) expression in foveal and peripheral RGCs (SLC17A6+). I. Same as B, for MGs. J., K. In situ validation for I. CYP26A1 (J) and SPP1 (K) are selectively expressed by foveal and peripheral MGs respectively. APOE is a pan-MG marker. Scale bars, 20 and 300μm as indicated. DAPI staining is blue in C,E,G,J.
Figure 5:
Figure 5:. Conservation of retinal cell types between mouse and macaque
A. Transcriptional correspondence between macaque (rows) and mouse cone types (from Macosko et al., 2015) (columns). Only mouse cones expressing M- or S-opsin but not both were used for this comparison. B. Supervised classification shows that HCs are more closely related to macaque H1 than to H2 cells. C. Transcriptional correspondence between macaque peripheral AC clusters and mouse AC clusters (from Macosko et al., 2015). 1:1 mapping of multiple macaque AC clusters reflects the incomplete resolution of AC types in published mouse data. Known types that map 1:1 are indicated (red). D. Example of orthologous gene expression patterns in matched macaque-mouse AC types E. Transcriptional correspondence between macaque peripheral BC types and mouse BC types (from Shekhar et al., 2016). 9 out of 11 macaque BC types map preferentially to a single mouse type. Crossed red lines highlight correspondence of OFF and ON groups. F. Example of orthologous gene expression patterns in matched macaque-mouse BC types. G. Transcriptional correspondence between macaque peripheral RGC clusters and mouse RGC clusters (from Rheaume et al., 2018). Select mouse and macaque types are indicated. H. Despite poor 1:1 correspondence of RGC types across the two species (G), transcription factors (TFs) that exhibit restricted expression among subgroups are similar, based on high Pearson correlation coefficient (0.89) of their specificity scores (STAR Methods) between macaque and mouse. I. Schematic showing decreasing molecular conservation of types within cell classes from outer to inner retina. For panels A, C, E, G null ARI values (mean ± SD) for a random model are PRs: 1.7×10⁻⁴±9×10⁻³ ACs: 2×10⁻⁵±10−3 BCs: 3×10⁻⁴±9×10⁻⁴ RGCs: 2×10⁻⁶±7×10⁻⁵ Cross-species compositional similarity for BCs and ACs was quantified using the JSD metric. To avoid enrichment biases (Figure S4B), only macaque ACs from CD73− samples were considered.
Figure 6:
Figure 6:. Conservation in marmosets and humans
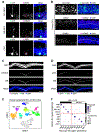
A. Biolistic labeling combined with FISH shows MEIS2+ OFF-MGs (top), EOMES+ ON-MGs (middle), and SPP1+ PGCs (bottom) in the marmoset fovea. B. The exclusive expression of MEIS2 and EOMES in the marmoset foveal GCL layer. C,D. CYP26A1 (C) and SPP1 (D) are selectively expressed by foveal and peripheral Müller glia respectively in marmoset retinas. Arrows indicate the center of the fovea. E. t-SNE visualization of human peripheral BCs. Representation as in Figure 1D-I. Clusters are labeled based on their correspondence to macaque BC types (panel F). F. Transcriptional correspondence between human (rows) and macaque (columns) peripheral BC types. Representation as in Figure 3A. Each human BC cluster is labeled here and in panel E retrospectively based on its most similar macaque BC. Arrows indicate the center of fovea. Scale bars, 20μm and 300 μm as indicated. DAPI staining is blue in A-D.
Figure 7:
Figure 7:. Cell-type and region-specific expression patterns of human retinal disease associated genes
A. Aggregated expression of disease-associated genes in foveal and peripheral cell classes. Disease groups are RP – retinitis pigmentosa; CRD – cone-rod dystrophy; CSNB – congenital stationary night blindness; POAG – primary open angle glaucoma; PACG – primary angle closure glaucoma; AMD – age-related macular degeneration, and DME/DR – diabetic macular edema and retinopathy. B. Expression patterns of a subset of retinal-disease associated genes by cell class (columns), as in panel A. The primary disease associated with each gene is indicated on the right. See Figure S7 for full list. C. Expression patterns of specific retinal-disease associated genes (rows) by non-neuronal types in the fovea and the periphery (columns). D. Expression of glaucoma associated genes in RGC types in the fovea and the periphery. E. The POAG susceptible gene, CYP26A1, shows its specific expression in human foveal müller glia. Arrows indicate the center of fovea. Scale bars, 300 μm.

References

    1. Baden T, Berens P, Franke K, Roman Roson M, Bethge M, and Euler T (2016). The functional diversity of retinal ganglion cells in the mouse. Nature 529, 345–350. - PMC - PubMed
    1. Bae JA, Mu S, Kim JS, Turner NL, Tartavull I, Kemnitz N, Jordan CS, Norton AD, Silversmith WM, Prentki R, et al. (2018). Digital Museum of Retinal Ganglion Cells with Dense Anatomy and Physiology. Cell 173, 1293–1306 e1219. - PMC - PubMed
    1. Blanks JC, and Johnson LV (1984). Specific binding of peanut lectin to a class of retinal photoreceptor cells. A species comparison. Invest Ophthalmol Vis Sci 25, 546–557. - PubMed
    1. Bourne RR, Stevens GA, White RA, Smith JL, Flaxman SR, Price H, Jonas JB, Keeffe J, Leasher J, Naidoo K, et al. (2013). Causes of vision loss worldwide, 1990-2010: a systematic analysis. Lancet Glob Health 1, e339–349. - PubMed
    1. Bringmann A, Syrbe S, Gorner K, Kacza J, Francke M, Wiedemann P, and Reichenbach A (2018). The primate fovea: Structure, function and development. Prog Retin Eye Res. - PubMed

Publication types