. 2019 Feb 21;176(5):998-1013.e16.
doi: 10.1016/j.cell.2018.12.040. Epub 2019 Jan 31.

Commensal Microbiota Promote Lung Cancer Development via γδ T Cells

Affiliations

Commensal Microbiota Promote Lung Cancer Development via γδ T Cells

Chengcheng Jin et al. Cell. .

Abstract

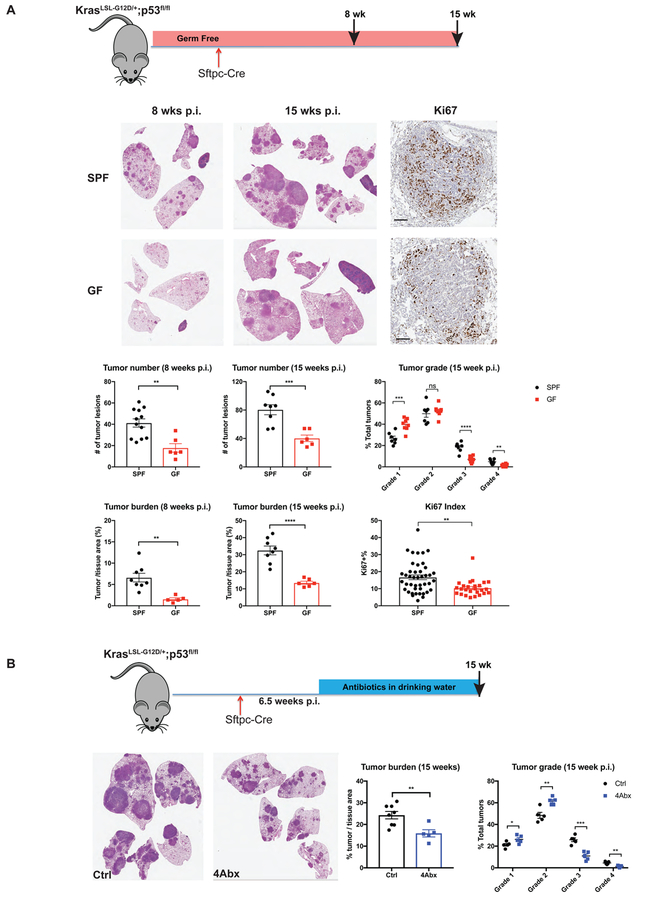
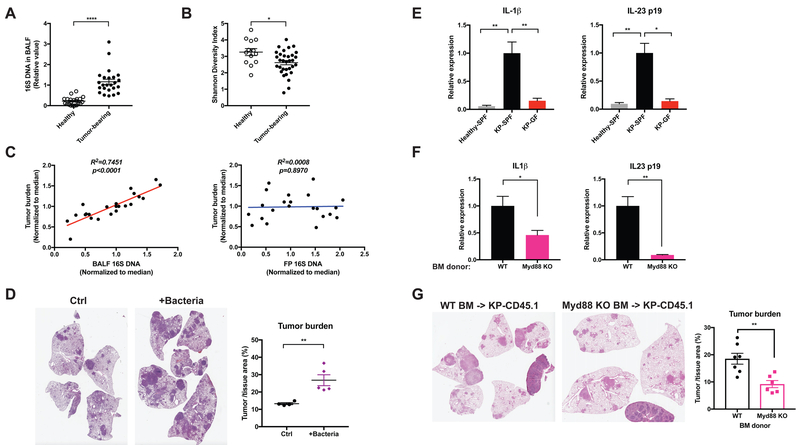
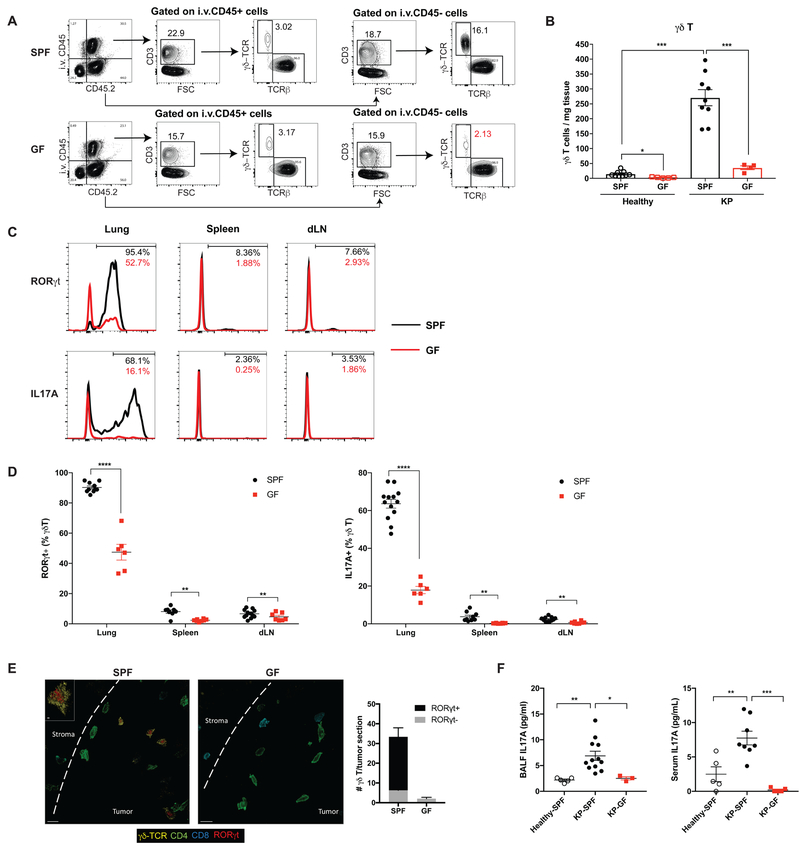
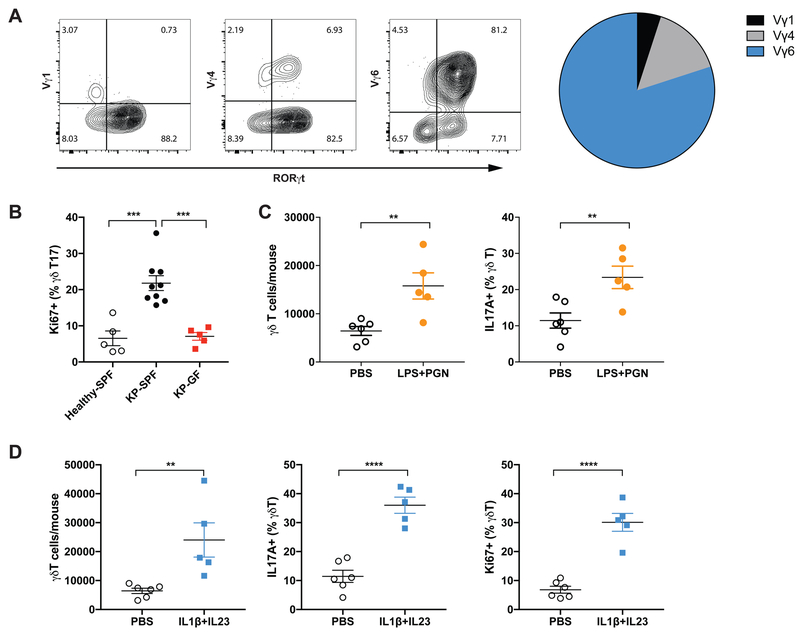
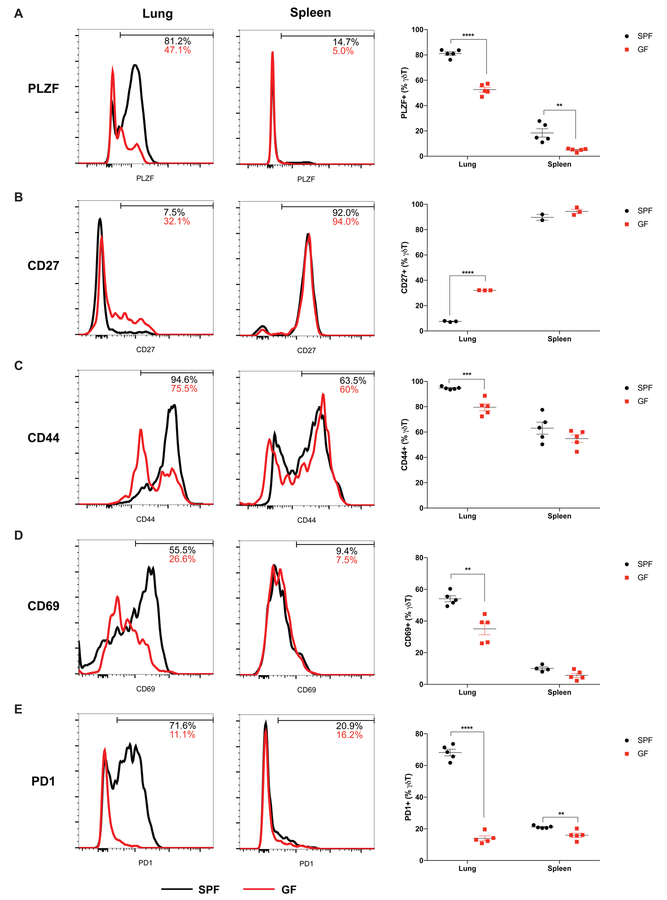
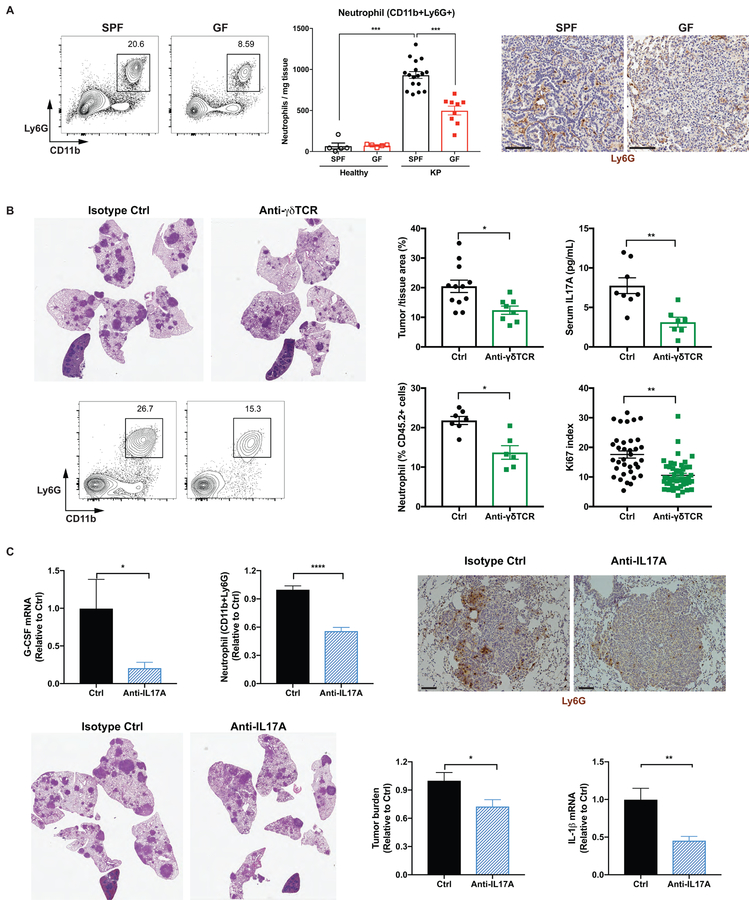
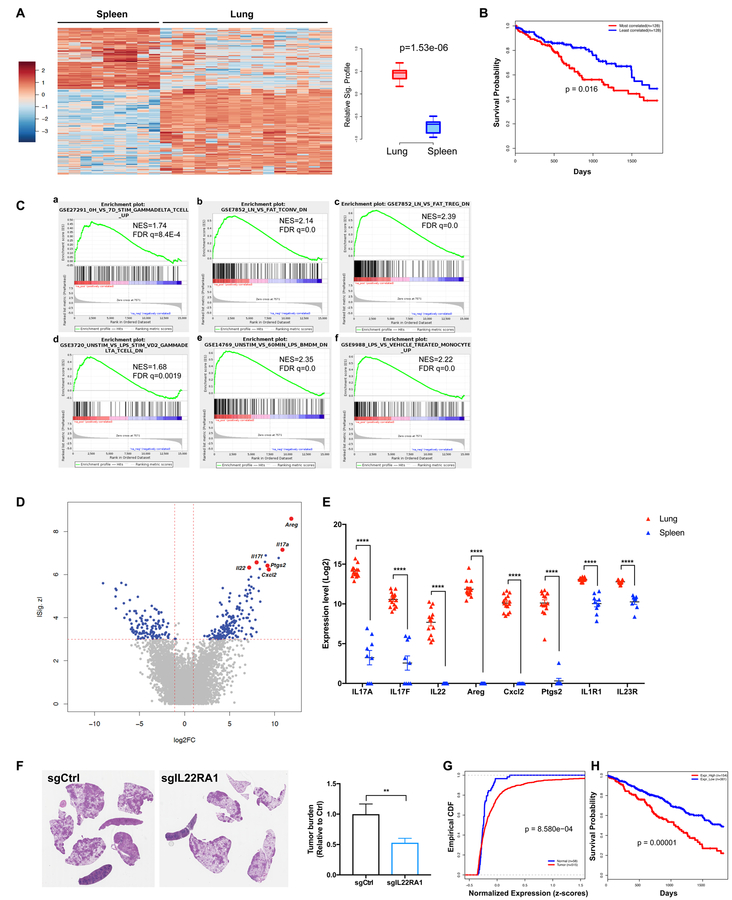
Lung cancer is closely associated with chronic inflammation, but the causes of inflammation and the specific immune mediators have not been fully elucidated. The lung is a mucosal tissue colonized by a diverse bacterial community, and pulmonary infections commonly present in lung cancer patients are linked to clinical outcomes. Here, we provide evidence that local microbiota provoke inflammation associated with lung adenocarcinoma by activating lung-resident γδ T cells. Germ-free or antibiotic-treated mice were significantly protected from lung cancer development induced by Kras mutation and p53 loss. Mechanistically, commensal bacteria stimulated Myd88-dependent IL-1β and IL-23 production from myeloid cells, inducing proliferation and activation of Vγ6+Vδ1+ γδ T cells that produced IL-17 and other effector molecules to promote inflammation and tumor cell proliferation. Our findings clearly link local microbiota-immune crosstalk to lung tumor development and thereby define key cellular and molecular mediators that may serve as effective targets in lung cancer intervention.

Keywords: IL-17; inflammation; lung adenocarcinoma; lung cancer; microbiota; neutrophils; tumor microenvironment; γδ T cells.


Conflict of interest statement

Comprehensive Declaration of Interests

The authors wish to list to following outside interests.

T.J. is a member of the Board of Directors of Amgen and Thermo Fisher Scientific and an equity holder in both companies. He is co-Founder and Scientific Advisory Board member of Dragonfly Therapeutics, a co-founder of T2 Biosystems, and a Scientific Advisory Board member of SQZ Biotech; he is an equity holder in all three companies. His laboratory currently receives funding from the Johnson & Johnson Lung Cancer Initiative and Calico. P.C.B. is a consultant to and equity holder in GALT and 10X Genomics, and a consultant to Insitro. S. M. receives funding from the Johnson & Johnson Lung Cancer Initiative. M.M. is a Scientific Advisory Board member for OrigiMed and receives consulting fees for this role. He was a consultant for Foundation Medicine and held equity, some of which was sold to Roche. He receives research support from Bayer and is an inventor of several joint patents and patent applications, none of which have been licensed at the time of this disclosure (12–17–18). In addition, he is an inventor on several patents on EGFR mutations in lung cancer diagnosis, licensed to LabCorp, for which he receives royalties. He is also an inventor on several patent applications on Fusobacterium, none issued or licensed, and the inventor on a patent for pathogen discovery, not licensed, for none of which he receives royalties.

Figures

Figure 1.
Figure 1.. Commensal microbiota promote development of lung adenocarcinoma.
(A) KrasLSL-G12D; p53fl/fl mice in germ-free (GF) and specific-pathogen-free (SPF) conditions were infected with adenovirus expressing Cre under the control of the alveolar type II cell specific promoter SPC (Sftpc-Cre). Eight or fifteen weeks post infection (p.i.), lung tissues were collected for histopathological analysis to determine the tumor number, tumor burden and tumor grade. Immunohistochemistry staining of Ki67 was performed to examine tumor cell proliferation. Representative H&E pictures and corresponding quantification are shown. For Ki67 index, ~50 tumors from 4–6 mice/group were analyzed. Scale bar = 100 μm. (B) SPF KP mice were treated with combined antibiotics (4Abx) in drinking water starting at 6.5 weeks post tumor initiation. Tumor burden and grade were analyzed at 15 weeks p.i.. Results are expressed as the mean ± SEM. n.s.= not significant, ** p<0.01, *** p<0.001, **** p<0.0001 by Student’s t test. For each experiment, n= 5–12 mice/group; data represent 3 independent experiments. See also Figure S1.
Figure 2.
Figure 2.. Lung tumor development is associated with altered local microbiota and increased pro-inflammatory cytokine expression.
(A, B) BALF samples were collected from tumor-bearing lungs from KP mice or healthy controls. Data were pooled from 5 independent cohorts. (A) Total bacterial burden in BALF determined by 16S rDNA based qPCR analysis. Data were normalized to the corresponding median value of the tumor-bearing samples in each cohort. (B) Shannon diversity index of the bacterial communities present in BALF. (C) Linear regression curves illustrating the correlation between tumor burden and bacterial load in BALF or fecal pellet (FP) samples. Bacterial load in fecal pellets and BALF from untreated and antibiotic-treated SPF KP mice was measured by 16S rDNA-based qPCR; tumor burden was quantified at 15 weeks post tumor initiation. Data were normalized to the corresponding median value of each cohort, and the plots represent pooled data from 3 experimental cohorts. (D) KP mice were infected with a lower dose of Sftpc-Cre adenovirus than the other experiments. 3.5 weeks post tumor initiation, they were left untreated as controls (Ctrl) or intratracheally inoculated with a consortium of bacteria that were isolated and cultured from late-stage lung tumors in a separate cohort of SPF mice (+Bacteria, see Experimental Model and Subject Details). Tumor burden was analyzed 8 weeks following inoculation; representative H&E pictures and quantifications are shown. n= 5 mice/group. (E) RT-qPCR analysis of IL-1β and IL-23 p19 mRNA expression in the lung tissues from healthy SPF mice, tumor-bearing SPF mice and tumor-bearing GF mice. (F) KP mice on the CD45.1 background were lethally irradiated and reconstituted with bone marrow from either wild-type (WT) or Myd88-deficient donors. Expression of IL-1β and IL-23 p19 mRNA were analyzed in FACS-purified alveolar macrophages and neutrophils respectively. Tumor burden was quantified 15 weeks post tumor initiation and representative H&E pictures are shown. Results are expressed as the mean ± SEM. *p<0.05, ** p<0.01, **** p<0.0001 by Student’s t test. For each experiment, n= 6–7 mice/group; data represent 3 independent experiments. See also Figure S2.
Figure 3.
Figure 3.. Microbiota are required for the expansion of γδ T17 cells associated with tumor development.
(A, B) Flow cytometry analysis of γδ T cells in the tumor-bearing lungs from SPF and GF mice. Samples were first gated on total live cells, then gated on the immune cell compartments in the circulation (positive for intravascular CD45 labeling, i.v.CD45+) and in the lung tissue (i.v. CD45−) separately with subsequent gating on CD3+ lymphocytes. The numbers of γδ T cells in the lung tissue (i.v. CD45−) are calculated (A) and representative plots are shown (B). (C, D) RORγt and IL-17A expression in γδ T cells from the tumor-bearing lung, spleen and draining lymph node examined by flow cytometry and compared between SPF mice (black) and GF mice (red). Representative histograms are shown (C) and the frequencies of RORγt+ or IL-17A+ γδ T cells are quantified (D). (E) Confocal immunofluorescent images of tumor-bearing lungs from SPF and GF mice with quantification. Yellow: γδ-TCR; Red: RORγt; Green: CD4; Aqua: CD8; dashed line: tumor border. Scale bar =10 μm. Inset: optical slice of γδ T cells with RORγt expression (z-depth different than larger image), scale bar = 2 μm. (F) IL-17A levels in BALF and serum samples collected from healthy SPF mice, tumor-bearing SPF mice and tumor-bearing GF mice as measured by ELISA. Results are expressed as the mean ± SEM. *p<0.05, ** p<0.01, *** p<0.001, **** p<0.0001 by Student’s t test. For each experiment, n= 6–12 mice/group; data represent at least 4 independent experiments. See also Figure S3.
Figure 4.
Figure 4.. Commensal microbiota induce proliferation and activation of tissue-resident Vγ6+Vδ1+ T cells.
(A) γδ T cells in the tumor-bearing lungs were stained with monoclonal antibodies specific for Vγ1, Vγ4 and Vγ6/Vδ1 TCRs as well as RORγt. Representative FACS plots are shown and the relative percentage of these subsets in total γδ T cells is depicted in the pie chart. Data represent 20 mice. (B) Proliferation of γδ T17 cells in the lungs from healthy SPF mice, tumor-bearing SPF mice and tumor-bearing GF mice was assessed by flow cytometric analysis of Ki67 expression. (C) The number and IL-17 expression of γδ T cells in the lungs analyzed 36 hours post local delivery of LPS and PGN. (D) Recombinant mouse IL-1β and IL-23 were administered to healthy mice through intratracheal instillation. The number of total γδT cells and the frequency IL-17+ or Ki67+ γδT cells were analyzed 36 hours post dosing. (B–D) Results are expressed as the mean ± SEM. *p<0.05, ** p<0.01, *** p<0.001, **** p<0.0001 by Student’s t test. For each experiment, n= 5–9 mice/group. Data represent at least 2 independent experiments. See also Figure S4.
Figure 5.
Figure 5.. Commensal microbiota are important for the differentiation and activation of tumor-associated γδ T cells in the lung.
The expression of PLZF (A), CD27 (B), CD44 (C), CD69 (D), PD1 (E) in γδ T cells in the tumor-bearing lungs and spleens were analyzed and compared between SPF and GF mice. Results are expressed as the mean ± SEM. *p<0.05, ** p<0.01, *** p<0.001, **** p<0.0001 by Student’s t test. n= 2–5 mice/group; data represent 2–3 independent experiments. See also Figure S5.
Figure 6.
Figure 6.. Microbiota-induced γδ T cells promote neutrophil infiltration and tumor development.
(A) The frequency, absolute number and tissue localization of neutrophils in the lungs from SPF and GF mice were examined by flow cytometry and IHC analysis. Scale bar = 100 μm. (B) KP mice were treated with the monoclonal antibody UC7–13D5 to block γδ T cells starting at 4 weeks post tumor initiation. Tumor burden was quantified at 15 weeks p.i. and representative H&E sections are shown. Serum IL-17A levels was determined by ELISA, neutrophil abundance by flow cytometry, and tumor cell proliferation by Ki67 index (50–60 tumors from 5 mice/group), (C) KP mice were treated with a monoclonal antibody to neutralize IL-17A starting at 4 weeks post tumor initiation. Tumor burden was quantified at 13–15 weeks p.i. and representative H&E pictures are shown; neutrophil infiltration was assessed by flow cytometry and IHC analysis (scale bar = 100 μm); G-CSF and IL-1β mRNA expression in the lung tissue were measured by RT-qPCR. Results are expressed as the mean ± SEM. *p<0.05, ** p<0.01, *** p<0.001, **** p<0.0001 by Student’s t test. n= 6–12 mice/group. See also Figure S6.
Figure 7.
Figure 7.. γδ T cells associated with lung tumors exhibit a distinct transcriptional profile.
(A–E) γδ T cells were FACS purified from tumor-bearing lungs or spleens of KP mice and their gene expression was analyzed by RNA-seq. A total of 9 spleen and 15 lung samples from three independent experiments were sequenced. (A) Heatmap showing differential expression of driver genes of the KP-lung versus spleen γδ T signature (|Z| > 3, fold change > 2). Boxplot illustrating the significant difference between standardized signature scores of sample groups. (B) Kaplan-Meier (KM) survival curves comparing subjects in the TCGA LUAD cohort stratified by correlation with the mouse-derived KP-lung γδ T signature. The top 25% most correlated patients (n = 128, red) exhibited significantly decreased survival as compared to the 25% least-correlated patients (n = 128, blue) from the TCGA LUAD cohort (p=0.016, log-rank test). (C) Relevant gene set enrichment plots from GSEA of the KP lung γδ T signature (NES: Normalized Enrichment Score; FDR: False discovery rate). (D) Volcano plot illustrating the magnitude of fold-change (x-axis, lung/spleen log2 fold change) for all genes ranked by their absolute z-score in the KP lung γδ T signature (y-axis). Some of the driver genes highly-upregulated in lung samples are highlighted. (E) Pairwise comparison of the expression levels of 8 relevant genes between KP-lung and spleen samples (**** denotes FDR<1.63E-12). (F) KP-R26LSL-cas9 mice were infected with lentiviral vectors co-expressing Cre and sgRNA against IL-22RA1 or an irrelevant locus (control). Tumor burden was quantified at 10 weeks post tumor initiation and representative H&E pictures are shown. (G) Empirical cumulative distribution function (CDF) plots showing expression of IL22RA1 in human LUAD samples (n=515) in comparison to normal lung tissues (n=58) from the TCGA cohort (p = 8.58E-04, Kolmogorov-Smirnov test). (H) KM survival curves comparing subjects in the TCGA LUAD cohort stratified by IL22RA1 expression. The patients with high IL22RA1 expression (top 30%) exhibit significantly worse survival when compared to the rest of the patients in the cohort (p=0.00001, log-rank test). See also Figure S7.

Comment in

  • Lung Microbiota Promote Lung Cancer.
    [No authors listed] [No authors listed] Cancer Discov. 2019 Apr;9(4):458. doi: 10.1158/2159-8290.CD-NB2019-019. Epub 2019 Feb 14. Cancer Discov. 2019. PMID: 30765334
  • Microbiota and immune cell interplay.
    Dart A. Dart A. Nat Rev Cancer. 2019 Apr;19(4):182. doi: 10.1038/s41568-019-0122-z. Nat Rev Cancer. 2019. PMID: 30783210 No abstract available.
  • Recent Advances in Lung Immunobiology.
    Ramonell RP, Prasla Z, Terry CR, Schulman DA, Lee FE. Ramonell RP, et al. Am J Respir Cell Mol Biol. 2019 Dec;61(6):786-788. doi: 10.1165/rcmb.2019-0183RO. Am J Respir Cell Mol Biol. 2019. PMID: 31291124 Free PMC article. No abstract available.

References

    1. Akinosoglou KS, Karkoulias K, and Marangos M (2013). Infectious complications in patients with lung cancer. Eur Rev Med Pharmacol Sci 17, 8–18. - PubMed
    1. Altschul SF, Madden TL, Schäffer AA, Zhang J, Zhang Z, Miller W, and Lipman DJ (1997). Gapped BLAST and PSI-BLAST: a new generation of protein database search programs. Nucleic acids research 25, 3389–3402. - PMC - PubMed
    1. Anderson KG, Mayer-Barber K, Sung H, Beura L, James BR, Taylor JJ, Qunaj L, Griffith TS, Vezys V, Barber DL, et al. (2014). Intravascular staining for discrimination of vascular and tissue leukocytes. Nat Protoc 9, 209–222. - PMC - PubMed
    1. Bao Z, Lu G, Cui D, Yao Y, Yang G, and Zhou J (2016). IL-17A-producing T cells are associated with the progression of lung adenocarcinoma. Oncol Rep 36, 641–650. - PMC - PubMed
    1. Barbie DA, Tamayo P, Boehm JS, Kim SY, Moody SE, Dunn IF, Schinzel AC, Sandy P, Meylan E, Scholl C, et al. (2009). Systematic RNA interference reveals that oncogenic KRAS-driven cancers require TBK1. Nature 462, 108–112. - PMC - PubMed

Publication types

MeSH terms