. 2019 Mar 20;101(6):1150-1165.e8.
doi: 10.1016/j.neuron.2019.01.009. Epub 2019 Jan 31.

Vasoactive Intestinal Polypeptide-Expressing Interneurons in the Hippocampus Support Goal-Oriented Spatial Learning

Affiliations

Vasoactive Intestinal Polypeptide-Expressing Interneurons in the Hippocampus Support Goal-Oriented Spatial Learning

Gergely Farkas Turi et al. Neuron. .

Abstract

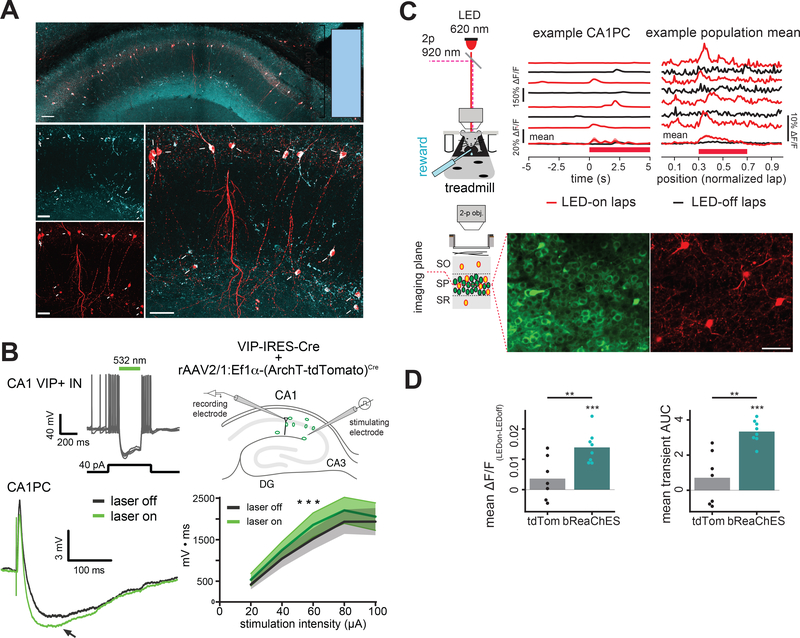
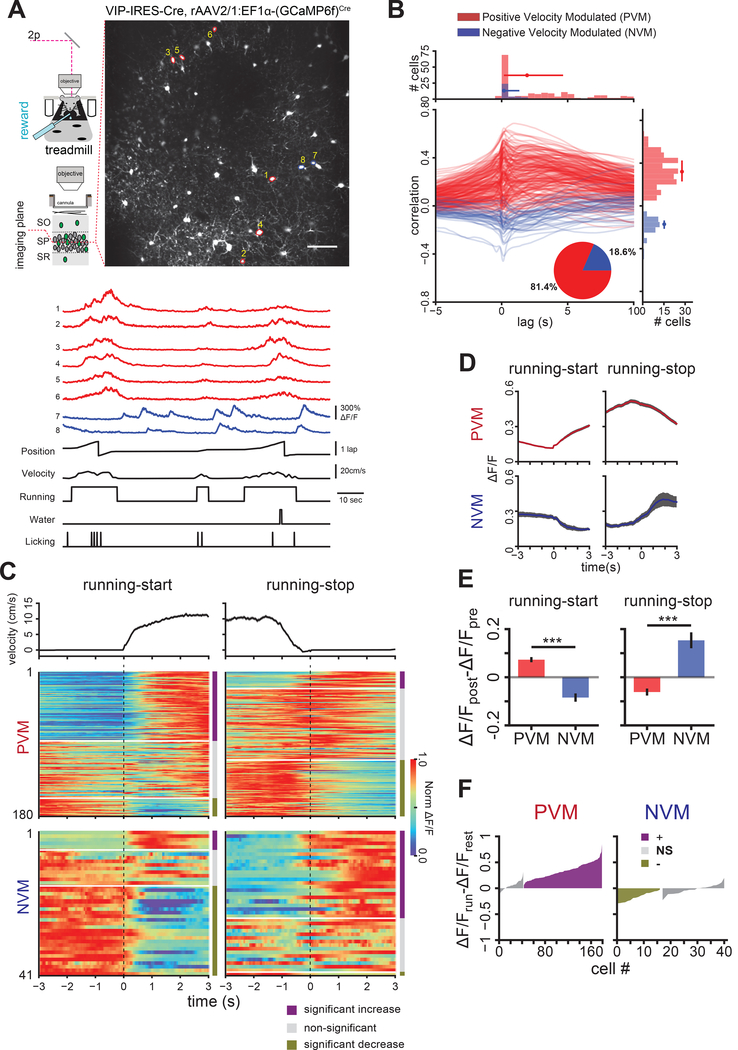
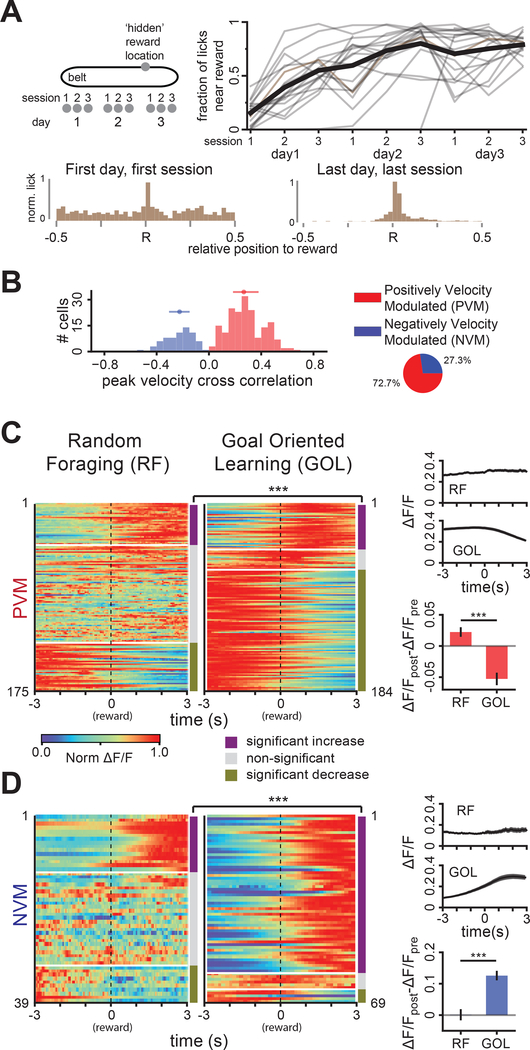
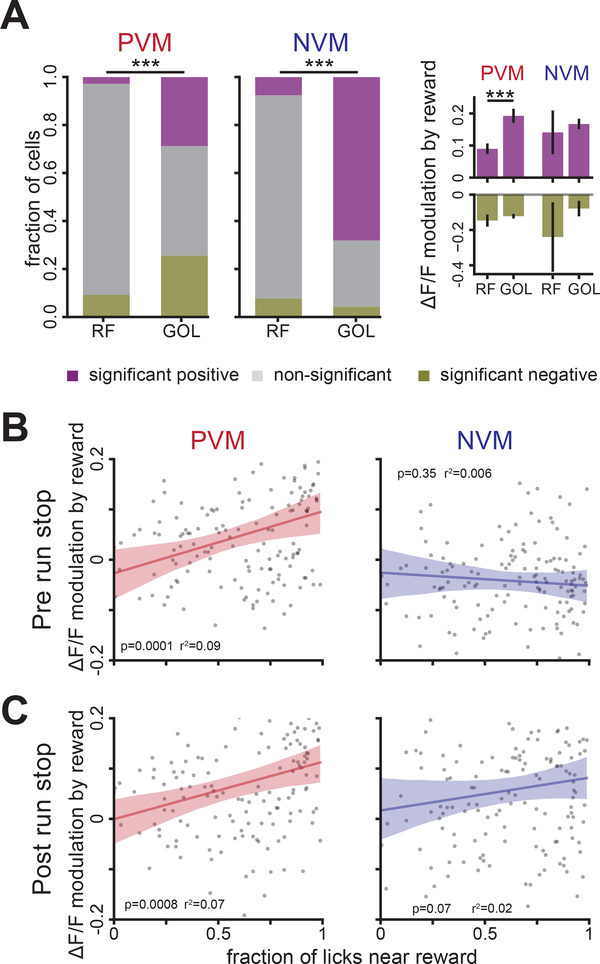
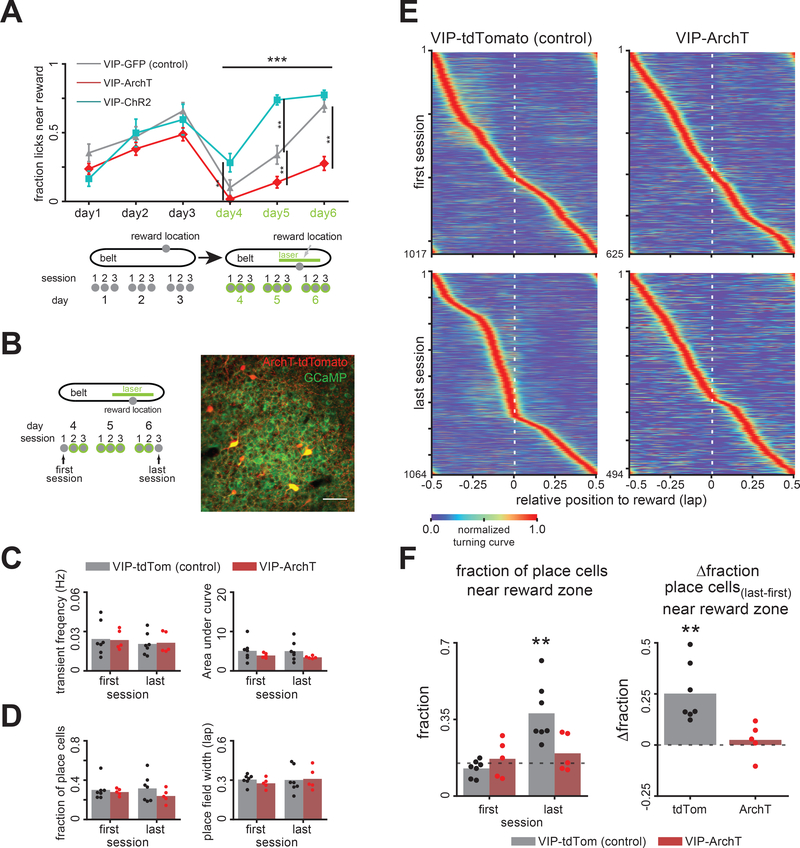
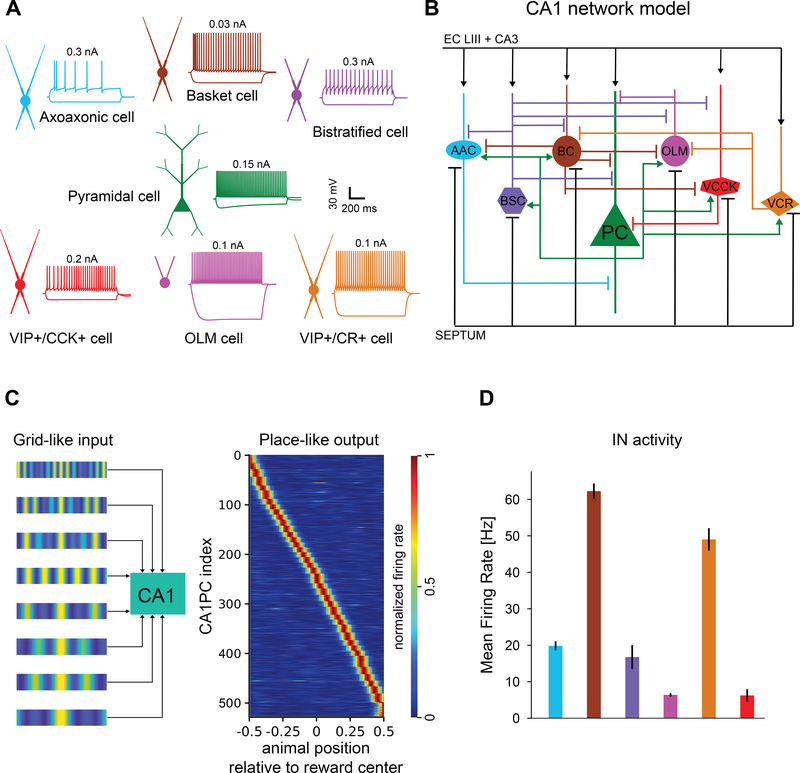
Diverse computations in the neocortex are aided by specialized GABAergic interneurons (INs), which selectively target other INs. However, much less is known about how these canonical disinhibitory circuit motifs contribute to network operations supporting spatial navigation and learning in the hippocampus. Using chronic two-photon calcium imaging in mice performing random foraging or goal-oriented learning tasks, we found that vasoactive intestinal polypeptide-expressing (VIP+), disinhibitory INs in hippocampal area CA1 form functional subpopulations defined by their modulation by behavioral states and task demands. Optogenetic manipulations of VIP+ INs and computational modeling further showed that VIP+ disinhibition is necessary for goal-directed learning and related reorganization of hippocampal pyramidal cell population dynamics. Our results demonstrate that disinhibitory circuits in the hippocampus play an active role in supporting spatial learning. VIDEO ABSTRACT.

Keywords: VIP; disinhibition; hippocampus; inhibition; place cell; reward; spatial learning; two-photon.


Conflict of interest statement

Declaration of Interests

The authors have no competing interests related to this work.

Figures

Figure 1.
Figure 1.
VIP+ interneurons disinhibit pyramidal cells in hippocampal area CA1. A. Immunocytochemical characterization of VIP-IRES-Cre mice. VIP (blue) was detected in 96±1.3% (mean±s.d.) of tdTomato-expressing (red) neurons in CA1 in VIP-IRES-Cre mice crossed with Ai9 reporter mice (4 mice, 613/641 cells, inset). Filled arrows: double-labeled cells; empty arrow (top-left corner): VIP-negative cell in stratum pyramidale (SP). Scale bar=50 μm. SO: stratum oriens; SR: stratum radiatum. B. Optogenetic silencing of VIP+ INs increases inhibitory post-synaptic potentials (IPSPs) in CA1PCs in vitro. Top left: Overlaid current-clamp traces show responses (5 trials) of an ArchT-expressing VIP+ IN to depolarizing somatic current injection (40pA, bottom trace) with an interposed 532 nm laser pulse (green bar). Top right: Experimental setup to assess impact of VIP+ IN activity on CA1PCs. In acute hippocampal slices expressing ArchT in VIP+ INs, CA1PC responses to single-pulse electrical stimulation of CA3 Schaffer collaterals in CA1 SR were recorded in current-clamp with 532 nm light delivered on alternating trials. Bottom left: example traces showing CA1PC response to consecutive trials with laser off (grey) and on (green). Arrow: IPSP following short-duration excitatory postsynaptic potential. Bottom right: Integrated inhibitory responses are larger during photo-inhibition of VIP+ INs (2-way, repeated measures (RM) ANOVA: F(1,15)=23.98, p=0.00019, n=16 cells, interaction: p=0.17). Data are presented as mean±s.e.m. C, D. Optogenetic activation of VIP+ INs increases CA1PC activity in vivo. C. Left: In vivo 2-photon imaging and simultaneous optogenetic stimulation setup. The mouse is head-fixed under a 2-photon microscope and is allowed to run freely on a treadmill. Red-shifted channelrhodopsin variant bReaChES was expressed in CA1 VIP+ INs via rAAV2/1:EF1α-(bReaChES-tdTomato)Cre and activated with an LED (620 nm). CA1PCs were labeled with pan-neuronal GCaMP6f via rAAV2/1:CaMKII-GCaMP6f (Nathanson et al., 2009; Scheyltjens et al., 2015; Schoenenberger et al., 2016). Middle panel: single plane, 2-photon, time-averaged image showing widespread expression of GCaMP6f (green) and bReaChES (red) in neuronal elements including VIP+ INs in CA1 SP (scale bar=50 μm). CA1PC Ca2+ activity was recorded during alternating laps with LED turned on (LED-on) and off (LED-off) then compared for each cell. Upper-middle: example Ca2+ ΔF/F traces from a CA1PC. Black: LED-off laps, red: LED-on laps. Red bar at bottom: LED activation area for LED-on laps, Middle bottom: mean±s.e.m. of ΔF/F traces. Right: example population mean for ΔF/F traces of all CA1PCs in a single field of view (FOV) for individual LED-on and LED-off laps (average of n=107 CA1PCs per FOV). Bottom right: mean±s.e.m. of ΔF/F during LED-on laps and LED-off laps for the FOV for that session. D. Quantification of changes in CA1PC Ca2+ activity between LED-on and LED-off laps. Left: Mice expressing bReaChES in VIP+ INs displayed a greater change in mean ΔF/F in response to photostimulation compared to tdTomato controls (t=3.03, p=0.009, α=0.016). Right: Mice expressing bReaChES in VIP+ INs also showed a greater increase in transient AUC relative to controls (t=4.18, p=0.003, α=0.016). See also Figures S1-S4.
Figure 2.
Figure 2.
VIP+ INs exhibit two distinct response profiles during locomotion. A. Top: example FOV showing GCaMP6f-expressing VIP+ INs in CA1 SP (scale bar: 100 μm). Bottom: example ΔF/F traces from the marked VIP+ INs in FOV above with associated behavior variables (black traces). Ca2+ traces are color coded by the classification in B. B. Cross correlation between VIP+ IN ΔF/F signals and animal’s velocity. Each line is the velocity cross correlation of one cell (221 cells, n=5 mice, 44±16 cells/mouse, mean±s.d.). Right: distribution of peak correlation values. Cells were separated into two groups based on this distribution: Positive Velocity Modulated (PVM, red, 180/221 cells, 36±12 cells/mouse, mean±s.d.) and Negative Velocity Modulated (NVM, blue, 41 cells, 8±5 cells/mouse, mean±s.d.). Circle and vertical bar: median and interquartile range, respectively (PVM: 0.32 (0.23 to 0.42), NVM: −0.17, (−0.21 to −0.14). Inset: relative proportions of cells in both groups. Top: distribution of time lag at peak correlation (PVM: 1.92 seconds (0.17 to 4.65), NVM: 0.17 seconds (0.13 to 1.33), median (inter-quartile range). C. VIP+ IN responses to running-start (left, n=261 events, 5 mice, 52±12 events per mouse, mean±s.d.) and running-stop events (right, n=170 events, 5 mice, 34±17 events per mouse, mean±s.d.). Top: velocity mean±s.e.m. of locomotion events. Middle: Responses of PVM VIP+ INs (same 180 cells for both event types). Each row is the peak-normalized mean ΔF/F of a cell. Cells are sorted by the statistical significance of their responses to the events (see Methods). Bottom: Responses of NVM VIP+ INs (same 41 cells for both event types). Time is relative to the onset of the locomotion event. D. Mean ± s.e.m. peri-stimulus time histogram of PVM (top) and NVM (bottom) VIP+ INs triggered by running-start (left) and running-stop (right). E. Amplitude of PVM and NVM VIP+ IN responses (mean±s.e.m) to running-start (left: t=7.77, p=3.42×10⁻¹¹) and running-stop events (right: t=5.95, p=1.74×10⁻⁷) are significantly different between the two groups (α=0.025). F. Modulation magnitude of Ca2+ activity in VIP+ IN subgroups during steady state locomotion (see Methods). See also Figures S2-S4.
Figure 3.
Figure 3.
VIP+ INs are modulated by reward during spatially guided reward learning. A. Goal oriented learning (GOL) task. Left: Water reward is operantly delivered at a fixed 10-cm long, non-cued location on the belt. Mice ran for 3×10 minute sessions per day for 3 days. Right: mice learned to selectively lick near the location of the reward (bottom inserts, distribution of licks on the belt) (n=10 mice, 17±1 sessions/mouse for 9 mice, 9 sessions for one mouse). B. Distribution of peak cross correlation between velocity and VIP+ IN Ca2+ activity in the GOL task (n=253 cells, 10 mice, 25±15 cells/mouse, mean±s.d.), grouped as PVM (red, 184 cells, 18±12 cells/mouse, mean±s.d., median correlation: 0.27 (0.18 to 0.67), median (inter-quartile range)) and NVM (blue, 69 cells, 7±4 cells/mouse, mean±s.d., correlation: −0.22, (−0.31 to −0.15)) groups as in RF. C. PVM VIP+ IN responses to reward delivery events. Left: random foraging (RF, 175 cells), Middle: GOL (184 cells). Each row is the peak-normalized mean ΔF/F of a cell triggered by reward delivery events normalized by the cell’s maximum, sorted by statistical significance of responses (see Methods). The proportions of cells in each response group are significantly different between RF and GOL (χ2 test, χ2(2, N=359)=105.6, p=1.2×10⁻²³). Right: Top: PSTH of PVM VIP+ INs in RF and GOL tasks triggered by reward delivery. Bottom: mean±s.e.m amplitude of PVM VIP+ IN transients in RF and GOL tasks (t=5.34, p=6.3×10⁻⁹). D. NVM VIP+ IN responses as in C (RF: 39 cells, GOL: 69 cells). The proportion of cells in each response group are significantly different between RF and GOL (χ2 test, χ2 (2, N=108) =37.1, p=8.8×10⁻⁹). Right bottom: mean±s.e.m of NVM VIP+ IN transient amplitudes in RF and GOL tasks (t-test, t=−5.3, p=7.1×10⁻⁷). For χ2 tests and t-tests in C and D, α=0.025. See also Figures S2-S4.
Figure 4.
Figure 4.
Task-dependent modulation of running-stop responses of VIP+ INs by reward. A. Left: Fractions of cells whose running-stop responses are significantly modulated by reward delivery (see Methods). PVM: χ2 test, χ2 (2, N=359) =71.1, p=3.6×10⁻¹⁶, NVM: χ2 (2, N=114) =33.7, p=4.8×10⁻⁸, α=0.025. Right: Transient amplitude modulation (mean±s.e.m) for significant positive cells (top, purple, PVM: t=−3.8, p=0.0009, NVM: t=−0.45, p=0.69) and significant negative cells (bottom, olive, PVM: t=−0.98, p=0.33, NVM: T=−0.8, p=0.5), α=0.0125. B, C. Reward modulation of transient amplitude before and after running-stop events in the GOL task show significant correlation (α=0.0125) with behavior for PVM but not NVM VIP+ INs. Each point is the mean modulation of the cells in a session and the licking performance of that session. Shaded region: 99% bootstrap confidence interval of the least-squares linear fit. See also Figure S4.
Figure 5.
Figure 5.
Influence of locomotion, reward, and position on VIP+ IN activity during learning. A. Schematic of the generalized linear model (GLM) with example behavioral predictors and model fit. Top: example 10-fold cross-validation (CV) of the model on 100 seconds of activity. Each row is a fold; grey and green indicate data used for training and testing, respectively. Middle: example activity of a cell and GLM predictions. Bottom: behavior variables used for fitting the activity (see Methods). B. Left: distribution of r2 between the activity and the GLM prediction calculated for each cell, reported for PVM and NVM cell groups (2942 cell-sessions, 250 cells, 11±5 sessions/cell, mean±s.d.). Right: Information gained (log likelihood ratio, see Methods) for predicting VIP+ IN activity by including each category of behavior signals in the model (Reward: PVM: 0.005 (0.002−0.01), NVM: 0.005 (0.003−0.01), Locomotion: PVM: 0.004 (0.002−0.008), NVM: 0.004 (0.002−0.007), Position: PVM: 0.013 (0.008−0.018), NVM: 0.015 (0.01−0.022), median (interquartile range)). The predictive information contributed independently by each variable category is significantly different from zero (1-sample t-test, α=0.0083. Reward: PVM: t(2072)=37.83, p=1.32×10−238, NVM: t(596)=20.27, p= 7.19×10−70. Locomotion: PVM: t(2072)=37.05, p=4.89×10−231, NVM: t(596)=19.19, p=2.93×10−64. Position: NVM: t(2072)=69.24, p<1.0×10−300, PVM: t(596)=36.75, p=2.66×10−155). Predictive information also differed between variable categories according to group (bits/(sample*number of variables), 2-way RM ANOVA, categories: F(2, 476)=395.3, p=6.8×10−102, n=240 cells, groups: F(1, 238)=0.053, p=0.82, interaction: F(2, 476)=51, p=8.47×10⁻²², α=0.05). C, D. Information gained from the three categories of behavioral signals is correlated with learning (α=0.0055, nine tests: three for each category). Each point represents the average information gain for cells in a session and the corresponding licking performance of the animal in that session (see Figure 3A). C. Top: locomotion-related variables. Left: all VIP+ INs, Right: NVM and PVM groups. Bottom: reward-related variables. D. Left: information gained from all position variables is not correlated with learning (PVM and NVM groups not shown). Information gain is highest in the reward zone (middle). Right: The information gain from positions near the reward (10% of the lap centered around the reward zone) is significantly different from that gained from positions away from the reward (2-way RM ANOVA, positions: F(1, 248)= 116.4, p=1.7×10⁻²², groups: F(1, 248)=11.5, p=0.0008, interaction: F(1, 248)=0.25, p=0.61, α=0.05). E. Positions near the reward have a weak positive correlation with performance (left) while positions away from the reward have a stronger and significant (α=0.025) negative correlation with performance (right). F. The difference between information gain from positions near and away from the reward zone (near-away) is positively correlated with learning. Left: all VIP+ INs, right: VIP+ INs divided by PVM and NVM groups (α=0.016). See also Figure S4.
Figure 6.
Figure 6.
Inhibiting VIP+ INs impairs goal-directed enrichment of place cells during the GOL task. A. Optogenetic manipulation VIP+ IN activity bidirectionally affects learning performance in the GOL task. Top: Performance measured by fraction of licks near reward location. Bottom: schematic of training schedule. VIP-GFP, (7 mice), VIP-ArchT (9 mice), and VIP-ChR2 (4 mice) performance on the first reward zone was not significantly different (2-way RM ANOVA). Group performance on the second reward zone was significantly different (2-way RM ANOVA: groups: F(2, 15): 12,23, p=0.0007, n=20 mice, days: F(2, 34): 74.6, p=3.7×10⁻¹³, interaction: F(4, 34)=5.76, p=0.001. α=0.025, days 1–3 and days 4–6). Black bars and asterisks in days 4–6: significant differences between pairs (2-sample t-test, α=0.0055). B. Imaging CA1PC activity before and after learning while modulating VIP+ IN activity: CA1PCs were imaged on the first and last session with no laser (left – experiment schedule) for mice expressing tdTomato (control, n=7 mice, first session: 3668 cells, 524±204 cells/mouse, last session: 3697 cells, 528±192 cells/mouse, mean±s.d.) and ArchT-tdTomato (n=5 mice, first session: 2271 cells, 454±166 cells/mouse, last session: 2204 cells, 441±178 cells/mouse) in VIP+ INs. Right: example FOV with widespread expression of GCaMP6f and ArchT-tdTomato expression in VIP+ INs (red and yellow) in CA1 SP. C. CA1PC transient rates (left) and transient AUC (right) were not significantly different between VIP-tdTomato and VIP-ArchT mice in the first and last session (2-way RM ANOVA). D. Fraction of place cells (left) and place field width (right) were not significantly different between VIP-tdTomato and VIP-ArchT mice (2-way RM ANOVA). E. CA1PC place field distributions for the first (top) and last session (bottom). VIP-tdTomato controls show enrichment of place cells near the reward zone after learning (first session: 1017 cells, 145±37 cells/mouse, last session: 1064 cells, 152±54 cells/mouse. VIP-ArchT: first session: 625 cells, 125±41 cells/mouse, last session: 494 cells, 98±31 cells/mouse, mean±s.d.). F. Left: fraction of place fields near the reward zone (15% of belt approaching zone) is significantly higher than expected from a uniform distribution of place fields for VIP-tdTomato mice after learning (1-sample t-test, t(6)=4.43, p=0.004, α=0.0125). Right: On a per mouse basis, control mice (one-sample t-test against a Δfraction of 0, t(6)=4.65, p=0.003, n=7 mice, α=0.025), but not VIP-ArchT mice (1-sample t-test, t(4)=0.67, p=0.54, n=5 mice), showed a significant increase in the fraction of place fields near the reward zone post-learning. See also Figures S6 and S7.
Figure 7.
Figure 7.
Computational model of the CA1 network. A. Morphological properties of simulated neuronal types and corresponding voltage traces for negative (−0.2 nA) and positive (top of the traces) current injections at the soma (for 1000 ms). B. Schematic diagram of the model connectivity (right). PC: pyramidal cells, AAC: axo-axonic cells, BC: basket cells, BSC: bistratified cells, OLM: Oriens-lacunosum moleculare cells, VCCK: VIP+/CCK+ cells, VCR: VIP+/CR+ cells. C. Left: Place cell formation using grid-like inputs. Each pyramidal cell receives an octal of grid-like inputs from entorhinal cortex layer III (EC LIII) and an octal from CA3 pyramidal cells. INs receive inputs from randomly selected EC LIII and CA3 pyramidal cells and inhibitory Septal inputs. Right: CA1PC activity before learning (virtual animals cover the track with a constant speed). D. Mean firing rate of all INs before learning (mean±s.d.). Color scheme is the same as in A and B. See also Figures S6 and S7.
Figure 8.
Figure 8.
Modeling the effects of VIP+ INs on spatial learning. A. Spatial heatmaps of CA1PC place cell mean firing rates prior to the simulated GOL learning. Virtual animals cover the 2-m linear track with constant velocity. From left to right: Control, deletion of all VIP+ INs, deletion of VIP+/CR+ INs and deletion of VIP+/CCK+ INs. White dashed line represents the reward location while zero denotes the center of the reward zone. B. Same as in A, with speed modulation. Virtual animals spend more time within the simulated reward zone but no plasticity takes place (similar to day 1 in experiments). C. Same as in A and B, after learning the simulated GOL task (similar to day 4 in experiments). Virtual animals spend more time within the simulated reward zone and place cells active in the reward zone have strengthened synaptic weights in their EC and CA3 afferents. The model reproduces the enriched encoding of the reward zone: more CA1PCs have a place field within the reward zone compared to pre-learning (A). D. Number of CA1PCs within the reward zone (extending over 15% or 30cm on the track) under the four deletion conditions (mean±s.e.m.). Post learning enrichment is significantly decreased when deleting all VIP+ INs and specifically when deleting the VIP+/CR+ population. VIP+/CCK+ deletion has a positive effect on enrichment (comparisons with baseline for all conditions in post-learning stage, 1-sample t-test, control: t(9)=6.28, p=0.00014, VIP+ deletion: t(9)=1.55, p=0.16, VIP+/CR+ deletion: t(9)=1.65, p=0.13, VIP+/CCK+ deletion: t(9)=7.018, p=0.00006, VIP+/PVM deletion: t(9)=3.49,p=0.007, VIP+/NVM deletion: t(9)=3.61, p=0.0056, α=0.0083 corrected for 6 comparisons). Differences among groups were statistically significant (2-way ANOVA: learning stage: F (2, 162) = 80.41, p<10−15, α=0.025, condition: F (5, 162) = 14.74, p=6.6×10⁻¹², α=0.01, interaction: F (10, 162) = 7.929, p=2.5×10⁻¹⁰, α=0.005). Removal of VIP+ INs leads to a significant drop in enrichment. This reduction is very similar to the one induced when removing VIP+/CR+ cells, while removal of VIP+/CCK+ cells slightly increases enrichment, comparing with the control respectively. Removal of PVM or NVM VIP+ INs did not have a statistically significant effect on enrichment. Locomotion alone is not sufficient to increase place cell representation of reward location. Stars denote significance with paired t-test (two-tailed) with Bonferroni’s correction. E. Mean CA1PC frequency (mean±s.e.m.) across the entire track, within the reward zone and outside the reward zone. Place cells have lower firing rates under VIP+ and VIP+/CR+ IN deletion conditions, while removal of VIP+/CCK+ results in not significantly increased firing within the reward zone. Removal of PVM or NVM VIP+ IN also results in similar sized, slightly decreased CA1PC firing (2-way ANOVA: position: F (2, 11247) = 353.1, p<10−15, α=0.025, condition: F (5, 11247) = 147.9, p < 10−15, α=0.01, interaction: F (10, 11247) = 47.00, p<10−15, α=0.005) Stars denote significance with unpaired t-test (two-tailed) with Bonferroni’s correction. See also Figures S6-S8.

Comment in

  • Disinhibition Goes Spatial.
    Pardi MB, Abs E, Letzkus JJ. Pardi MB, et al. Neuron. 2019 Mar 20;101(6):994-996. doi: 10.1016/j.neuron.2019.03.006. Neuron. 2019. PMID: 30897364

Similar articles

Cited by

References

    1. Acsady L, Arabadzisz D, and Freund TF (1996a). Correlated morphological and neurochemical features identify different subsets of vasoactive intestinal polypeptide-immunoreactive interneurons in rat hippocampus. Neuroscience 73, 299–315. - PubMed
    1. Acsady L, Gorcs TJ, and Freund TF (1996b). Different populations of vasoactive intestinal polypeptide-immunoreactive interneurons are specialized to control pyramidal cells or interneurons in the hippocampus. Neuroscience 73, 317–334. - PubMed
    1. Alitto HJ, and Dan Y (2012). Cell-type-specific modulation of neocortical activity by basal forebrain input. Frontiers in systems neuroscience 6, 79. - PMC - PubMed
    1. Allen WE, Kauvar IV, Chen MZ, Richman EB, Yang SJ, Chan K, Gradinaru V, Deverman BE, Luo L, and Deisseroth K (2017). Global Representations of Goal-Directed Behavior in Distinct Cell Types of Mouse Neocortex. Neuron 94, 891–907 e896. - PMC - PubMed
    1. Arriaga M, and Han EB (2017). Dedicated Hippocampal Inhibitory Networks for Locomotion and Immobility. The Journal of neuroscience : the official journal of the Society for Neuroscience 37, 9222–9238. - PMC - PubMed

Publication types

MeSH terms

Substances

LinkOut - more resources