. 2019 Feb 12;12(2):366-380.
doi: 10.1016/j.stemcr.2019.01.002. Epub 2019 Jan 31.

Sox10 Regulates Plasticity of Epithelial Progenitors toward Secretory Units of Exocrine Glands

Affiliations

Sox10 Regulates Plasticity of Epithelial Progenitors toward Secretory Units of Exocrine Glands

Harleen K Athwal et al. Stem Cell Reports. .

Abstract

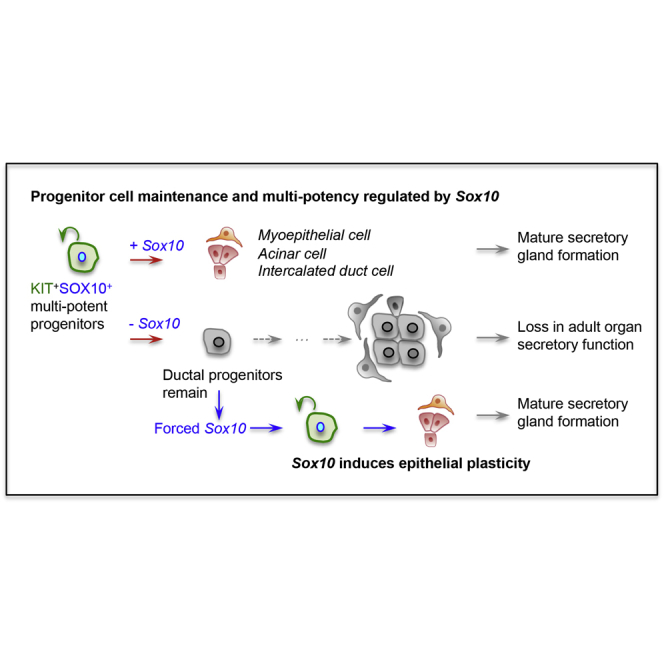
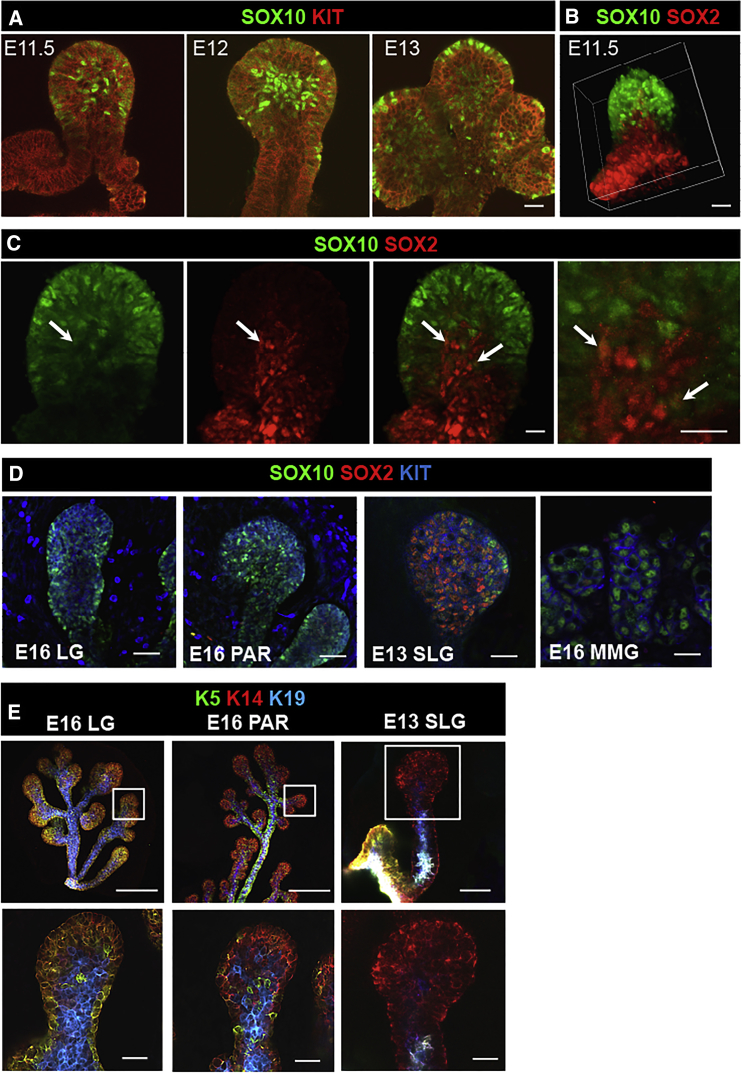
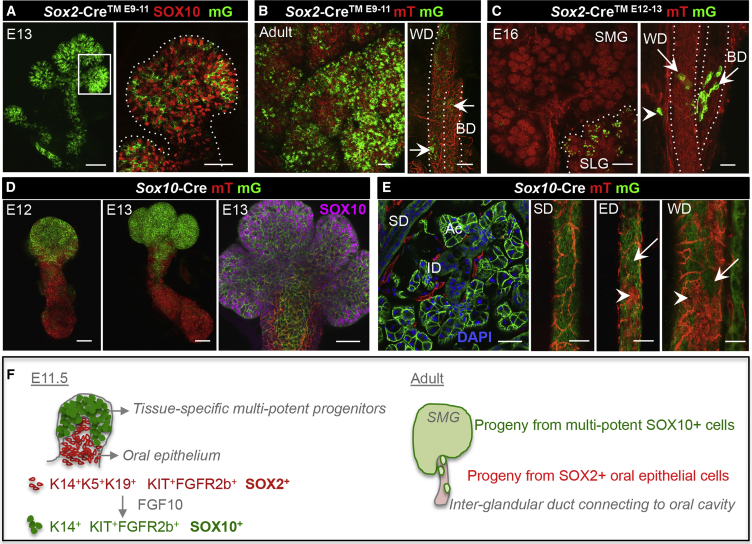
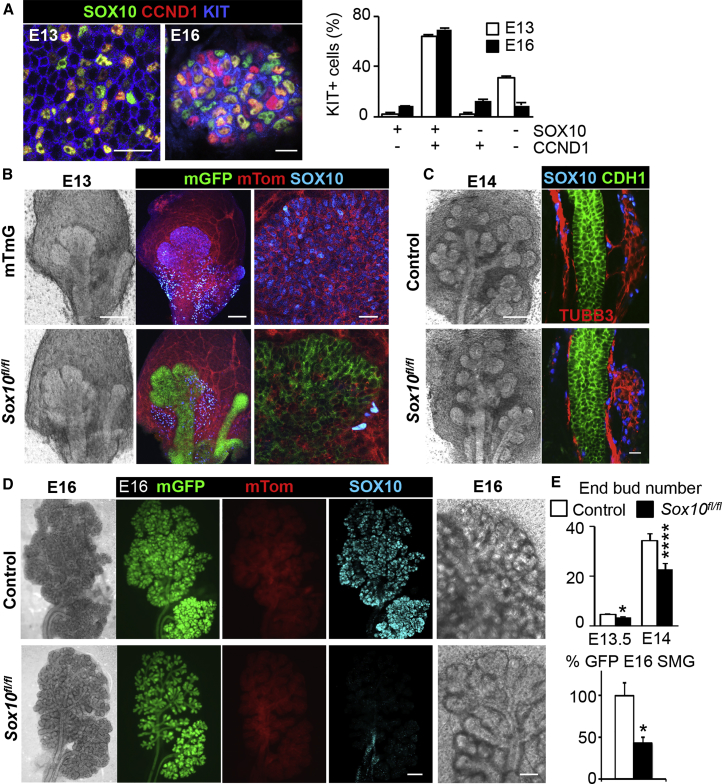
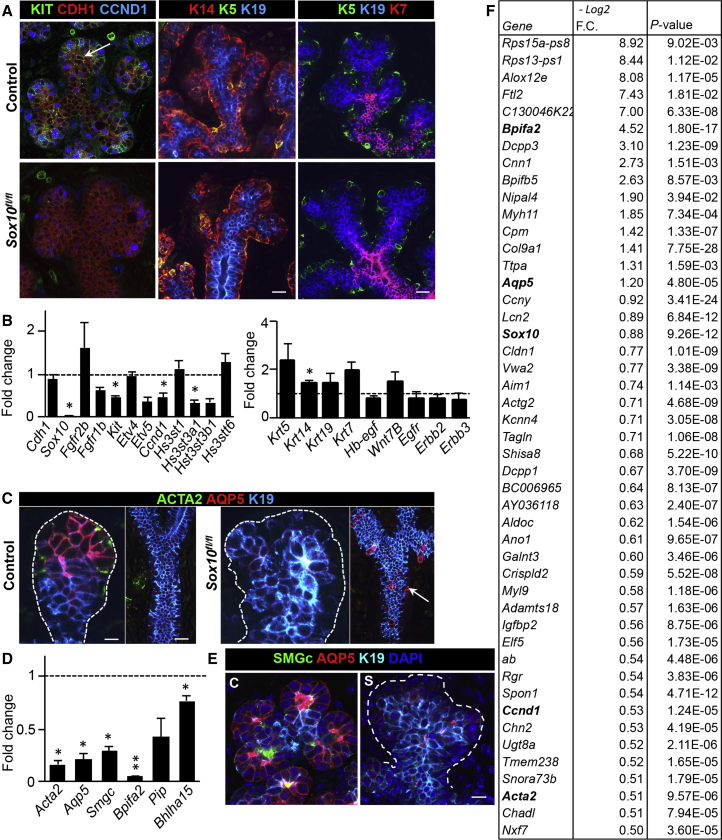
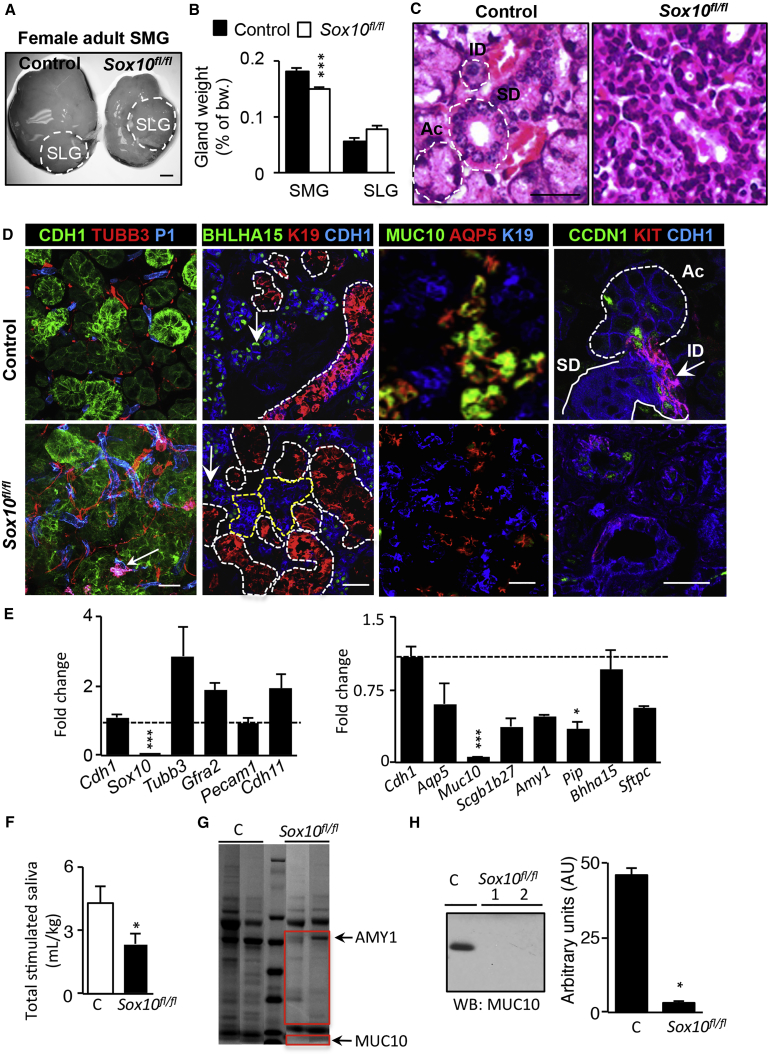
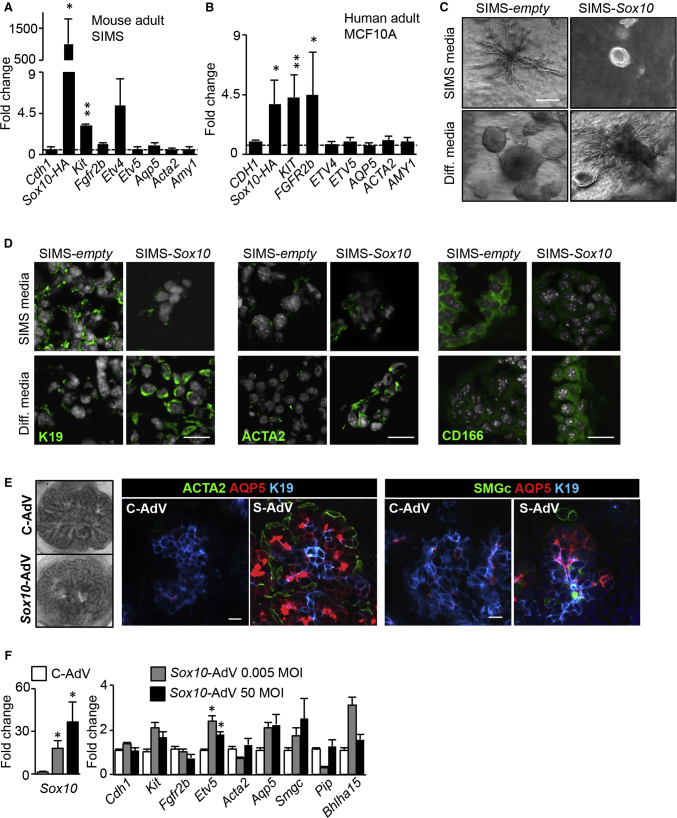
Understanding how epithelial progenitors within exocrine glands establish specific cell lineages and form complex functional secretory units is vital for organ regeneration. Here we identify the transcription factor Sox10 as essential for both the maintenance and differentiation of epithelial KIT+FGFR2b+ progenitors into secretory units, containing acinar, myoepithelial, and intercalated duct cells. The KIT/FGFR2b-Sox10 axis marks the earliest multi-potent and tissue-specific progenitors of exocrine glands. Genetic deletion of epithelial Sox10 leads to loss of secretory units, which reduces organ size and function, but the ductal tree is retained. Intriguingly, the remaining duct progenitors do not compensate for loss of Sox10 and lack plasticity to properly form secretory units. However, overexpression of Sox10 in these ductal progenitors enhances their plasticity toward KIT+ progenitors and induces differentiation into secretory units. Therefore, Sox10 controls plasticity and multi-potency of epithelial KIT+ cells in secretory organs, such as mammary, lacrimal, and salivary glands.

Keywords: KIT; SOX10; cell fate; exocrine glands; lacrimal gland; mammary gland; salivary gland; secretory unit; stem/progenitor cell.


Figures

None
Graphical abstract
Figure 1
Figure 1
The KIT/FGFR2b-Sox10 Axis Defines Initial Tissue-Specific Cells (A) Confocal images of E11.5, E12, and E13 isolated SMG epithelia stained for SOX10 and KIT. Scale bars, 20 μm. (B) E11.5 isolated epithelium stained for SOX10 and SOX2. Scale bars, 20 μm. (C) SOX10 and SOX2 expression in E11.5 epithelium. Arrows outline SOX10+SOX2+. Scale bars, 20 μm. (D and E) Confocal images of E16 LG, E16 PAR, E13 SLG, and E16 MMG. Tissue was stained for SOX10, SOX2, and KIT, or K14, K5, and K19. Scale bars, 100 μm (D) and 20 μm (E).
Figure 2
Figure 2
Initial Tissue-Specific SOX10+ Cells Are Multi-potent Progenitors Sox2-Cre™ or Sox10-Cre mice were crossed with Rosa26-mTmG mice for lineage tracing. mGFP+ (mG) cells are lineage-derived cells, mTomato (mT) cells are not. (A and B) E9–E11 induced lineage tracing seen in isolated E13 epithelia (A) or adult SMG (B). E13 epithelium was co-stained with SOX10. Scale bars: (A, left and B, left) 100 μm; (A, right and B, right) 20 μm. WD, SMG Wharton's duct; BD, SLG Bartholin's duct. Arrows outline mG+ cells. (C) Confocal images of E16 SMG with WD, and SLG with BD. Tissue was lineage traced from E12–13. Scale bar, 100 μm. (D) Isolated epithelia were analyzed by confocal microscopy at E12 and E13. E13 epithelium was co-stained for SOX10. Scale bars, 100 μm (left and middle) and 20 μm (right). (E) Confocal imaging of adult SMG intra-glandular striated ducts (SD), inter-glandular excretory ducts (EDs) and WDs. Arrowheads and arrows represent mT and mG epithelial cells, respectively. Acinar cell (Ac), intercalated duct (ID). Scale bars, 20 μm (left) and 200 μm (centers and right). (F) Graphical cartoon depicting the presence of two epithelial cell types after E11.5 SMG initiation: SOX2+ oral epithelial cells co-expressing K14, K5, and K19, and distal SOX10+ tissue-specific SMG cells solely co-expressing K14. Both cell types express KIT and FGFR2b, but contribute differentially to adult glands. Once tissue-specific cells are formed, oral epithelial cells only contribute to parts of the inter-glandular ducts connecting the secretory organ with the oral cavity. Instead, Sox10 cells form all epithelial cells in the adult SMG, as well cells parts in inter-glandular ducts.
Figure 3
Figure 3
Loss in Sox10 Negatively Impacts Exocrine Gland Formation (A) Confocal pictures of KIT, SOX10, and CCND1 co-staining in E13 and E16 SMG endbuds. Scale bars, 20 μm. Graph represents KIT+ subpopulations counted on multiple sections through endbuds at each time point. N > 3, Mean ± SEM. (B and C) Bright-field and confocal pictures of E13 (B) and E14 (C) control (Krt14-Cre;Rosa26-mTmG;Sox10flox/+ or Rosa26-mTmG or Sox10flox/flox mice) and Sox10fl/fl (Krt14-Cre;Rosa26-mTmG;Sox10flox/flox) SMGs. SMGs were labeled for SOX10, TUBB3, and CDH1. Scale bars, 100 and 20 μm. (D) Bright-field and fluorescent images of E16 control and Sox10fl/fl SMGs. SMGs were stained for SOX10. Scale bars, 500 and 250 μm. (E) Quantification of endbud number in E13.5 and E14 SMGs from control and Sox10fl/fl mice. Mean ± SEM, N > 3, unpaired t test. p < 0.05, ∗∗∗∗p < 0.0001. Control E13 (4.5 ± 0.4) versus Sox10fl/fl (3.4 ± 0.2), control E14 (34.2 ± 2.8) versus Sox10fl/fl (22.7 ± 2.4). Graph depicting GFP expression in E16 control and Sox10fl/fl SMGs. Data are normalized to control, mean ± SEM, N > 3, unpaired t test. p < 0.05. Control (100.0% ± 15.8%) versus Sox10fl/fl (43.1 ± 7.2%).
Figure 4
Figure 4
Sox10 Induces Plasticity By Regulating fetal KIT+ Progenitor Maintenance and Differentiation (A) Confocal imaging of control and Sox10fl/fl E16 SMGs endbuds. Tissue was stained for KIT (arrow), CDH1, CCND1, K14, K5, K19, and/or K7. Scale bars, 20 μm. (B) Graphs show fold changes in gene expression of the Fgfr2b/Kit signaling pathway in epithelial (Cdh1) cells of Sox10fl/fl E16 SMGs, Ccnd1, heparan sulfates, as well as ductal-related markers (Krt's) and correlated signaling pathways (Egf, Wnt). Data were normalized to Rps29 and control (dotted line). Mean ± SEM, N > 3, multiple comparison t test. p < 0.05. (C) Confocal imaging of stained E16 control and Sox10fl/fl SMGs with ACTA2, AQP5, and K19. Arrow represents mislocated AQP5 expression in ducts. Scale bars, 20 μm. (D) Fold changes in gene expression of proteins expressed by myoepithelial, acinar, and/or ID cells. Data was normalized to Rps29 and control (dotted line). Mean ± SEM, N > 3, multiple comparison t test. p < 0.05. ∗∗p < 0.01. (E) Sox10fl/fl and control E16 SMGs were stained for SMGc, AQP5, K19, and DAPI and analyzed by confocal microscopy. Dotted line outlines the distal area. Scale bar, 20 μm. (F) RNA sequencing data of E16 Sox10fl/fl SMGs versus control. The list of downregulated genes was generated after bioinformatic analysis of next-generation sequencing data and cutoff at log2 fold change (FC) of −0.25. Genes outlined in bold were validated by qPCR analysis.
Figure 5
Figure 5
Sox10 Induces Plasticity by Regulating Fetal KIT+ Progenitor Maintenance and Differentiation (A) Bright-field picture of SMGs from female adult control or Sox10fl/fl mice. Scale bar, 1 mm. (B) Graph represents weight of female SMGs as a percentage of body weight (bw) (control, 0.18% ± 0.01%; Sox10fl/fl, 0.13% ± 0.02%). Female SLG (control, 0.06% ± 0.01%; Sox10fl/fl, 0.07% ± 0.01%). Mean ± SEM, N > 3, unpaired t test. ∗∗∗p < 0.005. (C) H&E staining on paraffin sections of adult female SMGs of control or Sox10fl/fl mice. Ac, ID, and SDs are outlined by white dotted line. Scale bar, 25 μm. (D) Confocal imaging of adult control and Sox10fl/fl SMGs stained for CDH1, TUBB3, PECAM1 (P1), BHLHA15, K19, MUC10, AQP5, KIT, and CCND1. Scale bars, 20 μm. (E) qPCR analysis of genes comparing adult control and Sox10fl/fl SMGs. Mean ± SEM, N > 3, multiple comparison t test. ∗∗∗p < 0.001, p < 0.05. (F) Saliva production of adult control and Sox10fl/fl mice, normalized to their body weight. Mean ± SEM, N > 3, unpaired t test. p < 0.05. (G) Secretory proteins from saliva of adult control and Sox10fl/fl mice were separated using SDS-PAGE. Gels were stained with Coomassie blue. (H) MUC10 protein analysis in saliva of adult control and Sox10fl/fl mice via western blot (WB). Graph shows quantification of MUC10 western using densitometry analysis. Mean ± SEM, N ≥ 3, unpaired t test. p > 0.05.
Figure 6
Figure 6
Sox10 Induces Plasticity by Regulating Fetal KIT+ Progenitor Self-Renewal and Differentiation (A and B) Fold changes in gene expression of SIMS and MCF10A transduced with lentivirus-expressing Sox10, grown in 2D. Data were normalized to empty lentivirus-transduced cells and Rps29 (dotted line). Mean ± SEM, N > 3, multiple comparison t test. p < 0.05. ∗∗p < 0.01. (C) Bright-field pictures of SIMS-empty or SIMS-Sox10 in 3D, and cultured for 7 days in SIMS medium or differentiation (diff) medium. Scale bar, 250 μm. (D) Confocal images of K19, ACTA2, and CD166 on cells in the various conditions seen in (C). Scale bars, 30 μm. (E) Bright-field pictures of recombined fetal SMGs. Control or Sox10fl/fl SMG E13 epithelia was transfected with control eGFP-Adv (C-Adv) or Sox10-Adv (S-Adv) at 0.005 or 50 MOI before being recombined with its original mesenchyme, blood vessels, and parasympathetic ganglia. Recombined glands were cultured for an additional 6 days. Tissue was stained for ACTA2, AQP5, K19, or SMGc, and analyzed by confocal microscopy. Scale bars, 20 μm. (F) Fold changes in expression of Sox10, and genes related to Fgfr2b/Kit signaling, myoepithelial, acinar, and ID markers from tissue in (E). Data were normalized to Rps29 and C-Adv recombined tissue. Mean ± SEM, N > 3, multiple comparison t test. p < 0.05.

References

    1. Abdelalim E.M., Emara M.M., Kolatkar P.R. The SOX transcription factors as key players in pluripotent stem cells. Stem Cells Dev. 2014;23:2687–2699. - PubMed
    1. Arany S., Catalan M.A., Roztocil E., Ovitt C.E. Ascl3 knockout and cell ablation models reveal complexity of salivary gland maintenance and regeneration. Dev. Biol. 2011;353:186–193. - PMC - PubMed
    1. Avilion A.A., Nicolis S.K., Pevny L.H., Perez L., Vivian N., Lovell-Badge R. Multipotent cell lineages in early mouse development depend on SOX2 function. Genes Dev. 2003;17:126–140. - PMC - PubMed
    1. Bullard T., Koek L., Roztocil E., Kingsley P.D., Mirels L., Ovitt C.E. Ascl3 expression marks a progenitor population of both acinar and ductal cells in mouse salivary glands. Dev. Biol. 2008;320:72–78. - PMC - PubMed
    1. Chan S.S., Kyba M. What is a master regulator? J. Stem Cell Res. Ther. 2013;3 - PMC - PubMed

Publication types

Substances