. 2019 Mar 7;24(3):419-432.e6.
doi: 10.1016/j.stem.2019.01.002. Epub 2019 Jan 31.

EGFR-Aurka Signaling Rescues Polarity and Regeneration Defects in Dystrophin-Deficient Muscle Stem Cells by Increasing Asymmetric Divisions

Affiliations

EGFR-Aurka Signaling Rescues Polarity and Regeneration Defects in Dystrophin-Deficient Muscle Stem Cells by Increasing Asymmetric Divisions

Yu Xin Wang et al. Cell Stem Cell. .

Abstract

Loss of dystrophin expression in Duchenne muscular dystrophy (DMD) causes progressive degeneration of skeletal muscle, which is exacerbated by reduced self-renewing asymmetric divisions of muscle satellite cells. This, in turn, affects the production of myogenic precursors and impairs regeneration and suggests that increasing such divisions may be beneficial. Here, through a small-molecule screen, we identified epidermal growth factor receptor (EGFR) and Aurora kinase A (Aurka) as regulators of asymmetric satellite cell divisions. Inhibiting EGFR causes a substantial shift from asymmetric to symmetric division modes, whereas EGF treatment increases asymmetric divisions. EGFR activation acts through Aurka to orient mitotic centrosomes, and inhibiting Aurka blocks EGF stimulation-induced asymmetric division. In vivo EGF treatment markedly activates asymmetric divisions of dystrophin-deficient satellite cells in mdx mice, increasing progenitor numbers, enhancing regeneration, and restoring muscle strength. Therefore, activating an EGFR-dependent polarity pathway promotes functional rescue of dystrophin-deficient satellite cells and enhances muscle force generation.

Keywords: Aurka; Duchenne muscular dystrophy; EGF; EGFR; apicobasal polarity; asymmetric cell division; muscle stem cell; satellite cell; skeletal muscle.


Conflict of interest statement

CONFLICTS OF INTEREST

M.A.R. is a Founding Scientist of Satellos Bioscience Inc. The other authors declare no competing financial interests.

Figures
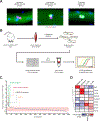
Figure 1.
Figure 1.. Identification of Small Molecules that drive Satellite Stem Cell Symmetric Division
(A) Symmetric satellite stem cell division, asymmetric satellite stem cell division, and committed satellite cell division on single Myf5-Cre/R26R-eYFP myofibers after 42h culture stained with Pax7 (red), eYFP (green) and DAPI (blue). (B) Graphic overview of myofiber screening protocol. (C) Relative changes to satellite stem cell numbers with small molecule treatment sorted by changes to eYFPNeg satellite stem cell numbers compared to vehicle (DMSO) controls. Wnt7a was a positive control. Screening hits are listed in Table S1. (D) Microarray heatmap representing genes from the EGFR/Erbb and Aurk family from prospectively isolated satellite cells, cultured myoblasts in vitro, and 2- and 5-day-differentiated myotubes.
Figure 2.
Figure 2.. Lapatinib and TC-A2317 Inhibit Asymmetric Satellite Stem Cell Divisions
(A) Number of asymmetric and (B) symmetric satellite stem cell divisions per myofiber at 42h of culture in the presence of Lapatinib normalized to DMSO control (vehicle). (C) Number of eYFPNeg and (D) total Pax7-expressing satellite stem cells per myofiber at 42h of culture in the presence of Lapatinib normalized to DMSO control (vehicle). (E) Number of asymmetric and (F) symmetric satellite stem cell divisions per myofiber at 42h of culture in the presence of TC-A2317 normalized to DMSO control (vehicle). (G) Number of eYFPNeg and (H) total Pax7-expressing satellite stem cells per myofiber at 42h of culture in the presence of TC-A2317 normalized to DMSO control (vehicle). (A–H) Error bars represent means ± SEM; p-values: *=<0.05; **=<0.01; ***=<0.005. (A–D) n=5 mice; (E–H) n=3 mice.
Figure 3.
Figure 3.. Polarized Localization and Activation of EGFR in Satellite Cells
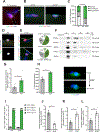
(A) Localization of EGFR (green) in Pax7-expressing (red) satellite cells on an immunostained muscle section. The basal surface of the satellite cell is attached to a basal lamina that surrounds both the cell and its host fiber. Dashed lines are based on autofluorescence of the myofiber sarcolemma. (B) Signaling status of p-EGFR (green) in Pax7-expressing (red) and DAPI positive (blue) cells on EDL myofibers at 1h culture in vehicle or EGF containing media. (C) Quantification of p-EGFR staining in satellite cells on EDL myofibers at 1h culture in vehicle or EGF containing media. (D) Polarized p-EGFR (green) staining in mitotic p-H3-expressing (white) Pax7-expressing (red) satellite cells on EDL myofibers at 36h. DAPI (blue). (E) Analysis of EGFR and p-EGFR localization from injured EDL muscle fixed 2 days post injury and manually dissociated then stained with DAPI (blue), EGFR or p-EGFR (green) and Pax7 (red). (F) Immunoblotting analysis of p-EGFR, EGFR, Aurka, Pax7, Myog expression in TA muscles of uninjured, or 3, 7, 14 and 21 days post-saline or cardiotoxin (CTX) injection. (G) Number of asymmetric satellite stem cell divisions per myofiber at 42h of culture in EGF containing media normalized to vehicle. (H) Number of apicobasally oriented mitotic satellite cell divisions at 36h of culture in EGF containing media normalized to vehicle stained with p-Aurk (green). The host myofiber is outlined with a dashed line. DAPI (blue). (I) Quantification of EdU labelled satellite cells on myofibers from Myf5-Cre/R26R-eYFP mice cultured in vehicle or EGF containing media supplemented with EDU for 20h and with a 20h chase prior to fixation. (J) Number of asymmetric satellite stem cell divisions, (K) symmetric satellite stem cell divisions and (L) number of eYFPNeg satellite stem cells per myofiber at 42h of culture after transfection with siRNA against EGFR (siEGFR) normalized to scrambled siRNA (siSCR). (H, G, and J–L) Error bars represent means ±SD; p-values: *=<0.05; **=<0.01; ***=<0.005; (C) n=3 mice; (E) n=43 and n=46 cells respectively; (F) n=2 mice per timepoint; (G) n=6 mice; (H) n=5 mice; (I) n=3 mice; (J–L) n=4 mice.
Figure 4.
Figure 4.. EGF promotes asymmetric division in satellite stem cells
(A) Graphic overview of Myf5-Cre/R26R-nTnG satellite cell transplantation into injured NSG mice. (B-D) Representative images of transplanted satellite cells stained with DAPI (blue), GFP (green), TdTomato (red) and Pax7 (gray). (E) Graphic overview of cardiotoxin-induced injury and treatment with recombinant EGF in EGFR cKO mice. (F) Quantification of Pax7-expressing cells on sections from non-injured and regenerating EGFR cKO or Pax7-CreERT2 TA muscles 10 days post injury. (G) Quantification of Pax7-expressing and (H) Myog-expressing cells on sections from regenerating EGFR cKO or Pax7-CreERT2 TA muscles 10 days post cardiotoxin-induced injury treated with control (saline), or EGF protein. (B-D and F-H) Error bars represent means ±SEM; p-values: *=<0.05; (B, D) n=3 donor; (C) n=4 donor; (F) n=4 mice; (G-H) n=3 mice.
Figure 5.
Figure 5.. EGFR Signals through Aurka to Stimulate Asymmetric Divisions
(A) Immunofluorescence localization of Aurka (red) at centrosomes in mitotic metaphase (left) and anaphase (right) myoblasts. Pax7 (green); DAPI (blue). (B) Immunoblotting of reciprocal co-immunoprecipitation of Aurka and p-EGFR in serum-starved myoblasts refed 1h in vehicle or EGF containing growth media. (C) Proximity ligation assay for interactions between Aurka and p-EGFR (red) in serum-starved Pax7-nGFP (green) myoblasts refed 1h in vehicle or EGF containing growth media. DAPI (blue). (D) Number of asymmetric and (E) symmetric satellite stem cell divisions per myofiber at 42h of culture after transfection of siRNA against Aurka (siAurka) normalized to scrambled control siRNA (siSCR). (F) Number of eYFPNeg satellite stem cells per myofiber at 42h of culture after transfection with siRNA against Aurka (siAurka) normalized to scrambled control siRNA (siSCR). (G) Number of asymmetric satellite stem cell divisions per myofiber at 42h of culture in EGF containing media after transfection with scrambled control siRNA (siSCR) or siRNA against Aurka (siAurka) normalized to control media after transfection with scrambled siRNA (siSCR). (D–F and G) Error bars represent means ±SEM; p-values: *=<0.05; **=<0.01; ***=<0.005. (D– F) n=3 mice; (G) n=3 mice.
Figure 6.
Figure 6.. EGF Stimulation Rescues Polarity Deficits in mdx Satellite Cells
(A) Signaling status of p-EGFR (green) in Pax7-expressing (red) and DAPI positive (blue) cells on mdx EDL myofibers at 1h culture in vehicle or EGF containing media. (B) Quantification of p-EGFR staining in mdx satellite cells on EDL myofibers fixed at 1h culture in vehicle or EGF containing media. (C) Quantification of abnormal, planar, and apicobasal orientated mitotic spindles and (D) Pard3 localization in satellite cells on mdx myofibers at 36h of culture in vehicle or EGF containing media. (E) Quantification of asymmetric divisions relative to total satellite stem cell divisions in WT and mdx myofibers at 42h of culture in vehicle or EGF containing media. (F) Number of asymmetric divisions per myofiber in WT and mdx myofibers at 42h of culture in vehicle or EGF containing media. (G) Quantification of Myog-expressing cells per mdx myofiber and (H) total myogenic cells (Pax7- or Myog-expressing cells) per mdx myofiber at 72h of culture in vehicle or EGF containing media. (I) Graphic overview of cardiotoxin-induced injury and treatment with recombinant EGF in mdx mice. (J) Quantification of Pax7-expressing and (K) Myog-expressing cells on sections from mdx TA muscles 10 days post injury treated with saline (vehicle), or recombinant EGF. (B–E and H–J) Error bars represent means ±SEM; p-values: *=<0.05; **=<0.01; ***=<0.005. (B) n=3 mice; (C, E-F) n=3 WT mice and 7 mdx mice; (D) n=3 mice, (G–H) n=3 WT and 5 mdx mice; (J–K) n=4 mice for each group.
Figure 7.
Figure 7.. EGF Enhances Regeneration of Dystrophin-Deficient Skeletal Muscle
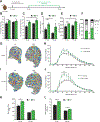
(A) Graphic overview of electroporation of EGF vector in mdx mice. (B) Muscle mass, (C) cross-sectional area, (D) quantification of Myog-expressing cells and (E) quantification of myofibers from TA muscles of mdx mice 30 or 150 days after electroporation with empty vector (Ev) or EGF expression vector (EGFv). (F) Proportion of branched myofibers isolated from electroporated EDLs of mdx mice 150 days after electroporation with Ev or EGFv. (G) Representative mask generated from SMASH analysis of cross sections of TA muscles and (H) size distribution of myofibers from TA muscles of mdx mice 30 days after electroporation with Ev or EGFv. (I) Representative mask generated from SMASH analysis of cross sections of TA muscles and (J) size distribution of myofibers from TA muscles of mdx mice 150 days after electroporation with Ev or EGFv. (K) Max tetanic force and (L) specific max force of TA muscles of mdx mice 30 or 150 days after electroporation with Ev or EGFv. Dpi: days post intervention; (B–K) Error bars represent means ±SEM; p-values: *=<0.05; **=<0.01; ***=<0.005. n=4 mice for each group at 30dpi and 3 mice for each group at 150dpi.

Similar articles

Cited by

References

    1. Anderson MS, and Kunkel LM (1992). The molecular and biochemical basis of Duchenne muscular dystrophy. Trends Biochem. Sci 17, 289–292. - PubMed
    1. Ando R, Ikegami H, Sakiyama M, Ooike S, Hayashi M, Fujino Y, Abe D, Nakamura H, Mishina T, Kato H, et al. (2010). 3-Cyano-6-(5-methyl-3-pyrazoloamino)pyridines: selective Aurora A kinase inhibitors. Bioorg. Med. Chem. Lett 20, 4709–4711. - PubMed
    1. Arsenio J, Metz PJ, and Chang JT (2015). Asymmetric Cell Division in T Lymphocyte Fate Diversification. Trends Immunol. 36, 670–683. - PMC - PubMed
    1. Bañón‐Rodríguez I, Gálvez‐Santisteban M, Vergarajauregui S, Bosch M, Borreguero Pascual A, and Martín‐Belmonte F (2014). EGFR controls IQGAP basolateral membrane localization and mitotic spindle orientation during epithelial morphogenesis. EMBO J. 33, 129–145. - PMC - PubMed
    1. Bell CD, and Conen PE (1968). Histopathological changes in Duchenne muscular dystrophy. J. Neurol. Sci 7, 529–544. - PubMed

Publication types

MeSH terms