. 2019 Mar 21;26(3):449-461.e8.
doi: 10.1016/j.chembiol.2018.12.002. Epub 2019 Jan 31.

Selective Disruption of Mitochondrial Thiol Redox State in Cells and In Vivo

Affiliations

Selective Disruption of Mitochondrial Thiol Redox State in Cells and In Vivo

Lee M Booty et al. Cell Chem Biol. .

Abstract

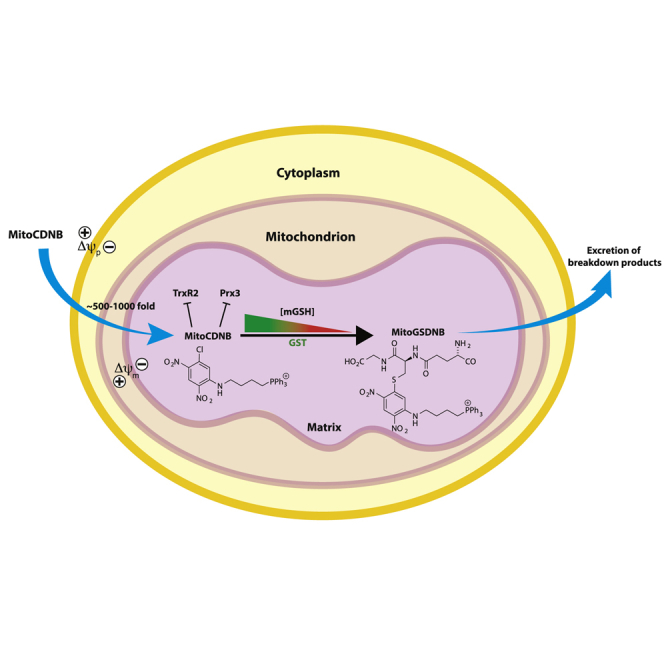
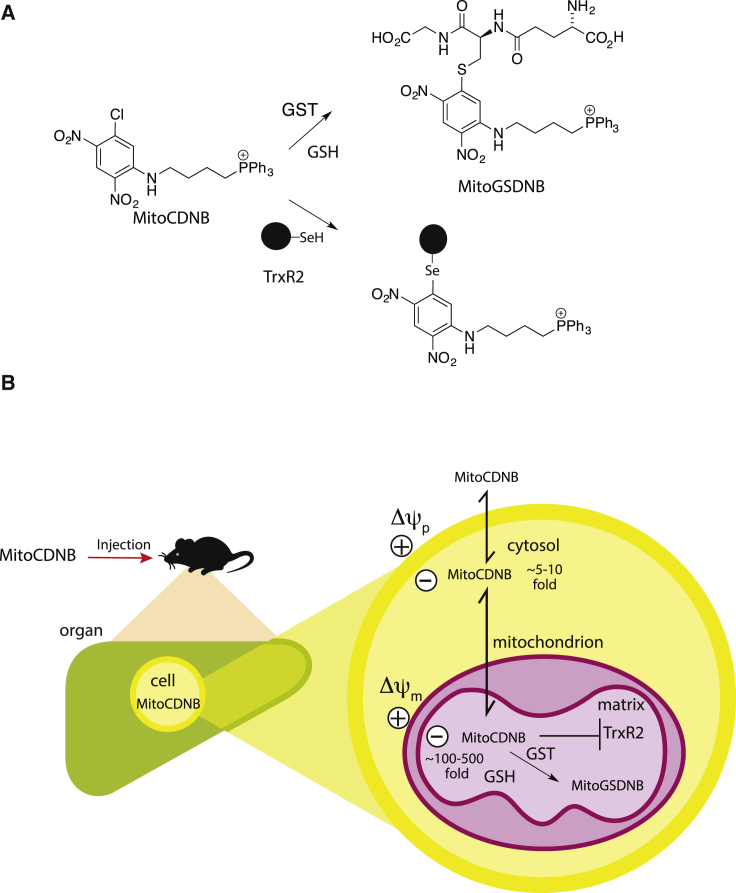
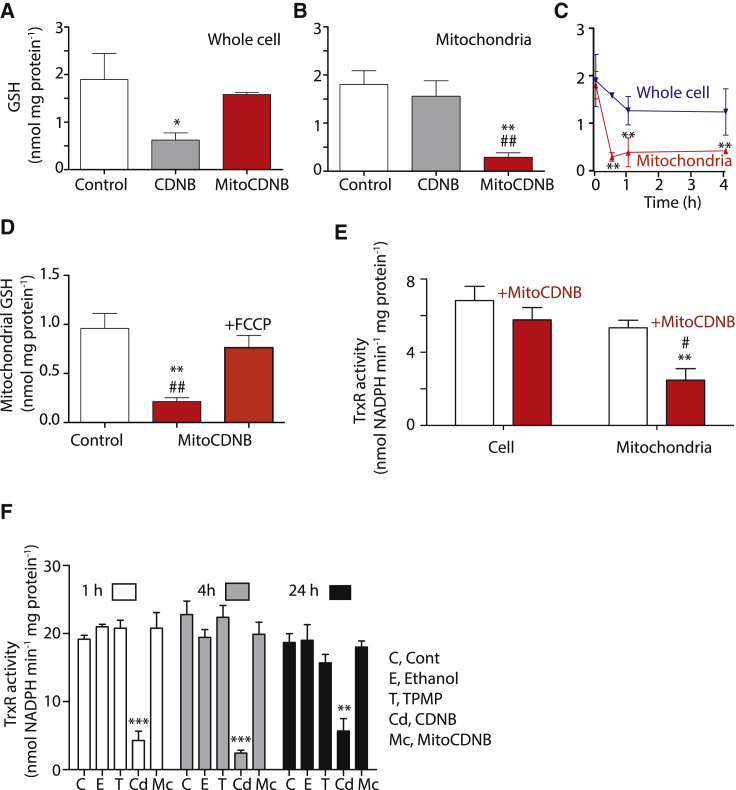
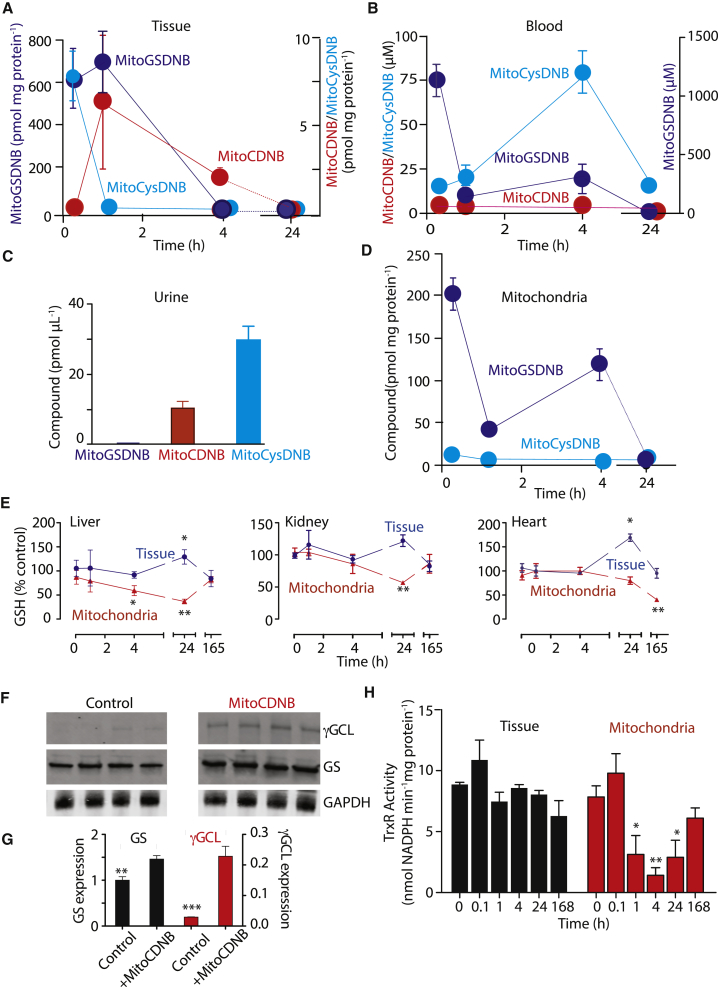
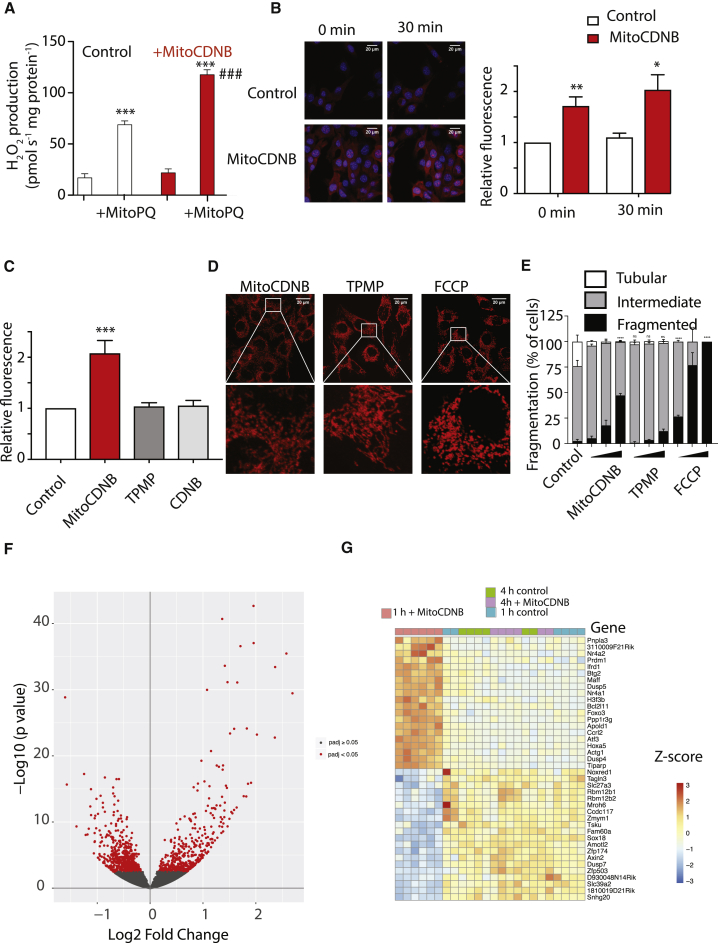
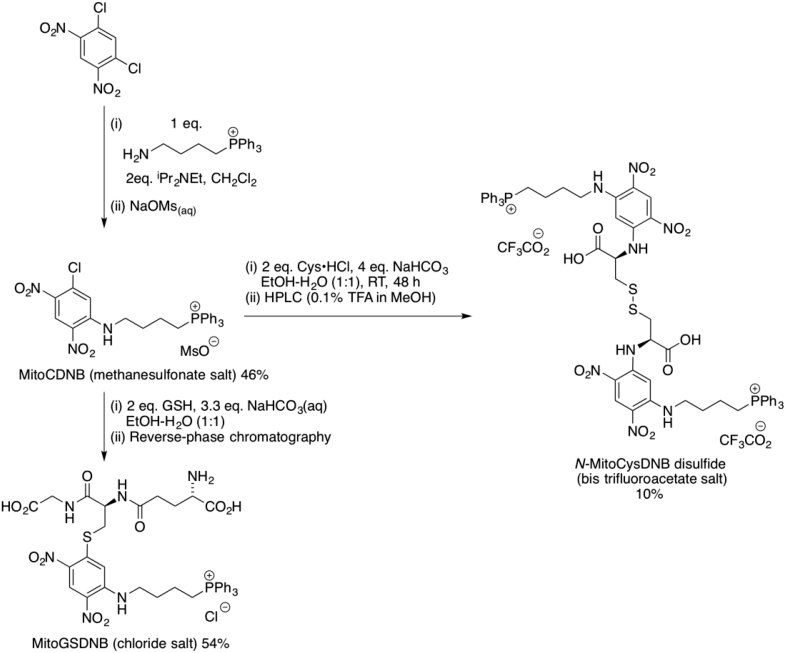
Mitochondrial glutathione (GSH) and thioredoxin (Trx) systems function independently of the rest of the cell. While maintenance of mitochondrial thiol redox state is thought vital for cell survival, this was not testable due to the difficulty of manipulating the organelle's thiol systems independently of those in other cell compartments. To overcome this constraint we modified the glutathione S-transferase substrate and Trx reductase (TrxR) inhibitor, 1-chloro-2,4-dinitrobenzene (CDNB) by conjugation to the mitochondria-targeting triphenylphosphonium cation. The result, MitoCDNB, is taken up by mitochondria where it selectively depletes the mitochondrial GSH pool, catalyzed by glutathione S-transferases, and directly inhibits mitochondrial TrxR2 and peroxiredoxin 3, a peroxidase. Importantly, MitoCDNB inactivates mitochondrial thiol redox homeostasis in isolated cells and in vivo, without affecting that of the cytosol. Consequently, MitoCDNB enables assessment of the biomedical importance of mitochondrial thiol homeostasis in reactive oxygen species production, organelle dynamics, redox signaling, and cell death in cells and in vivo.

Keywords: glutathione; mitochondria; mitochondria targeting; redox signaling; thiol redox state; thioredoxin.


Figures

None
Graphical abstract
Figure 1
Figure 1
Mode of Action of MitoCDNB (A) MitoCDNB reaction with GSH catalyzed by GST to form MitoGSDNB and deplete GSH. Inhibition of TrxR2 by MitoCDNB by alkylation of its active site selenol. (B) The mitochondria-targeting TPP of MitoCDNB leads to its selective accumulation within the mitochondrial matrix in vivo, driven by the plasma (Δψp) and mitochondrial (Δψm) membrane potentials. Within mitochondria the CDNB moiety is as a GST substrate to deplete GSH, and also a TrxR2 inhibitor. Thus MitoCDNB selectively disrupts mitochondrial thiol homeostasis through its effects on the GSH and Trx systems. See also Figure S1.
Figure 2
Figure 2
Reactivity of MitoCDNB In Vitro (A and B) GST-catalyzed reaction of MitoCDNB with GSH. (A) MitoCDNB (10 μM) was incubated ± GSH (1 mM) with GST-κ (10 μg) or mitochondrial matrix extract (100 μg protein), and absorbance at 328 nm measured. (B) MitoCDNB (10 μM) was incubated with GSH (1 mM) for 10 min alone (top), or with GST-κ (100 μg, bottom) and then analyzed by RP-HPLC at 220 nm (TPP, blue) and 328 nm (MitoGSDNB, red). Peak identities were confirmed by spiking with authentic compounds (Figure S2D). (C) Mass spectrometric analysis of MitoCDNB reaction with GSH. MitoCDNB was incubated with GSH (top) or with GSH + GST-κ (bottom) as in (B) above then analyzed by mass spectrometry. (D) Mammalian TrxR1 and TrxR2 inhibition by MitoCDNB. TrxR1 (25 μg) was incubated with MitoCDNB for 10 min and then assessed for TrxR1 activity. Inset: MitoCDNB inhibition of TrxR2 in matrix extracts (25 μg protein) from rat liver (L), heart (H), or kidney (K) mitochondria, incubated with 5 μM MitoCDNB (red) or vehicle (gray) for 5 min and then assessed for TxR2 activity (units = nmol NADPH min−1 mg protein−1). (E) Alkylation of TrxR1 by MitoCDNB. TrxR1 (20 μg) was incubated for 10 min with 20 μM MitoCDNB (MitoCDNB), 20 μM CDNB for 5 min followed by 20 μM MitoCDNB for 10 min (CDNB + MitoCDNB) or EtOH control (0.1%). Protein was then assessed by western blotting for TrxR1 (top) and reprobed with anti-TPP antiserum (bottom). (F) MitoCDNB uptake by mitochondria. An electrode sensitive to the TPP moiety of MitoCDNB was calibrated (5 × 1 μM MitoCDNB, red arrows). Liver mitochondria (2 mg protein/mL) were then added, followed by succinate (10 mM) and 1 μM FCCP. A representative trace is shown of three replicates. (G) Time dependence of MitoCDNB release from mitochondria upon uncoupling. Mitochondria were incubated with 10 μM MitoCDNB as in (F) and at the indicated times 1 μM FCCP or 5 μg/mL alamethicin was added. (H) RP-HPLC of mitochondrial MitoCDNB uptake. Liver mitochondria were incubated with 10 μM MitoCDNB as in (F): (i) with MitoCDNB for 9 min; (ii) with FCCP for 4 min followed by MitoCDNB for 5 min; (iii) with MitoCDNB and succinate for 5 min followed by FCCP for 4 min; (iv) with MitoCDNB and succinate for 5 min followed by alamethicin for 4 min. Mitochondria and supernatants (Figure S3C) were then analyzed by RP-HPLC. (I) Time dependence of uptake and transformation of MitoCDNB. Mitochondria were incubated with MitoCDNB as in (H) and then mitochondrial (top) and supernatant (bottom) fractions analyzed by RP-HPLC for MitoCDNB (red) or MitoGSDNB (blue). Peak areas are in a.u and the normalized sum of the peak areas is in black. Data are means ± SEM, N = 3. Traces are representative of >3 independent experiments. *p < 0.05, **p < 0.01, ***p < 0.001. See also Figures S2 and S3.
Figure 3
Figure 3
Impact of MitoCDNB on Mitochondrial GSH and TrxR (A) MitoCDNB depletes mitochondrial GSH. Liver mitochondria (2 mg protein/mL) were incubated with vehicle, MitoCDNB, CDNB, TPMP, or MitoGSDNB for 5 min, then matrix glutathione levels were determined. (B) Time course of GSH depletion. MitoCDNB (10 μM) or CDNB (10 μM) were incubated with mitochondria, then matrix glutathione levels determined. For some experiments FCCP (1 μM) was added prior to MitoCDNB or CDNB (dotted lines). (C) Inhibition of TrxR2 by MitoCDNB. Liver mitochondria (2 mg/mL) were incubated for 5 min with either carrier (white), MitoCDNB (10 μM, red), or CDNB (10 μM, blue). For some experiments FCCP (1 μM) was added before MitoCDNB (red, white) or CDNB (blue, white) for a further 5 min. (D and E) Uptake and metabolism of MitoCDNB by cells. HepG2 cells were incubated with MitoCDNB (10 μM) and then the MitoCDNB and MitoGSDNB in the cells (D) and medium (E) were quantified by LC-MS/MS. The sum of MitoCDNB and MitoGSDNB is indicated. (F) Schematic of MitoCDNB metabolism. MitoCDNB reacts with GSH to form MitoGSDNB in mitochondria. This is excreted and broken down by the extracellular γ-glutamyl transpeptidase (GGT) to MitoCysGlyDNB, further converted to S-MitoCysDNB, which undergoes a spontaneous Smiles rearrangement to N-MitoCysDNB, which autooxidizes to N-MitoCysDNB disulfide. (G) Generation of MitoCysDNB in HepG2 cells. MitoCysDNB levels were quantified in cells from (D) above and from media (E). Data are means ± SEM, N = 3. *p < 0.05, **p < 0.01, ***p < 0.001 relative to control; ##p < 0.01 relative to incubation without FCCP in (C) only. See also Figures S3 and S4.
Figure 4
Figure 4
Selective Mitochondrial GSH Depletion and TrxR2 Inactivation by MitoCDNB in Cells (A) Depletion of cell GSH. HepG2 cells were incubated for 1 hr with MitoCDNB (10 μM), CDNB (10 μM), or vehicle and cell GSH levels measured. (B) Mitochondrial GSH depletion in cells. HepG2 cells were incubated as in (A), mitochondria were then isolated and GSH measured. (C) Time course of GSH depletion by MitoCDNB. HepG2 cells were incubated as in (A) and total and mitochondrial GSH measured. (D) Effect of FCCP on mitochondrial GSH depletion. HepG2 cells were incubated for 1 hr with MitoCDNB (10 μM) alone, + FCCP (100 μM), or with vehicle, and mitochondrial GSH assessed. **p < 0.01 relative to control; ##p < 0.01 relative to FCCP. (E) Inhibition of TrxR2 by MitoCDNB in cells. HepG2 cells were incubated with vehicle or MitoCDNB (10 μM) for 4 hr. Total cell and mitochondrial extracts were assessed for TrxR activity. (F) Effect of MitoCDNB on cell TrxR activity. Cells were incubated with 10 μM TPMP, CDNB, MitoCDNB, or carrier, for 1, 4, or 24 hr and total cell TrxR activity measured. Data are means ± SEM, N = 4 (A–E) or 3 (F). *p < 0.5, **p < 0.01, ***p < 0.001 relative to control, or time = 0 (C); #p < 0.05, ##p < 0.01 relative to CDNB (B), FCCP (D) or cell + MitoCDNB (E). See also Figures S4 and S5.
Figure 5
Figure 5
Selective Depletion of Mitochondrial GSH and Inactivation of TrxR2 by MitoCDNB within Tissues In Vivo Mice were injected with MitoCDNB (5 mg/kg) and tissues harvested for analysis of total and mitochondrial GSH content, and for TrxR activity. (A) Liver levels of MitoCDNB and MitoGSDNB were quantified by LC-MS/MS. (B) Blood samples were analyzed for MitoCDNB, MitoGSDNB, and MitoCysDNB by LC-MS/MS. (C) Spot urines 24 hr after MitoCDNB injection were quantified for MitoCDNB, MitoGSDNB, and MitoCysDNB by LC-MS/MS. (D) Liver mitochondrial levels of MitoCDNB and MitoGSDNB were quantified by LC-MS/MS. (E) GSH depletion by MitoCDNB in vivo. Mitochondrial and whole tissue fractions from liver, heart, and kidney at various times after MitoCDNB injection. Data are a percentage of control mice culled at the same time. The levels of GSH in the whole tissue and mitochondria, respectively, were: liver = 30.56 ± 3.7, 3.71 ± 0.6; kidney = 1.71 ± 0.3, 2.14 ± 0.52; heart = 4.15 ± 0.54, 2.36 ± 0.1 (nmol GSH/mg protein). (F and G) Expression of γ-glutamylcysteine ligase (γGCL) and glutathione synthetase (GS). Mice were injected with MitoCDNB and 24 hr later liver levels of γGCL and GS were analyzed by western blot (F). Each lane is a separate mouse, and quantified relative to GAPDH (G). (H) Liver and mitochondrial fractions at indicated times after MitoCDNB injection were assessed for TrxR activity. Data are means ± SEM, N = 4 or 5 (E). *p < 0.05, **p < 0.01, ***p < 0.001 relative to control, time zero (H), or time-matched controls (E). See also Figure S6.
Figure 6
Figure 6
Selective Disruption of Mitochondrial Thiol Redox State Enhances Mitochondrial ROS Production, Mitochondrial Fragmentation, and Retrograde Signaling (A) MitoCDNB enhances mitochondrial H2O2 production. Heart mitochondria (70 μg protein) were incubated with MitoCDNB (10 μM) or vehicle for 10 min then MitoPQ (5 μM) or vehicle was added and H2O2 production measured for 5 min. Data are means ± SEM, N = 4. ***p < 0.001 relative to control; ###p < 0.001 relative to control + MitoPQ. (B) MitoCDNB effect on mitochondrial ROS production in cells by confocal microscopy. Representative maximum projections of ROS production measured by MitoSOX fluorescence in C2C12 myoblasts at 0 or 30 min after 5 μM MitoPQ addition. Myoblasts were incubated with MitoSOX (5 μM) and either 0.1% ethanol (control) or MitoCDNB (10 μM) for 10 min prior to MitoPQ addition. Red is oxidized MitoSOX and blue is DAPI nuclear staining. Scale bar, 20 μm. The graph is fold change relative to control. Data are means ± SEM, N = 3. *p < 0.05, **p < 0.01. (C) MitoCDNB effect on mitochondrial ROS production in cells assessed by flow cytometry. C2C12 cells were incubated with MitoSOX Red and treated with 0.1% ethanol (control), or 10 μM of MitoCDNB, TPMP or CDNB. Data are means ±SEM, N = 5. ***p < 0.001. (D) Representative maximum projection images of C2C12 myoblasts (upper panels). Cells were incubated with 1, 5, and 10 μM MitoCDNB, TPMP, or FCCP for 4 hr, and analyzed by confocal microscopy to visualize mitochondrial fragmentation. The lower panels expand the indicated sections of the upper panels. Images are representative of 3 independent experiments. Scale bars, 20 μm. (E) Quantification of mitochondrial morphology in C2C12 myoblasts assessed as in (D) after incubation with 1, 5, or 10 μM of MitoCDNB, TPMP, or FCCP. Mitochondrial morphology was assigned as tubular, intermediate or fragmented and presented as mean % of all cells ± SEM. Data are mean ± SEM from 3 independent experiments, 100 cells were counted for each condition. ***p < 0.001. (F and G) Effect of MitoCDNB on the mouse transcriptome. Mice (six in each condition) were administered MitoCDNB (5 mg/kg) or carrier and then the liver transcriptomes were analyzed by RNA sequencing 1 and 4 hr later. (F) Volcano plot of the significance of the transcriptional changes caused by MitoCDNB 1 hr after injection compared with control. (G) Heatmap of changes in expression for the 20 most upregulated and most downregulated genes 1 hr after MitoCDNB injection. See also Figure S6.
None

Comment in

Similar articles

Cited by

References

    1. Akerboom T.P.M., Sies H. Assay of glutathione, glutathione disulfide and glutathione mixed disulfides in biological samples. Methods Enzymol. 1981;113:373–382. - PubMed
    1. Arner E.S., Holmgren A. Physiological functions of thioredoxin and thioredoxin reductase. Eur. J. Biochem. 2000;267:6102–6109. - PubMed
    1. Arnér E.S.J., Björnstedt M., Holmgren A. 1-Chloro-2,4-dinitrobenzene (DNCB) is an irreversible inhibitor of human thioredoxin reductase: loss of thioredoxin disulfide reductase activity is accompanied by a large increase in NADPH oxidase activity. J. Biol. Chem. 1995;270:3479–3482. - PubMed
    1. Asin-Cayuela J., Manas A.R., James A.M., Smith R.A., Murphy M.P. Fine-tuning the hydrophobicity of a mitochondria-targeted antioxidant. FEBS Lett. 2004;571:9–16. - PubMed
    1. Baars A.J., Mukhtar H., Zoetemelk C.E., Jansen M., Breimer D.D. Glutathione S-transferase activity in rat and human tissues and organs. Comp. Biochem. Physiol. C. 1981;70:285–288. - PubMed

Publication types

MeSH terms