. 2019 Mar 5;29(3):769-783.e4.
doi: 10.1016/j.cmet.2019.01.003. Epub 2019 Jan 31.

Multiplexed In Situ Imaging Mass Cytometry Analysis of the Human Endocrine Pancreas and Immune System in Type 1 Diabetes

Affiliations

Multiplexed In Situ Imaging Mass Cytometry Analysis of the Human Endocrine Pancreas and Immune System in Type 1 Diabetes

Yue J Wang et al. Cell Metab. .

Abstract

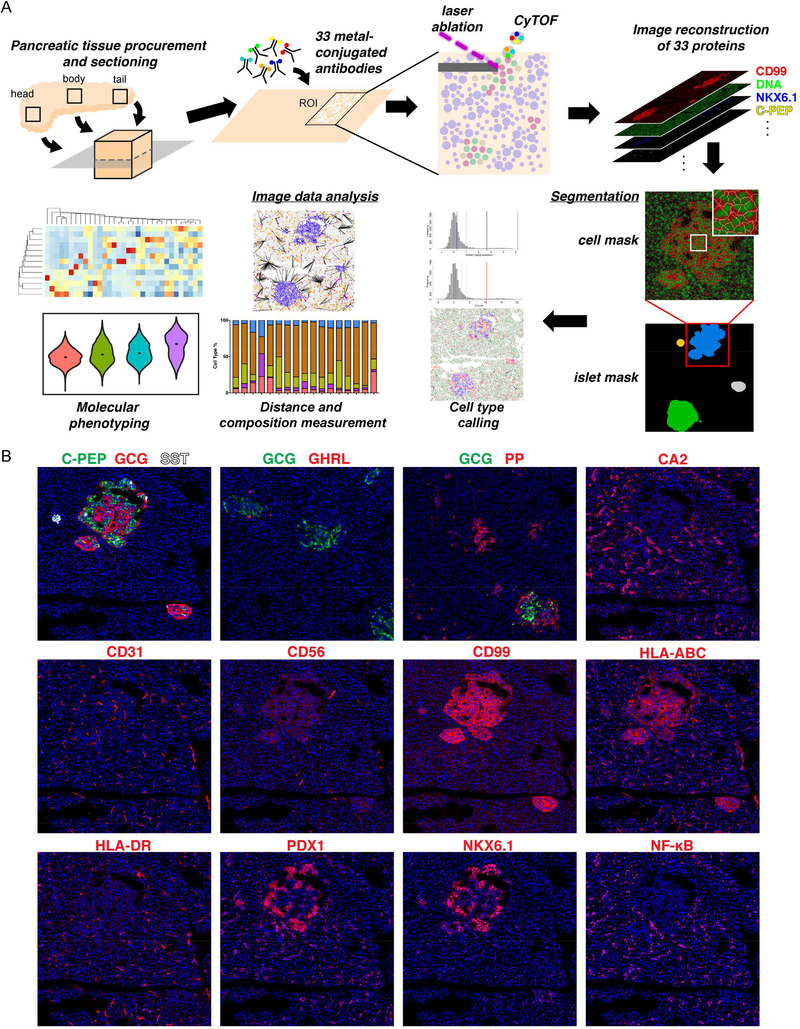
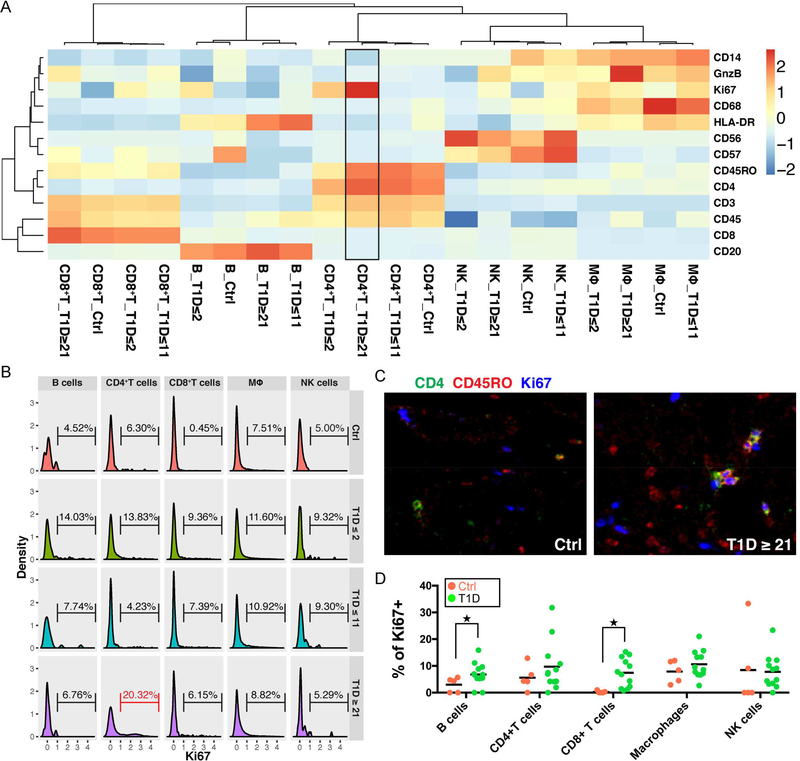
The interaction between the immune system and endocrine cells in the pancreas is crucial for the initiation and progression of type 1 diabetes (T1D). Imaging mass cytometry (IMC) enables multiplexed assessment of the abundance and localization of more than 30 proteins on the same tissue section at 1-μm resolution. Herein, we have developed a panel of 33 antibodies that allows for the quantification of key cell types including pancreatic exocrine cells, islet cells, immune cells, and stromal components. We employed this panel to analyze 12 pancreata obtained from donors with clinically diagnosed T1D and 6 pancreata from non-diabetic controls. In the pancreata from donors with T1D, we simultaneously visualized significant alterations in islet architecture, endocrine cell composition, and immune cell presentation. Indeed, we demonstrate the utility of IMC to investigate complex events on the cellular level that will provide new insights on the pathophysiology of T1D.

Keywords: T1D; histopathology; human pancreas; imaging; imaging mass cytometry; immune cell composition; immunolabeling; islet structure; multiplexed imaging; spatial information; type 1 diabetes.


Conflict of interest statement

DECLARATION OF INTERESTS

The authors declare that no conflicts of interest exist pertaining to the contents of this manuscript.

Figures

Figure 1.
Figure 1.
Workflow and antibody validation for imaging mass cytometry study of the human pancreas. See also Figures S1-S3 and Tables S1-S5. (A) Schema of the experimental platform. 4–8 μm FFPE sections of human pancreatic tissues are labeled simultaneously with 33 metal conjugated antibodies. 1000 μm x 1000 μm regions of interest (ROIs) around islets are selected for laser ablation. Plumes of particles are carried over to CyTOF for signal quantification. Antibody labeling patterns are reconstructed and output as 32-bit images. Islet-level and cell-level segmentation are performed to enable downstream image analyses. (B) Staining patterns of the newly developed metal-conjugated antibodies confirm their specificity. Displayed channels for each panel from top to bottom, left to right are: C-PEP (green)/GCG (red)/SST(white), GCG (green)/GHRL (red), GCG (green)/PP (red), CA2 (red), CD31 (red), CD56 (red), CD99 (red), HLA-ABC (red), HLA-DR (red), PDX1 (red), NKX6.1 (red), and NF-κB (red). Iridium-DNA staining is shown in blue in all panels. All panels are from the same ROI except GCG/GHRL and GCG/PP panels.
Figure 2.
Figure 2.
Architectural changes in islets of T1D donors. See also Figure S4. (A) Selected channel overlays for control donors and donors with different T1D durations. Islets from donors with T1D are smaller and exhibit rugged appearance (top panels). The ECM and vascular labeling of the same ROI is also shown (bottom panels). Displayed channels are: top, C-PEP (green), GCG (red), SST (blue), PP (yellow), and GHRL (cyan); bottom, type 1 collagen (COL, green), CD31 (red) and CD99 (blue). (B to G) Islet level quantifications for all pancreatic regions combined (B, D and F) or stratified by head, body and tail parts of the pancreata (C, E, and G). Individual islet measurements are used as input. Curves with red outline indicate statistical significance compared to non-diabetic controls with a p-value ≤ 0.05. Tests for linear mixed effects models are used for all statistical analyses. Vertical line from each plot represents population median. (B) Islet sizes are significantly reduced in patients with T1D regardless of disease duration. Density distributions of islet area are shown in natural logarithm scale. Statistics is calculated with area of islets in log scale as response and donor types (Ctrl, T1D≤2, T1D≤11 and T1D≥21) as categorical predictor. Individual donor effect is adjusted as random effect. Numbers of islets used for the analysis are: n=465 in control group, n=500 in T1D≤2 group, n=641 in T1D≤11 group and n=468 in T1D≥21 group. (C) Islet size quantification by anatomic locations. Statistics is calculated separately for the head, body and tail region of the pancreata following as in Figure 2B. Numbers of islets used for the analysis are: head, n=140 in control group, n=184 in T1D≤2 group, n=239 in T1D≤11 group and n=183 in T1D≥21 group; body, n=154 in control group, n=164 in T1D≤2 group, n=235 in T1D≤11 group and n=132 in T1D≥21 group; tail, n=171 in control group, n=152 in T1D≤2 group, n=167 in T1D≤11 group and n=153 in T1D≥21 group. (D) Intra-islet vascular density is significantly reduced in donors with recent onset diabetes (T1D≤2). Density of intra-islet vasculature is normalized to the vascular density of the exocrine tissue of the same ROI. Statistics is calculated as in Figure 2B, except that the relative vascular density in log scale is used as response variable. Numbers of islets used for the analysis are the same as in Figure 2B. (E) Intra-islet vascular density is reduced in the head region of the pancreata for all T1D donors. Statistics is calculated separately for different regions as in Figure 2D. Numbers of islets used for the analysis are the same as in Figure 2C. (F) Peri-islet collagen density is reduced in patients with medium duration of diabetes (T1D≤11). Statistics is calculated as in Figure 2B, except that the relative collagen area (collagen area divided by the corresponding islet peripheral area) is logit transformed and used as response variable. Numbers of islets used for the analysis are the same as in Figure 2B. (G) Peri-islet collagen density is reduced specifically in the head region of pancreata from patients with median duration of diabetes (T2D≤11). Statistics is calculated separately for different regions of the pancreas as in Figure 2F. Numbers of islets used for the analysis are the same as in Figure 2C.
Figure 3.
Figure 3.
Census of endocrine and immune cell composition in the human pancreata. See also Figure S5 and Table S6. (A) Quantification of the proportions of endocrine cell types for each donor. Numbers of endocrine cells in each ROI used for the analyses are shown in Table S6. Linear mixed effects model is used for statistical testing with logit transformed cell proportion as response and donor types as predictor. Individual donor effect is adjusted as random effect, with p ≤ 0.05 as significant cutoff. Comparison pairs that reach statistical significance include: proportions of beta cells in all T1D donors are significantly reduced compared with controls, proportion of alpha cells is significantly increased in T1D ≤ 2 donors compared with controls, and proportions of PP cells in T1D ≤ 11 and T1D ≥ 21 groups are significantly increased compared with controls. (B) Quantification of the proportions of endocrine cell types for each donor stratified by different regions of the pancreata. Numbers of endocrine cells in each ROI used for the analyses are shown in Table S6. Linear mixed effects model is used for statistical testing with logit transformed cell proportion as response and donor types together with tissue parts as predictors. Individual donor effect is adjusted as random effect, and p ≤ 0.05 is used as significant cutoff. Comparison pairs that reach statistical significance include: proportion of beta cells in the head is significantly reduced compared with body and tail parts of the pancreata, proportion of alpha cells in the head is significantly reduced compared with body and tail parts of the pancreata, proportion of PP cells in the head is significantly increased compared with body and tail parts. (C) Quantification of immune cells inside or within 20 μm from the edge of islets. Cell numbers are normalized to the total numbers of cells (immune + nonimmune) in the same area. Measurements from individual islet are used as input and listed in Table S6. Boxplots with red outline indicate significant cell density difference between T1D donors compared to controls. Statistical analyses are performed by linear mixed effects model with logit transformed cell density as response and donor types as predictor, with p ≤ 0.05 as significant cutoff. (D) Quantification of immune cells 20–70 μm distal to islets. Measurements from individual islet are used as input and listed in Table S6. Boxplots with red outline indicate significant cell density difference between T1D donors compared to controls. Statistical analysis is the same as in Figure 3C. (E) Representative IMC images exhibit immune cell presentation in control and T1D donors. Displayed channels are: CD3 (red), CD68 (green) and CD99 (blue).
Figure 4.
Figure 4.
Quantification of protein expressions at the cellular level in the human pancreas. See also Figure S6. (A) Heatmap demonstrates that endocrine cells from different donors cluster by their cell types and display canonical marker expression. Input data are mean levels of each protein in each cell type for each donor type. Values associated with each row of the heatmap are centered and standardized separately. Heatmap color indicates Z-score. (B) Violin plots summarize the relative expressions of C-PEP (left panel), PDX1 (middle panel), and NKX6.1 (right panel) in the beta cells from different donors. Measurements from individual beta cell are used as input. Dot inside each violin represents the location of the population median for Ctrl, T1D≤2, T1D≤11 groups and the expression of the one beta cell in the T1D≥21 group. Red outlines indicate statistical significance, tested by linear mixed effects model with individual protein expression as response and donor types as predictor. Individual donor effect is adjusted as random effect, and p ≤ 0.05 is set as significant cutoff. (C) Scatter plots display PDX1 versus NKX6.1 expression for all pancreatic endocrine and ductal cells. Each dot represents one cell. The same scatter plot is color coded by donor types (left panel), NF-Κb expression (middle-left panel), C-PEP expression (middle-right panel), and GCG expression (right panel). Four populations emerge based on different levels of PDX1 and NKX6.1 expression. Left panel, group 2 is enriched for cells from control donors (coral dots); while group 3 is enriched for cells from T1D donors (green, turquoise, and violet dots for cells from T1D≤2, T1D≤11 and T1D≥21 groups correspondingly). Middle-left panel, ductal cells are located in group 1, and are characterized by high NF-κB expression. Middle-right panel, beta cells are located in group 2 and have high C-PEP level. Right panel, group 3 cells have high GCG level, indicating their alpha-cell identity. Some of the alpha cells (identified by high GCG expression) also extend into Group 4 regions. (D) IMC data confirms the ectopic expression of NKX6.1 in alpha cells from T1D donors. Displayed channels are: GCG (green); NKX6.1 (red); C-PEP and SST (blue); PDX1 (white). The levels of NKX6.1 and PDX1 are separately adjusted for visualization in the control panel, due to the significant higher signals of these two channels in the islets from control donors. All panels are shown at 4× magnification.
Figure 5.
Figure 5.
Quantification of protein expressions in immune cells in the T1D pancreas. (A) Heatmap demonstrates that immune cells from different donors cluster by cell type and display canonical marker expression. CD4+T cells from patients with long duration diabetes (T1D≥2) have high Ki67 level (black box). Input data are mean levels of each protein in each cell type for each donor type. Values associated with each row of the heatmap are centered and standardized separately. Heatmap color indicates Z-score. (B) Percentage of Ki67+ cells in each cell type of different donor groups. CD4+T cells from T1D≥21 donors have the highest percentage of Ki67+ cells (red bracket). Ki67 values from each immune cell type for each donor type are used as input. (C) Proliferating CD4+T cells in the long duration diabetes donor (T1D≥21) display a memory phenotype. Displayed channels are: CD4 (green); CD45RO (red) and Ki67 (blue). All panels are shown at 5× magnification. (D) Quantification of percentage of proliferating cells in control and T1D donors. B cells and CD8+T cells show increased proliferation compared with controls. Each dot represents one donor. ★Indicates statistical significance based on Mann-Whitney test with p ≤ 0.05.
Figure 6.
Figure 6.
Pancreatic tissue from HPAP020 displays histopathological changes of very recent onset Type 1 Diabetes. (A) Selected channel overlays for ROIs consisting of islets with no beta cells (upper panels) or with beta cells (lower panels). Islets with remnant beta cells exhibit increased peri- and intra-islet accumulation of immune cells. Displayed channels are: left, C-PEP (green), GCG (red) and SST (blue); middle-left, CD99 (green), and CD45 (red); middle-right, CD4 (green), CD8 (red), CD20 (white) and GCG (blue); right, CD68 (green), CD45 (red) and CD56 (blue). Apart from being an NK-cell marker, CD56 also labels neurons and islets (right panels). (B) Quantification of immune cells proximal to islets (inside islets or within 20 μm halo extending from islets), stratified by islets with or without beta cells. Cell numbers are normalized to 1mm2 regions. Each dot represents one ROI. All ROIs are from the same donor HPAP020. Islets with beta cells have significantly higher numbers of B cells and CD8+ T cells in their immediate vicinity than those lacking beta cells. *, FDR < 10%, calculated from t-tests with multiple comparison correction. (C) Quantification of immune cells 20–70 μm distal to islets. Cell numbers are normalized to 1mm2 region. Each dot represents one ROI. All ROIs are from HPAP020. Halos surrounding Islets with beta cells have significantly higher number of CD8+ T cells than those lacking beta cells. *, FDR < 10%. Statistics is calculated as in Figure 6B. (D) Violin plots demonstrates that beta cells from HPAP020 have elevated expression of HLA-ABC compared with controls. HLA-ABC expressions of individual cell from HPAP020 or control donors are used as input. 2-way ANOVA with Tukey method is used for statistical testing, with FWER < 0.05. Compared with all the other cell types in HPAP020 and control donors, beta cells in HPAP020 (violin with red outline) have significantly higher level of HLA-ABC expression. (E) IMC data confirm the upregulation of HLA-ABC in this donor. Displayed channels are: HLA-ABC (green); GCG (red) and C-PEP (blue).

Comment in

References

    1. Ackermann AM, Moss NG and Kaestner KH (2018) GABA and Artesunate Do Not Induce Pancreatic alpha- to beta-Cell Transdifferentiation in Vivo. Cell Metabolism doi: 10.1016/j.cmet.2018.07.002 - DOI - PMC - PubMed
    1. American Diabetes Association (2009). Diagnosis and Classification of Diabetes Mellitus. Diabetes Care 33, S62–S69. - PMC - PubMed
    1. Angelo M, Bendall SC, Finck R, Hale MB, Hitzman C, Borowsky AD, Levenson RM, Lowe JB, Liu SD, Zhao S, et al. (2014). Multiplexed ion beam imaging of human breast tumors. Nat. Med 20, 436–442. - PMC - PubMed
    1. Asadi A, Bruin JE, and Kieffer TJ (2015). Characterization of Antibodies to Products of Proinsulin Processing Using Immunofluorescence Staining of Pancreas in Multiple Species. J. Histochem. Cytochem 63, 646–662. - PMC - PubMed
    1. Atkinson MA (2014). Pancreatic biopsies in type 1 diabetes: revisiting the myth of Pandora’s box. Diabetologia 57, 656–659. - PMC - PubMed

Publication types

MeSH terms