

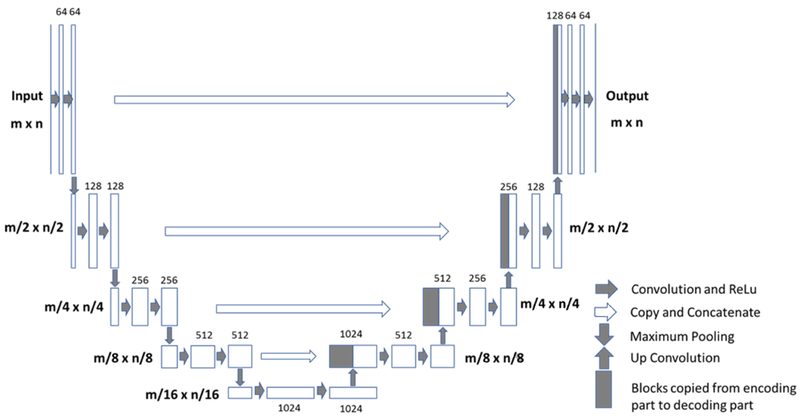
Automatic Breast and Fibroglandular Tissue Segmentation in Breast MRI Using Deep Learning by a Fully-Convolutional Residual Neural Network U-Net
- PMID: 30713130
- PMCID: PMC6669125
- DOI: 10.1016/j.acra.2019.01.012
Automatic Breast and Fibroglandular Tissue Segmentation in Breast MRI Using Deep Learning by a Fully-Convolutional Residual Neural Network U-Net
Abstract
Rationale and objectives: Breast segmentation using the U-net architecture was implemented and tested in independent validation datasets to quantify fibroglandular tissue volume in breast MRI.
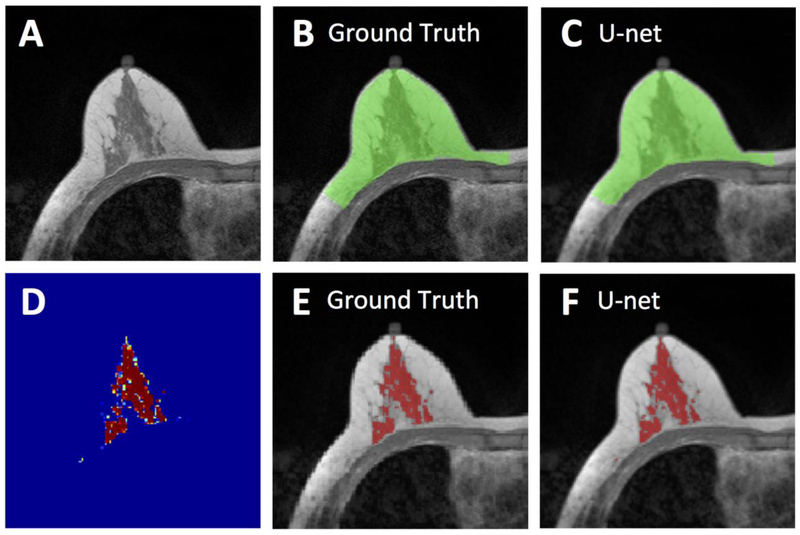
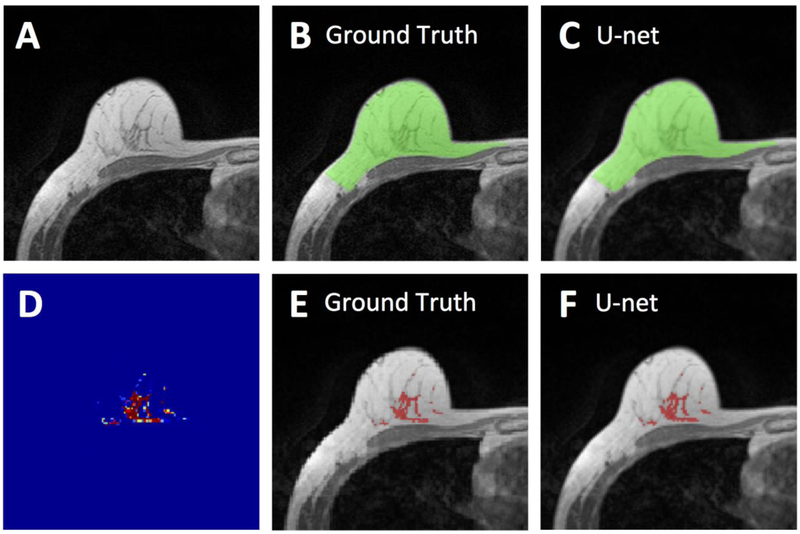
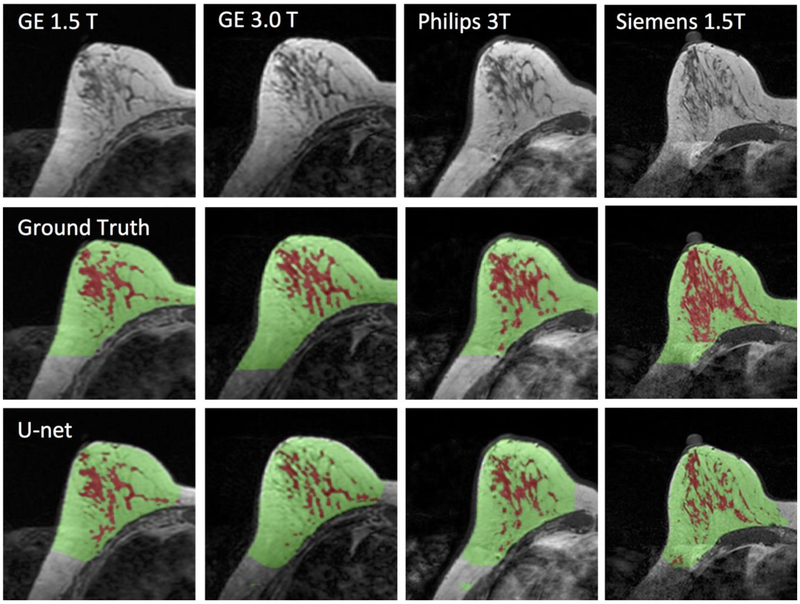
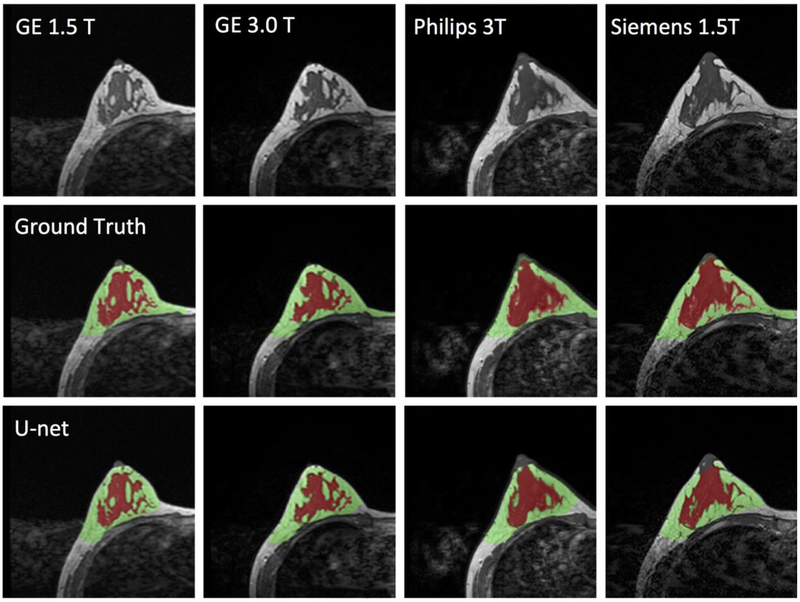
Materials and methods: Two datasets were used. The training set was MRI of 286 patients with unilateral breast cancer. The segmentation was done on the contralateral normal breasts. The ground truth for the breast and fibroglandular tissue (FGT) was obtained by using a template-based segmentation method. The U-net deep learning algorithm was implemented to analyze the training set, and the final model was obtained using 10-fold cross-validation. The independent validation set was MRI of 28 normal volunteers acquired using four different MR scanners. Dice Similarity Coefficient (DSC), voxel-based accuracy, and Pearson's correlation were used to evaluate the performance.
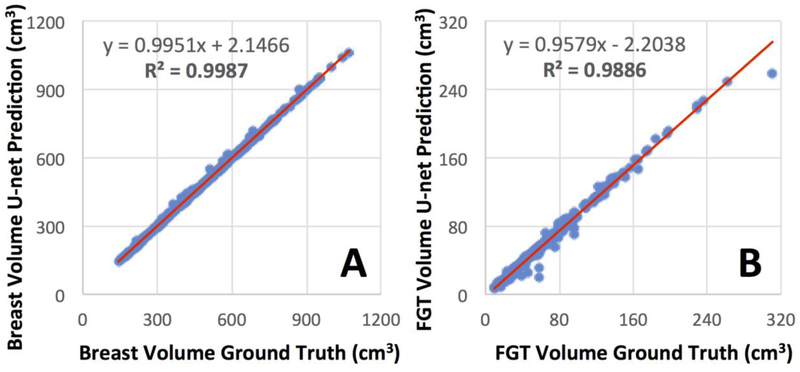
Results: For the 10-fold cross-validation in the initial training set of 286 patients, the DSC range was 0.83-0.98 (mean 0.95 ± 0.02) for breast and 0.73-0.97 (mean 0.91 ± 0.03) for FGT; and the accuracy range was 0.92-0.99 (mean 0.98 ± 0.01) for breast and 0.87-0.99 (mean 0.97 ± 0.01) for FGT. For the entire 224 testing breasts of the 28 normal volunteers in the validation datasets, the mean DSC was 0.86 ± 0.05 for breast, 0.83 ± 0.06 for FGT; and the mean accuracy was 0.94 ± 0.03 for breast and 0.93 ± 0.04 for FGT. The testing results for MRI acquired using four different scanners were comparable.
Conclusion: Deep learning based on the U-net algorithm can achieve accurate segmentation results for the breast and FGT on MRI. It may provide a reliable and efficient method to process large number of MR images for quantitative analysis of breast density.
Keywords: Breast segmentation; Deep learning; U-net algorithm; breast MRI.
Copyright © 2019 The Association of University Radiologists. Published by Elsevier Inc. All rights reserved.
Figures


References
-
- Ram S, Sarma N, López JE, Liu Y, Li C-S, Aminololama-Shakeri S. Impact of the California Breast Density Law on Screening Breast MR Utilization, Provider Ordering Practices, and Patient Demographics. Journal of the American College of Radiology 2018;15(4):594–600. - PubMed
-
- Kuhl CK, Schrading S, Strobel K, Schild HH, Hilgers R-D, Bieling HB. Abbreviated breast magnetic resonance imaging (MRI): first postcontrast subtracted images and maximum-intensity projection—a novel approach to breast cancer screening with MRI. Journal of Clinical Oncology 2014;32(22):2304–2310. - PubMed
Publication types
MeSH terms
Grants and funding
LinkOut - more resources
Full Text Sources
Other Literature Sources
Medical
