. 2018 Nov 1:374:314-344.
doi: 10.1016/j.ccr.2018.07.010. Epub 2018 Jul 31.

Detection and identification of solids, surfaces, and solutions of uranium using vibrational spectroscopy

Affiliations

Detection and identification of solids, surfaces, and solutions of uranium using vibrational spectroscopy

Grace Lu et al. Coord Chem Rev. .

Abstract

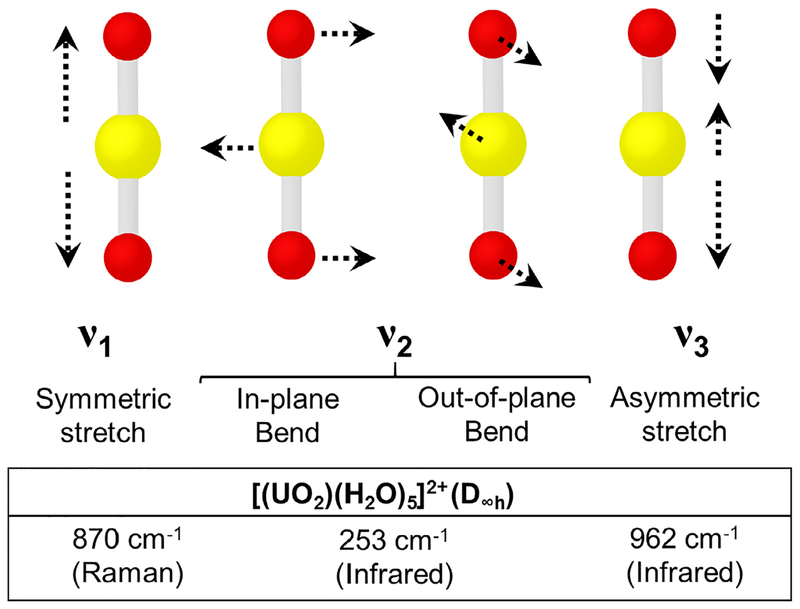
The purpose of this review is to provide an overview of uranium speciation using vibrational spectroscopy methods including Raman and IR. Uranium is a naturally occurring, radioactive element that is utilized in the nuclear energy and national security sectors. Fundamental uranium chemistry is also an active area of investigation due to ongoing questions regarding the participation of 5f orbitals in bonding, variation in oxidation states and coordination environments, and unique chemical and physical properties. Importantly, uranium speciation affects fate and transportation in the environment, influences bioavailability and toxicity to human health, controls separation processes for nuclear waste, and impacts isotopic partitioning and geochronological dating. This review article provides a thorough discussion of the vibrational modes for U(IV), U(V), and U(VI) and applications of infrared absorption and Raman scattering spectroscopies in the identification and detection of both naturally occurring and synthetic uranium species in solid and solution states. The vibrational frequencies of the uranyl moiety, including both symmetric and asymmetric stretches are sensitive to the coordinating ligands and used to identify individual species in water, organic solvents, and ionic liquids or on the surface of materials. Additionally, vibrational spectroscopy allows for the in situ detection and real-time monitoring of chemical reactions involving uranium. Finally, techniques to enhance uranium species signals with vibrational modes are discussed to expand the application of vibrational spectroscopy to biological, environmental, inorganic, and materials scientists and engineers.

Keywords: Infrared; Raman; Uranium; Vibrational spectroscopy.


Figures

Fig. 1.
Fig. 1.
Vibrational modes for the [UO2]2+ cation and frequencies for the [UO2(H2O)5]2+ species. The uranyl pentaqua species in the D∞h point group typically serves as a benchmark for determining a red of blue shift of these uranyl vibrational modes.
Fig. 2.
Fig. 2.
Raman analysis of the uranyl window for uranyl nitrate (solid) including (A) raw, (B) -second derivative and barcode, and (C) analyzed Raman data.
Fig. 3.
Fig. 3.
Box and whisker plot that describes the median (solid vertical line within box), range (whiskers), and mean (x) values of symmetric stretching frequencies for uranyl mineral phases and inorganic compounds with extended topologies. Values are from the literature as summarized in Table 2.
Fig. 4.
Fig. 4.
a) The autunite sheet topology contains uranyl square bipyramids (yellow polyhedra) connected to phosphate tetrahedra (green polyhedra) through shared vertices. The cation to uranyl oxo atom distance associated with (b) saleeite (Mg(II)), (c) autunite (Ca(II)), and (d) torbernite (Cu(II)) are related to the trends in the uranyl symmetric stretching mode within the Raman spectra.
Fig. 5.
Fig. 5.
Comparison of solid-state Raman spectra for (A) phosphuranylite (solid black – R130108, dashed blue – R110155) and (B) autunite (solid black – R050612, dashed blue – R060434, dotted green – R060476). Spectral intensities were normalized to the highest energy bands near 840 cm−1.
Fig. 6.
Fig. 6.
Analysis of phosphuranylite spectral data in the form of Raman (A) – second derivative spectra with barcodes and (B) spectra (+ fitting) for (1) R110155 (blue) and (2) R130108 (black). Data are offset for clarity.
Fig. 7.
Fig. 7.
Box and whisker plot for well-defined uranyl coordination complexes that describes the median (solid vertical line within box, range (whiskers), and mean (x) values for the uranyl symmetric stretching mode (ν1). The X in UO2(NO3)2X2, UO2F2X2 and UO2(O2)Xn represents substitution by a range of O- and N-donor ligands. Uranyl phosphonates and O donors (both isolated molecular species and coordination polymers with ligands containing carboxylate, oxalate, or ketones) were not included in this plot due to the diversity of coordination modes and ligands within these groups of compounds. Frequencies for all uranyl coordination complexes and polymers can be found in Table 2.
Fig. 8.
Fig. 8.
The least squares regression for (a) all uranyl tetrachloro compounds and (b) excluding densely packed solids and less resolved crown-ether compounds.
Fig. 9.
Fig. 9.
Investigations by Lu et al.[48] utilized Raman spectroscopy to explore the presence of uranyl carbonate and hydroxide phases in aqueous solutions and related these values to the calculated equilibrium diagram. Slow kinetics resulted in initial differences between spectral analysis and predicted values. Reprinted with permission from Ref. [49]. Copyright 2016 American Chemical Society.
Fig. 10.
Fig. 10.
Raman spectra of (A) uranyl in 0.5 M Na2CO3 with 1.0 M H2O2 at pH 11.4, and (B) uranyl in 0.5 M Na2CO3 at pH 10.8. Vibrational frequency of uranyl species: (1) 848 (UO2(O2)22), (2) 811 (UO2(CO3)34), (3) 769 (UO2(O2)(CO3)24), and (4) 727 (UO2(CO3)x(OH)y22x2y) cm−1. Figure is reprinted with permission from Ref. [171]. Copyright 2012 American Chemical Society.
Fig. 11.
Fig. 11.
Raman spectra of aqueous solutions at pH 3, 5, 7, and 9 containing [UO22+]:[C6H5O73] in the ratio of (a) 1:1 and (b) 1:2 indicate a shift from a dominant dimeric species to a trimer with increasing pH. Peaks were normalized based upon the NO3 peak at 1047 cm−1, and the dashed line indicates the expected vibrational frequency from [(UO2) (H2O)5]2+. Vibrational frequencies of uranyl citrates are (1) 825 ((UO2)2(C6H5O7)22), (2) 800 ((UO2)3(C6H5O7)33), and 790 ((UO2)3(C6H5O7)2) cm−1. Reprinted from Ref. [16] with permission from The Royal Society of Chemistry.
Fig. 12.
Fig. 12.
Previously reported uranyl species and asymmetric stretching frequencies (v3) for isolated aqueous and surface complexes and extended solid-state precipitates on metal (M) oxides (O). The pH for all reported studies range from 5 to 8 and the surface state is depicted as O atoms for simplicity. Data based upon Refs. [,,,,,–227].
Fig. 13.
Fig. 13.
Detect and identify uranium species in aqueous solution including 30 mM UO2(NO3)2 and 105 mM Na2CO3 at pH (1) 3, (2) 11, (3) 6 (24 h), and (4) 6 (12 days). (A) Collected normal Raman spectra, (B) barcode, and (C) spectral peak fitting analyses and experiment conditions: excitation wavelength λex = 785 nm; tint = 20 s; P = 80 mW, and 10 averages. Uranium vibrational frequencies: 871 (UO22+), 859 (UO2)2OH3+), 853 ((UO2)2(OH)22+), 836 (UO2(CO3)22), and 814 (UO2(CO3)34).cm−1. Reprinted with permission from Ref. [49]. Copyright 2016 American Chemical Society.
Fig. 14.
Fig. 14.
Thermal decomposition of uranyl peroxide, UO4·4H2O, is monitored by Raman spectroscopy from 30 to 500 °C. The vibrational frequencies of symmetric stretching of U—O are (1) 863, (2) 828, and (3) 818 cm−1. Vibrational frequency of peroxide anion is centered at 748 cm−1 at 120 °C and (4) 675 cm−1 at 400 °C. Figure is reproduced with permission from Ref. [254]. Copyright 2017 Elsevier.
Fig. 15.
Fig. 15.
In situ Raman spectra of the oxidation of UO2 (458 cm−1) to U3O8 (756 cm−1) by injecting H2O vapor ranging from 0, 1, 2, and 3 mL. Inset shows the increase of 756 cm−1 (U3O8) band increases with the volume of H2O. Experiment condition: excitation wavelength λex = 488 nm; integration time: 20 s. Figure is reproduced with permission from Ref. [67]. Copyright 2005 Elsevier.
Fig. 16.
Fig. 16.
(A) Resonance Raman spectrum of Cs2UO2Cl4 in DMSO. Experiment condition: excitation wavelength λex = 528.7 nm. Vibrational frequencies: 830 cm−1 (UO2Cl42) and 1044.1 cm−1 (DMSO). (B) Magnified spectra of Fig. 5A from 1200 to 700 cm−1. Experiment condition: excitation wavelength λex = (1) 484.5 and (2) 528.7 nm. Figure is reproduced with permission from Ref. [264]. Copyright 2001 Elsevier.
Fig. 17.
Fig. 17.
(A) Normal Raman spectrum of 5 mM uranyl acetate and (B) SERS spectra of 10 μM of uranyl acetate on silver doped reduced graphene oxide nanosheets. Figure is reprinted with permission from Ref. [272] Copyright 2013 American Chemical Society.

References

    1. Lide DR, in: CRC Handbook of Chemistry and Physics, Taylor & Francis Group, Boca Raton, FL, 2008.
    1. Choppin G, Liljenzin J-O, Rydberg J, Ekberg C, Radiochemistry and Nuclear Chemistry, fourth ed., Academic Press, Oxford, 2013.
    1. Bruno J, Ewing RC, Elements 2 (2006) 343–349.
    1. Macfarlane AM, Ewing RC, in: Uncertainty Underground, MIT Press, Cambridge, MA, 2006.
    1. Abdelouas A, Elements 2 (2006) 335–341.

LinkOut - more resources