Clinical Trial
. 2019 Jan 18:9:3175.
doi: 10.3389/fimmu.2018.03175. eCollection 2018.

A Novel Vaccine Strategy Employing Serologically Different Chimpanzee Adenoviral Vectors for the Prevention of HIV-1 and HCV Coinfection

Affiliations
Clinical Trial

A Novel Vaccine Strategy Employing Serologically Different Chimpanzee Adenoviral Vectors for the Prevention of HIV-1 and HCV Coinfection

Felicity Hartnell et al. Front Immunol. .

Abstract

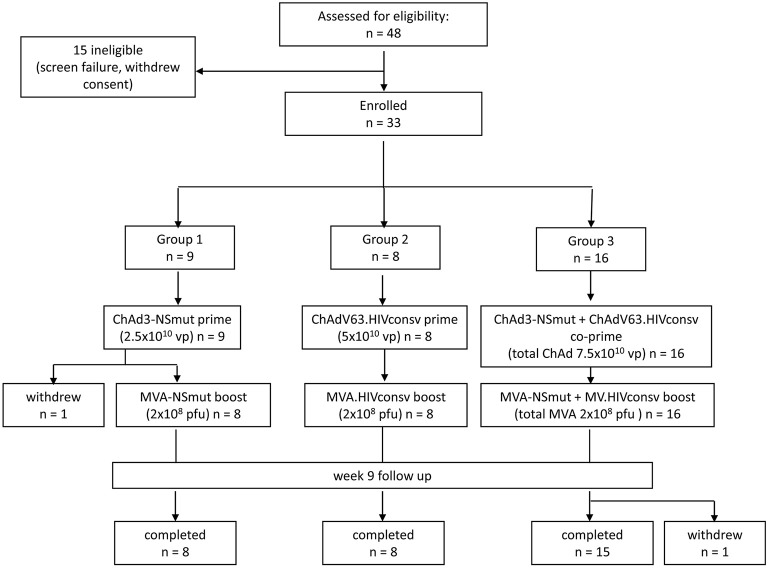
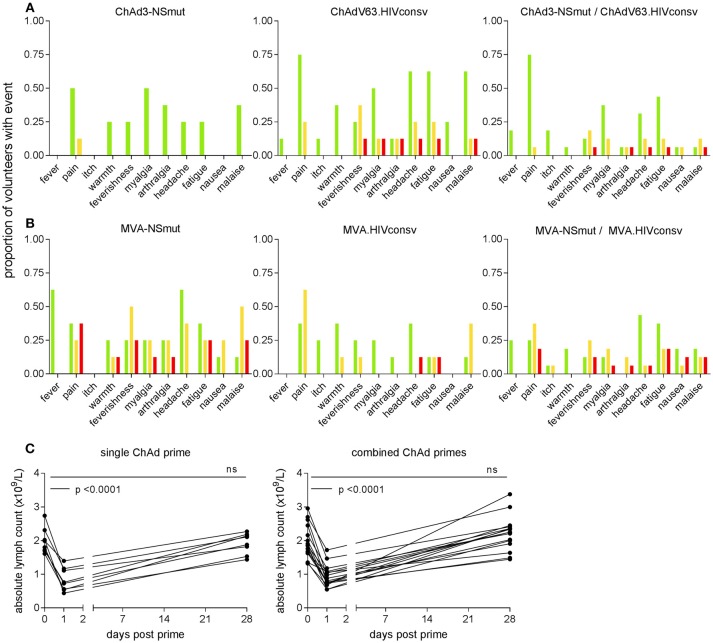
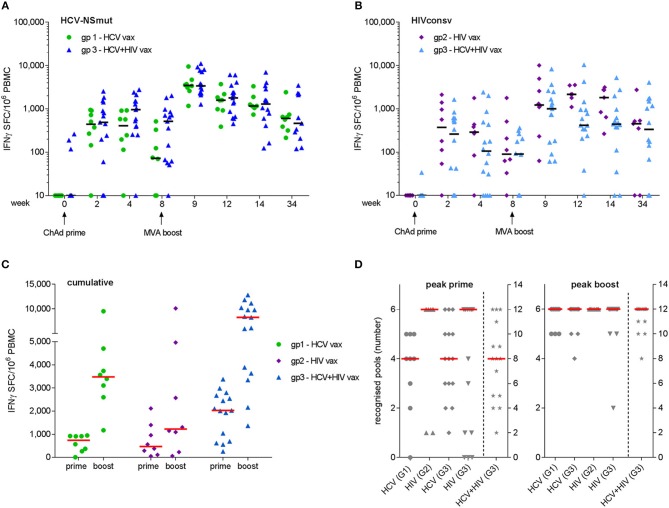
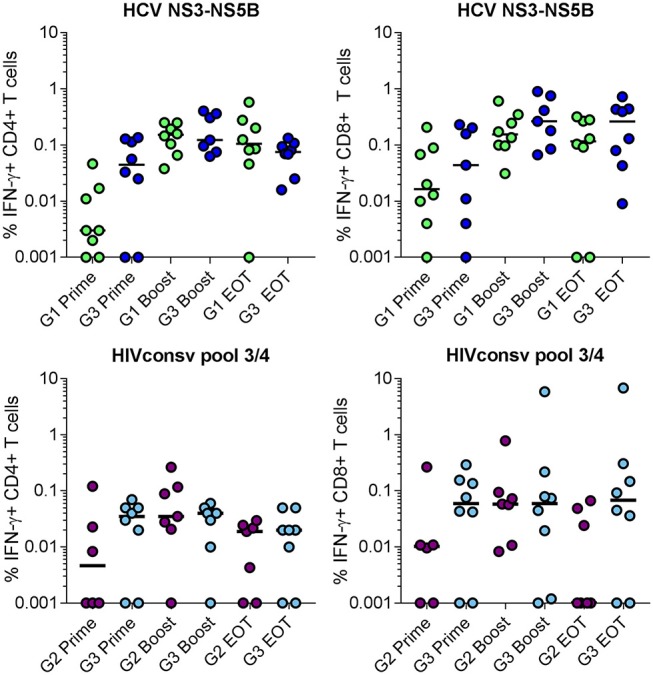
Background: Nearly 3 million people worldwide are coinfected with HIV and HCV. Affordable strategies for prevention are needed. We developed a novel vaccination regimen involving replication-defective and serologically distinct chimpanzee adenovirus (ChAd3, ChAd63) vector priming followed by modified vaccinia Ankara (MVA) boosts, for simultaneous delivery of HCV non-structural (NSmut) and HIV-1 conserved (HIVconsv) region immunogens. Methods: We conducted a phase I trial in which 33 healthy volunteers were sequentially enrolled and vaccinated via the intramuscular route as follows: 9 received ChAd3-NSmut [2.5 × 10¹⁰ vp] and MVA-NSmut [2 × 10⁸ pfu] at weeks 0 and 8, respectively; 8 received ChAdV63.HIVconsv [5 × 10¹⁰ vp] and MVA.HIVconsv [2 × 10⁸ pfu] at the same interval; 16 were co-primed with ChAd3-NSmut [2.5 × 10¹⁰ vp] and ChAdV63.HIVconsv [5 × 10¹⁰ vp] followed at week 8 by MVA-NSmut and MVA.HIVconsv [both 1 × 10⁸ pfu]. Immunogenicity was assessed using peptide pools in ex vivo ELISpot and intracellular cytokine assays. Vaccine-induced whole blood transcriptome changes were assessed by microarray analysis. Results: All vaccines were well tolerated and no vaccine-related serious adverse events occurred. Co-administration of the prime-boost vaccine regimens induced high magnitude and broad T cell responses that were similar to those observed following immunization with either regimen alone. Median (interquartile range, IQR) peak responses to NSmut were 3,480 (2,728-4,464) and 3,405 (2,307-7,804) spot-forming cells (SFC)/106 PBMC for single and combined HCV vaccinations, respectively (p = 0.8). Median (IQR) peak responses to HIVconsv were 1,305 (1,095-4,967) and 1,005 (169-2,482) SFC/106 PBMC for single and combined HIV-1 vaccinations, respectively (p = 0.5). Responses were maintained above baseline to 34 weeks post-vaccination. Intracellular cytokine analysis indicated that the responding populations comprised polyfunctional CD4+ and CD8+ T cells. Canonical pathway analysis showed that in the single and combined vaccination groups, pathways associated with antiviral and innate immune responses were enriched for upregulated interferon-stimulated genes 24 h after priming and boosting vaccinations. Conclusions: Serologically distinct adenoviral vectors encoding HCV and HIV-1 immunogens can be safely co-administered without reducing the immunogenicity of either vaccine. This provides a novel strategy for targeting these viruses simultaneously and for other pathogens that affect the same populations. Clinical trial registration: https://clinicaltrials.gov, identifier: NCT02362217.

Keywords: HCV (hepatitis C virus); HIV-1; clinical trial; coadministration; conserved region; non-structural protein (NS); transcriptomics analysis; vaccine.


Figures

Figure 1
Figure 1
Consort flow diagram showing enrolment and follow-up in the PEACHI 04 trial.
Figure 2
Figure 2
Frequency of local and systemic adverse events recorded by volunteers on diary cards. The proportion of volunteers reporting symptoms at any time during 72 h following (A) ChAd- and (B) MVA-vectored vaccines is shown on the y axis. Color code indicates maximum severity of the reaction reported: green—Grade 1 (mild); yellow—Grade 2 (moderate); red—Grade 3 (severe). (C) Peripheral blood lymphocyte counts were measured on day 1 in 23 subjects (two in Group 1 and five in Group 2, shown as single ChAd prime; 16 in Group 3, combined ChAd primes). Respective lymphocyte counts on days 0 and 28 are shown for comparison. By day 28, counts had returned to baseline values.
Figure 3
Figure 3
Frequency of antigen-specific T cells as determined by fresh ex vivo IFN-γ ELISpot assays. Mock-subtracted values are shown. Summed responses to peptide pools spanning (A) NSmut in Group 1 (green) and Group 3 (blue) volunteers and (B) HIVconsv in Group 2 (purple) and Group 3 (light blue) volunteers. Black horizontal bars indicate median values. (C) Cumulative responses (sum of NSmut and HIVconsv) in Group 3 subjects are compared with responses to the same immunogens when administered as a single regimen. (D) Breadth (number of peptide pools eliciting a positive response) at the time of the peak response to priming and boosting vaccinations. Group 3 (G3) values in right hand columns indicate the sum of HCV and HIV pools recognized. For (C,D), red bars indicate median values.
Figure 4
Figure 4
Breadth and specificity of antigen-specific T cell responses as determined by ex vivo IFN-γ ELISpot assays: each bar shows the contribution of individual peptide pools to the total response to the NSmut (red shades) and HIVconsv (blue shades) immunogens at the peak of the response after boosting vaccinations. Although the peak response was most frequently observed at day 63, the day 84 or 98 response is shown for the few individuals with a later peak, to illustrate the maximal breadth of individual responses. (A) Individual subjects are shown, indicated by trial identifier on x axis; (B) mean values per group.
Figure 5
Figure 5
Frequency of total antigen-specific IFN-γ+ cells within (left) CD4+ and (right) CD8+ T populations in volunteers in Groups 1 and 3 (NSmut vaccines, top panels) and Groups 2 and 3 (HIVconsv vaccines, bottom panels) after priming, boosting and at the end of trial (EOT) as determined by intracellular cytokine staining of cryopreserved PBMC. Zero values were arbitrarily assigned a value of 0.001 to enable display on a log10 scale. Horizontal lines indicate median values. Groups were compared using Kruskall-Wallis test; no statistically significant differences were found.
Figure 6
Figure 6
Neutralizing antibody titres to ChAd3 (A,B) and ChAd63 (D,E) measured in serum on day 0, week 4, and week 34 (end of trial) in volunteers receiving single (left) and combined (middle) vaccination regimens. Horizontal dotted line indicates assay cut-off (titer of 18). Correlation analysis (Spearman) for pre-vaccination vector-specific nAb titres and magnitude of the respective total transgene-specific T cell responses at W4 are shown in (C,F).
Figure 7
Figure 7
(A) Venn diagrams showing the proportion of genes that were significantly differentially expressed on days 1 and 57, i.e., 24 h post-prime and post-boost vaccination, respectively, with data from the HCV003 trial participants (ChAd3-NSmut/MVA-NSmut, L. Swadling, personal communication) included for comparison with Groups 2 and 3. (B) Volcano plots illustrate the numbers of the differentially expressed genes 24 h after vaccination. Red dots—genes significantly downregulated; blue dots—significantly upregulated).
Figure 8
Figure 8
(A) Canonical pathway analysis modulated by differentially expressed genes (DEGs) that were upregulated 24 h post each vaccine administration: left panels—ChAd-vectored vaccines; right panels—MVA-vectored vaccines. The biological processes are depicted from DEGs in whole blood. The pathways are indicated on the y axis, and the x axis shows the significance score (negative log10 of p-value calculated using Fisher exact test). (B) Heatmap depicting expression of genes involved in locomotion (GO: 0040012), which are correlated with lymphocyte count decline on day 1. Groups 2 and 3 are shown separately but were pooled for statistical analysis as the change in lymphocyte count was similar in the two groups.

References

    1. The Polaris Observatory HCV Collaborators Global prevalence and genotype distribution of hepatitis C virus infection in 2015: a modelling study. Lancet Gastroenterol Hepatol. (2017) 2:161–76. 10.1016/S2468-1253(16)30181-9 - DOI - PubMed
    1. Stanaway JD, Flaxman AD, Naghavi M, Fitzmaurice C, Vos T, Abubakar I, et al. . The global burden of viral hepatitis from 1990 to 2013: findings from the Global Burden of Disease Study 2013. Lancet (2016) 388:1081–8. 10.1016/S0140-6736(16)30579-7 - DOI - PMC - PubMed
    1. Manns MP, Hahn T. von. Novel therapies for hepatitis C — one pill fits all? Nat Rev Drug Discov. (2013) 12:595–610. 10.1038/nrd4050 - DOI - PubMed
    1. World Health Organization Global Hepatitis Report 2017. Geneva (2017).
    1. Midgard H, Weir A, Palmateer N, Re V Lo, Pineda JA, Macías J, et al. . HCV epidemiology in high-risk groups and the risk of reinfection. J Hepatol. (2016) 65(1 Supplement):S33–45. 10.1016/j.jhep.2016.07.012 - DOI - PubMed

Publication types

MeSH terms

Associated data