Early-Warning Signals of Individual Tree Mortality Based on Annual Radial Growth
- PMID: 30713543
- PMCID: PMC6346433
- DOI: 10.3389/fpls.2018.01964
Early-Warning Signals of Individual Tree Mortality Based on Annual Radial Growth
Abstract
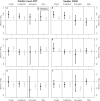
Tree mortality is a key driver of forest dynamics and its occurrence is projected to increase in the future due to climate change. Despite recent advances in our understanding of the physiological mechanisms leading to death, we still lack robust indicators of mortality risk that could be applied at the individual tree scale. Here, we build on a previous contribution exploring the differences in growth level between trees that died and survived a given mortality event to assess whether changes in temporal autocorrelation, variance, and synchrony in time-series of annual radial growth data can be used as early warning signals of mortality risk. Taking advantage of a unique global ring-width database of 3065 dead trees and 4389 living trees growing together at 198 sites (belonging to 36 gymnosperm and angiosperm species), we analyzed temporal changes in autocorrelation, variance, and synchrony before tree death (diachronic analysis), and also compared these metrics between trees that died and trees that survived a given mortality event (synchronic analysis). Changes in autocorrelation were a poor indicator of mortality risk. However, we found a gradual increase in inter-annual growth variability and a decrease in growth synchrony in the last ∼20 years before mortality of gymnosperms, irrespective of the cause of mortality. These changes could be associated with drought-induced alterations in carbon economy and allocation patterns. In angiosperms, we did not find any consistent changes in any metric. Such lack of any signal might be explained by the relatively high capacity of angiosperms to recover after a stress-induced growth decline. Our analysis provides a robust method for estimating early-warning signals of tree mortality based on annual growth data. In addition to the frequently reported decrease in growth rates, an increase in inter-annual growth variability and a decrease in growth synchrony may be powerful predictors of gymnosperm mortality risk, but not necessarily so for angiosperms.
Keywords: biotic agents; drought; forest; growth; resilience indicators; ring-width; tree mortality; variance.
Figures


References
-
- Allen C. D., Breshears D. D., McDowell N. G. (2015). On underestimation of global vulnerability to tree mortality and forest die-off from hotter drought in the Anthropocene. Ecosphere 6 1–55. 10.1890/ES15-00203.1 - DOI
-
- Allen C. D., Macalady A. K., Chenchouni H., Bachelet D., McDowell N., Vennetier M., et al. (2010). A global overview of drought and heat-induced tree mortality reveals emerging climate change risks for forests. For. Ecol. Manage. 259 660–684. 10.1016/j.foreco.2009.09.001 - DOI
-
- Amoroso M. M., Daniels L. D., Larson B. C. (2012). Temporal patterns of radial growth in declining Austrocedrus chilensis forests in Northern Patagonia: the use of tree-rings as an indicator of forest decline. For. Ecol. Manage. 265 62–70. 10.1016/j.foreco.2011.10.021 - DOI

