. 2019 Apr;597(8):2139-2162.
doi: 10.1113/JP277283. Epub 2019 Mar 12.

β-adrenergic-mediated dynamic augmentation of sarcolemmal CaV 1.2 clustering and co-operativity in ventricular myocytes

Affiliations

β-adrenergic-mediated dynamic augmentation of sarcolemmal CaV 1.2 clustering and co-operativity in ventricular myocytes

Danica W Ito et al. J Physiol. 2019 Apr.

Abstract

Key points: Prevailing dogma holds that activation of the β-adrenergic receptor/cAMP/protein kinase A signalling pathway leads to enhanced L-type CaV 1.2 channel activity, resulting in increased Ca2+ influx into ventricular myocytes and a positive inotropic response. However, the full mechanistic and molecular details underlying this phenomenon are incompletely understood. CaV 1.2 channel clusters decorate T-tubule sarcolemmas of ventricular myocytes. Within clusters, nanometer proximity between channels permits Ca2+ -dependent co-operative gating behaviour mediated by physical interactions between adjacent channel C-terminal tails. We report that stimulation of cardiomyocytes with isoproterenol, evokes dynamic, protein kinase A-dependent augmentation of CaV 1.2 channel abundance along cardiomyocyte T-tubules, resulting in the appearance of channel 'super-clusters', and enhanced channel co-operativity that amplifies Ca2+ influx. On the basis of these data, we suggest a new model in which a sub-sarcolemmal pool of pre-synthesized CaV 1.2 channels resides in cardiomyocytes and can be mobilized to the membrane in times of high haemodynamic or metabolic demand, to tune excitation-contraction coupling.

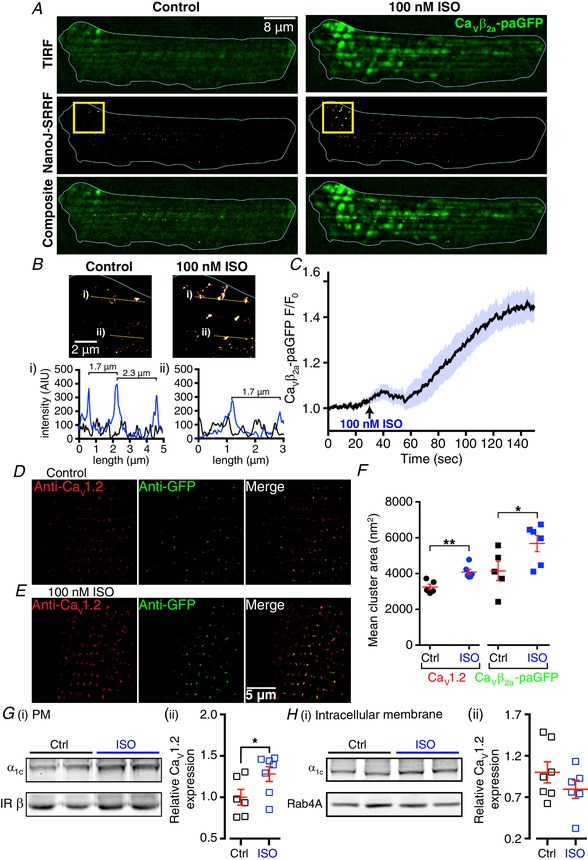
Abstract: Voltage-dependent L-type CaV 1.2 channels play an indispensable role in cardiac excitation-contraction coupling. Activation of the β-adrenergic receptor (βAR)/cAMP/protein kinase A (PKA) signalling pathway leads to enhanced CaV 1.2 activity, resulting in increased Ca2+ influx into ventricular myocytes and a positive inotropic response. CaV 1.2 channels exhibit a clustered distribution along the T-tubule sarcolemma of ventricular myocytes where nanometer proximity between channels permits Ca2+ -dependent co-operative gating behaviour mediated by dynamic, physical, allosteric interactions between adjacent channel C-terminal tails. This amplifies Ca2+ influx and augments myocyte Ca2+ transient and contraction amplitudes. We investigated whether βAR signalling could alter CaV 1.2 channel clustering to facilitate co-operative channel interactions and elevate Ca2+ influx in ventricular myocytes. Bimolecular fluorescence complementation experiments reveal that the βAR agonist, isoproterenol (ISO), promotes enhanced CaV 1.2-CaV 1.2 physical interactions. Super-resolution nanoscopy and dynamic channel tracking indicate that these interactions are expedited by enhanced spatial proximity between channels, resulting in the appearance of CaV 1.2 'super-clusters' along the z-lines of ISO-stimulated cardiomyocytes. The mechanism that leads to super-cluster formation involves rapid, dynamic augmentation of sarcolemmal CaV 1.2 channel abundance after ISO application. Optical and electrophysiological single channel recordings confirm that these newly inserted channels are functional and contribute to overt co-operative gating behaviour of CaV 1.2 channels in ISO stimulated myocytes. The results of the present study reveal a new facet of βAR-mediated regulation of CaV 1.2 channels in the heart and support the novel concept that a pre-synthesized pool of sub-sarcolemmal CaV 1.2 channel-containing vesicles/endosomes resides in cardiomyocytes and can be mobilized to the sarcolemma to tune excitation-contraction coupling to meet metabolic and/or haemodynamic demands.

Keywords: L-type calcium channels; coupled gating; β-adrenergic receptors.


Figures

Figure 1
Figure 1. β‐AR stimulation promotes enhanced CaV1.2–CaV1.2 channel interactions
A, BiFC experimental strategy. Left: non‐interacting channels with a C‐terminal fusion of N‐ or C‐terminal venus FP fragments. Right: application of 100 nm ISO stimulates endogenous β2‐ARs, increasing cAMP and activating PKA that acts on the channels to promote physical interactions, resulting in reconstitution of the intact venus protein and fluorescence emission. BC, TIRF image time series obtained from tsA‐201 cells expressing CaV1.2‐VN and CaV1.2‐VC, incubated at 37°C without (control) (B) or with 100 nm ISO (C). Images received a one pixel median filter for display purposes. D, time course of the changes in normalized venus fluorescence emission (F/F 0) over 2 h for control (black/grey) and ISO stimulated (blue) conditions. Circles indicate mean venus intensity at each time point, dashed lines and area fills indicate the SEM. Data were fit with mono‐exponential functions to calculate the time constant (τ) of the interactions. E, time course of the ISO sensitive component of the interactions.
Figure 2
Figure 2. ISO‐induced ‘super‐clustering’ of CaV1.2 is mediated by PKA
A, diffraction‐limited TIRF (left column) and GSD (right column) images of a control (top row) or 100 nm ISO‐stimulated (bottom row), fixed, adult mouse ventricular cardiomyocyte immunostained to examine CaV1.2 channel distribution. Images were pseudocoloured ‘red hot’ and received a one pixel median filter for display purposes. Yellow boxes indicate the location of the zoomed‐in regions displayed on far right. B and C, same layout format in myocytes pretreated with 10 μm H‐89 (B) or 5 μm PKI (C). D, aligned dot plot showing mean CaV1.2 channel cluster areas in control (black circles) and ISO‐stimulated (blue circles) myocytes in H‐89 pre‐treated myocytes under control (black squares) or ISO‐stimulated (blue squares) conditions and in PKI pre‐treated myocytes control (black triangles) or ISO‐stimulated (blue triangles) conditions. Red lines indicate the mean for each dataset and error bars indicate the SEM.
Figure 3
Figure 3. ISO augments CaV1.2 channel cluster areas in tsA‐201 cell plasma membranes
A, diffraction‐limited TIRF (left column) and GSD (right column) images of control (top row) and 100 nm ISO‐stimulated (bottom row), fixed, tsA‐201 cells expressing CaV1.2 channels, immunostained to examine the channel distribution. Images were pseudocoloured ‘red hot’ and received a one pixel median filter for display purposes. Yellow boxes indicate the location of the zoomed‐in regions displayed on far right. B, aligned dot plot showing mean CaV1.2 channel cluster areas in control (black circles) and ISO‐stimulated (blue circles) tsA‐201 cells. Red lines indicate the mean for each dataset and error bars indicate the SEM.
Figure 4
Figure 4. ISO stimulates dynamic augmentation of CaV1.2 channel sarcolemmal abundance
A, top: diffraction‐limited TIRF images of photoactivated GFP fluorescence emission from CaVβ2a‐paGFP transduced cardiomyocytes before (left) and after application of 100 nm ISO (right). Middle row: NanoJ‐SRRF generated super‐resolution images of the same cell. Bottom row: composites of the TIRF and NanoJ‐SRRF images. B, magnified NanoJ‐SRRF images before and after ISO. Locations on the larger images are indicated by yellow boxes in (A). Intensity plot profiles across the dotted yellow lines labelled (i) and (ii) are displayed below where the black trace represents the control plot and the blue represents a plot from the same region after ISO. C, time course of the changes in normalized photoactivated CaVβ2a‐paGFP emission (F/F 0) during a 30 s control period and a subsequent 120 s exposure to ISO. DE, super‐resolution images of fixed control (D) or ISO‐stimulated (E) ventricular myocytes double labelled to show CaV1.2 (left) and GFP (middle) distribution. Colocalized pixels appear yellow in the merged image (right) and confirm t‐tubule localization of CaVβ2a‐paGFP. F, scatter plot showing the mean CaV1.2 and CaVβ2a‐paGFP cluster sizes, in control (black) and ISO‐stimulated (blue) ventricular myocytes. G and H, (i) representative western blots illustrating the detection of CaV1.2 α1c and insulin receptor β in plasma membrane fractions (G) or CaV1.2 α1c and Rab4A in intracellular membrane fractions (H) isolated from whole heart lysates obtained from mice 20 min post i.p. injection with either saline (control) or 10 mg kg–1 ISO. G and H, (ii) scatter plots showing the relative CaV1.2 channel expression in each fraction.
Figure 5
Figure 5. ISO treatment increases stepwise photobleaching assessed CaV1.2 channel cluster size
A, frequency distribution of photobleaching step sizes measured experiments performed on CaVβ2a‐paGFP transduced myocytes. The data were well‐fit (r 2 value shown) by a two‐component Gaussian function with peaks at ∼23 and 46 representing the fluorescence intensity change attributable to one and two‐GFPs bleaching, respectively. B, frequency distribution of bleaching steps obtained from histogram CaVβ2a‐paGFP transduced myocytes under control unstimulated conditions (grey; fit with a single Gaussian) or after application of 100 nm ISO (blue; fit with a two‐component Gaussian). C, examples of bleaching steps for CaVβ2a‐paGFP associated with CaV1.2 channels.
Figure 6
Figure 6. Co‐operative gating behaviour of heterologously expressed CaV1.2 channels is promoted by ISO
A and B, representative i Ca traces and accompanying amplitude histograms from tsA‐201 cells expressing CaV1.2 during depolarization steps from –80 mV to –30 mV before (A) and during the application of 100 nm ISO (B). Note that traces in (B) are from the same cell as those in (A). Grey boxes highlight overt co‐operative gating episodes. Amplitude histograms for control and ISO were fit with multicomponent Gaussian functions (red lines). C, current averaged over multiple sweeps performed on the cell shown in (A) and (B). DF, paired symbol and line plots showing the peak ensemble current (D), P o (E) and apparent N f (F) for five cells before and during ISO application.
Figure 7
Figure 7. β‐AR stimulation increases the number of functional channels in tsA‐201 cell membranes
A, representative whole cell currents elicited from a CaV1.2‐expressing tsA‐201 cell during a 300 ms depolarization step from –80 mV to +10 mV before (control: black) and during application of 100 nm ISO (blue). B, I–V plot summarizing the results from n = 3 cells that displayed an ISO‐stimulated increase in I Ca with voltage steps from a holding potential of –80 mV to test potentials ranging from –40 mV to +70 mV. Currents were normalized to the cell capacitance to generate the current density. C, voltage‐dependence of the normalized conductance (G/G max) before and during ISO application, fit with Boltzmann functions. D, gating currents (I gating) recorded from a CaV1.2‐expressing tsA‐201 cell during a 300 ms depolarizing step from ‐80 mV to the reversal potential (E rev), before (black) and during application of 100 nm ISO (blue). Grey boxes in (i) indicate the ON I gating, magnified in (ii) and merged for comparison in (iii). Shading beneath the ON I gating indicates the area that was integrated to obtain the ON gating charge (Q ON) shown in (E). F, fold‐change in Qon during ISO application in n = 5 cells.
Figure 8
Figure 8. ICa are increased in isolated ventricular myocytes during β‐AR stimulation
A, representative whole cell currents elicited from an adult ventricular myocyte during a 300 ms depolarization step from –40 mV to 0 mV before (control: black) and during application of 100 nm ISO (blue). B, IV plot summarizing the results from n = 8 cells (from N = 3 animals) subjected to test potentials ranging from –40 mV to +60 mV. Currents were normalized to the cell capacitance to generate the current density. C, voltage‐dependence of the normalized conductance (G/G max) before and during ISO application, fit with Boltzmann functions.
Figure 9
Figure 9. Optical recordings of ISO‐induced augmentation in CaV1.2 channel co‐operativity
A and B, calibrated TIRF images showing CaV1.2 channel‐expressing, tsA‐201 cell footprints, in a cell loaded with Rhod‐2 Ca2+ indicator dye via the patch pipette. Images shown are maximum z‐projections of image stacks recorded before (A) and during application of 100 nm ISO‐stimulated (B). The time course of changes in [Ca2+] is shown on the right for two sparklet sites (denoted by green circles i and ii), before (black) and during ISO (blue). CE, scatter and bar plots summarizing nPs (C), sparklet site density (D) and coupling coefficient (κ) (E) results obtained from n = 6 cells under control conditions and n = 4 cells in 100 nm ISO.
Figure 10
Figure 10. Elementary CaV1.2 channel currents are increased by ISO in adult ventricular myocytes
A and B, representative i Ca traces elicited by a step depolarization from –80 mV to –30 mV before (control) (A) and during application of 100 nm ISO (B) each with amplitude histograms were fit with multicomponent Gaussian functions (red lines). C, average ensemble currents from the same cell before (black) and during ISO application (blue). DF, paired symbol and line plots of the peak ensemble current (D), P o (E) and apparent N f (F) in n = 6, N = 5. G and H, i Ca traces and accompanying amplitude histograms from a cell that displayed a preference for dimeric channel openings in the presence of ISO.

Comment in

References

    1. Altier C, Garcia‐Caballero A, Simms B, You H, Chen L, Walcher J, Tedford HW, Hermosilla T & Zamponi GW (2011). The CaVβ subunit prevents RFP2‐mediated ubiquitination and proteasomal degradation of L‐type channels. Nat Neurosci 14, 173–180. - PubMed
    1. Atwood BK, Lopez J, Wager‐Miller J, Mackie K & Straiker A (2011). Expression of G protein‐coupled receptors and related proteins in HEK293, AtT20, BV2, and N18 cell lines as revealed by microarray analysis. BMC Genomics 12, 14. - PMC - PubMed
    1. Bean BP, Nowycky MC & Tsien RW (1984). Beta‐adrenergic modulation of calcium channels in frog ventricular heart cells. Nature 307, 371–375. - PubMed
    1. Bhargava A, Lin X, Novak P, Mehta K, Korchev Y, Delmar M & Gorelik J (2013). Super‐resolution scanning patch clamp reveals clustering of functional ion channels in adult ventricular myocyte. Circ Res 112, 1112–1120. - PMC - PubMed
    1. Bichet D, Cornet V, Geib S, Carlier E, Volsen S, Hoshi T, Mori Y & De Waard M (2000). The I‐II loop of the Ca2+ channel α1 subunit contains an endoplasmic reticulum retention signal antagonized by the beta subunit. Neuron 25, 177–190. - PubMed

Publication types