. 2019 Mar 1;11(3):844-854.
doi: 10.1093/gbe/evz022.

Demographic History of the Human Commensal Drosophila melanogaster

Affiliations

Demographic History of the Human Commensal Drosophila melanogaster

J Roman Arguello et al. Genome Biol Evol. .

Erratum in

Abstract

The cohabitation of Drosophila melanogaster with humans is nearly ubiquitous. Though it has been well established that this fly species originated in sub-Saharan Africa, and only recently has spread globally, many details of its swift expansion remain unclear. Elucidating the demographic history of D. melanogaster provides a unique opportunity to investigate how human movement might have impacted patterns of genetic diversity in a commensal species, as well as providing neutral null models for studies aimed at identifying genomic signatures of local adaptation. Here, we use whole-genome data from five populations (Africa, North America, Europe, Central Asia, and the South Pacific) to carry out demographic inferences, with particular attention to the inclusion of migration and admixture. We demonstrate the importance of these parameters for model fitting and show that how previous estimates of divergence times are likely to be significantly underestimated as a result of not including them. Finally, we discuss how human movement along early shipping routes might have shaped the present-day population structure of D. melanogaster.

Keywords: Drosophila; admixture; demography; migration; population expansion.


Figures

<sc>Fig</sc>. 1.
Fig. 1.
—Overview and clustering of the data. (A) Sampling locales included in the GDLs. (B) Population differentiation as measured by genome-wide FST within a pair-wise network. Thickness of the lines connecting pairs of populations indicate FST measured between them. (C) Summary statistics for genome-wide SNP data (TajD = Tajima’s D; polymorphism = average number of nucleotide differences per site, π [Nei and Li 1979], Poly/Div = π/divergence, where divergence was measured as the average number of nucleotide substitutions per site between the Drosophila melanogaster and Drosophila simulans; modified from Grenier et al. [2015]). (D) Genetic clustering of “neutral” autosomal SNPs by Discriminant Analysis of Principal Components (Jombart 2008; Jombart and Ahmed 2011).
<sc>Fig</sc>. 2.
Fig. 2.
—Single population demographic inferences. (A) Schematic of the single population demographic model. (B) Table of estimates [for] the single population model. Symbols indicate the following: Ne = effective population size, Tgrowth = time of population growth measured in number of generation (assuming ten generation per year). (C) Comparison of estimated and predictive simulation values that were calculated under the best fitting population expansion (nucleotide diversity [π], Tajima’s D [D; Tajima 1989], and the nucleotide SFS). Black vertical lines on the simulated SFS bars indicate the 95% CIs.
<sc>Fig</sc>. 3.
Fig. 3.
—Best fitting 3-population models and their parameter estimates. (A) Schematics for the three best fitting 3-population models. Width of the population branches suggest population sizes (not to scale); arrows indicate direction of migration forward in time, with their sizes suggesting relative rates (not to scale). (B) Parameter estimates for the corresponding best fitting models and their 95% CI ranges. Symbols indicate the following: Ne = effective population size, 2Nm = scaled migration rate forward in time, Tsplit = population split-time measured in number of generations (ten generation per year), Tgrowth = time of population growth measured in number of generations (ten generation per year), and A = admixture proportion.
<sc>Fig</sc>. 4.
Fig. 4.
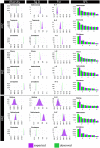
—3-Population predictive simulations. Comparison of simulated values under the three best fitting 3-population models (from fig. 3A) to the observed values: (nucleotide diversity [π] [Nei and Li 1979], Tajima’s D [D] [Tajima 1989], population differentiation [FST], and the nucleotide SFS). Population names are abbreviated: B = Beijing; I = Ithaca; N = the Netherlands; T = Tasmania; and Z = Zimbabwe. Black vertical lines on the simulated SFS bars indicate the 95% CIs.

References

    1. Arguello JR, et al. 2016. Extensive local adaptation within the chemosensory system following Drosophila melanogaster’s global expansion. Nat Commun. 7:ncomms11855. - PMC - PubMed
    1. Baudry E, Viginier B, Veuille M.. 2004. Non-African populations of Drosophila melanogaster have a unique origin. Mol Biol Evol. 21(8):1482–1491. - PubMed
    1. Begun D, Aquadro C.. 1993. African and North American populations of Drosophila are very different at the DNA level. Nature 365(6446):548–550. - PubMed
    1. Bergland AO, Tobler R, González J, Schmidt P, Petrov D.. 2016. Secondary contact and local adaptation contribute to genome-wide patterns of clinal variation in Drosophila melanogaster. Mol Ecol. 25(5):1157–1174. - PMC - PubMed
    1. Caballero A. 1995. On the effective size of populations with separate sexes, with particular reference to sex-linked genes. Genetics 139(2):1007–1011. - PMC - PubMed

Publication types

LinkOut - more resources