Review
. 2019 Feb:3:1-13.
doi: 10.1200/CCI.18.00069.

A Review of Cell-Based Computational Modeling in Cancer Biology

Affiliations
Review

A Review of Cell-Based Computational Modeling in Cancer Biology

John Metzcar et al. JCO Clin Cancer Inform. 2019 Feb.

Abstract

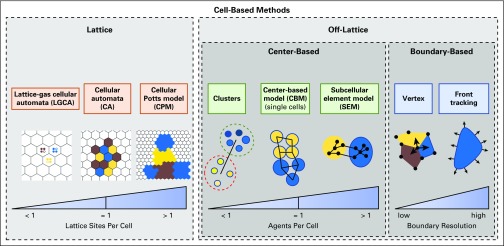
Cancer biology involves complex, dynamic interactions between cancer cells and their tissue microenvironments. Single-cell effects are critical drivers of clinical progression. Chemical and mechanical communication between tumor and stromal cells can co-opt normal physiologic processes to promote growth and invasion. Cancer cell heterogeneity increases cancer's ability to test strategies to adapt to microenvironmental stresses. Hypoxia and treatment can select for cancer stem cells and drive invasion and resistance. Cell-based computational models (also known as discrete models, agent-based models, or individual-based models) simulate individual cells as they interact in virtual tissues, which allows us to explore how single-cell behaviors lead to the dynamics we observe and work to control in cancer systems. In this review, we introduce the broad range of techniques available for cell-based computational modeling. The approaches can range from highly detailed models of just a few cells and their morphologies to millions of simpler cells in three-dimensional tissues. Modeling individual cells allows us to directly translate biologic observations into simulation rules. In many cases, individual cell agents include molecular-scale models. Most models also simulate the transport of oxygen, drugs, and growth factors, which allow us to link cancer development to microenvironmental conditions. We illustrate these methods with examples drawn from cancer hypoxia, angiogenesis, invasion, stem cells, and immunosurveillance. An ecosystem of interoperable cell-based simulation tools is emerging at a time when cloud computing resources make software easier to access and supercomputing resources make large-scale simulation studies possible. As the field develops, we anticipate that high-throughput simulation studies will allow us to rapidly explore the space of biologic possibilities, prescreen new therapeutic strategies, and even re-engineer tumor and stromal cells to bring cancer systems under control.


Conflict of interest statement

Paul Macklin

Patents, Royalties, Other Intellectual Property: Patent in review for machine learning in digital pathology

No other potential conflicts of interest were reported.

Figures

FIG 1.
FIG 1.
A schematic classification of cell-based modeling approaches.
FIG 2.
FIG 2.
Cell-based models of hypoxia in breast cancer. (A) A cellular automaton model of breast cancer that explores cellular metabolic changes and early development of invasion. Reprinted with permission from Gatenby et al. (B) An immersed boundary model to simulate cancer invasion under hypoxic gradients. Adapted with permission from Anderson et al. (C) PhysiCell (a center-based model [CBM]) simulation of ductal carcinoma in situ as it advances in breast ducts under diffusive growth limits. Note the brown necrotic core. Adapted with permission from Ghaffarizadeh et al. (D) Adapted PhysiCell simulation of hanging-drop tumor spheroids. Oxygen diffusive limits lead to hypoxic gradients, greatest proliferation on the outer edge, an interior quiescent region, and an central necrotic core (brown). Note the network of fluid-filled pores that emerges from the necrotic core mechanics. These are observed in experiments. The inset shows a fluorescent image of a hanging-drop tumor spheroid. Adapted with permission from Ghaffarizadeh et al. (E) CBMs of tumor spheroids pioneered by Drasdo and Höhme produced similarly layered structures. Reprinted with permission from Drasdo and Höhme. (F) A CBM of tumor cords growing around a blood vessel and showing a reversed structure with viable tissue in the interior. Adapted with permission from Szymańska et al.
FIG 3.
FIG 3.
Tumor-associated angiogenesis and vascular flow. (A) A two-dimensional (2D) cellular automaton model of sprouting angiogenesis used to study drug delivery from tumor vasculatures. Reprinted with permission from McDougall et al. (B) A 2D cellular Potts model of angiogenesis. Stalk cells can overtake tip cells to become new tip cells. The arrows show these role swaps. Reprinted with permission from Boas and Merks. (C) A 3D cellular Potts model of sprouting angiogenesis driven by vascular endothelial growth factor released by hypoxic tumor cells. Adapted with permission from Shirinifard et al. (D) A 2D cellular automaton model (left) to investigate drug delivery to simulated tumors (right). Adapted with permission from Cai et al. (E) A discrete angiogenesis model of McDougall et al combined with a continuum tumor growth model used to investigate the effect of interstitial fluid pressure and lymphatic drainage on therapeutic delivery. Shown are tumor and the discrete vasculature (left); fluid extravasation from blood and lymphatic vessels (middle); and interstitial fluid velocity (right), which hinders drug delivery. Adapted with permission from Wu et al.
FIG 4.
FIG 4.
Cancer stem cells, invasion, and the "go or grow" hypothesis. (A) Top view of a three-dimensional (3D) center-based model of colon crypts (left plots) where the stem-cell niche is in the center. A nonstem mutation (blue cells) is swept out of the crypt by the proliferative cell flux. On the right, is a 3D view of four such ducts that feed cells to a central villus, which is based on the same simulation model. Adapted with permission from Fletcher et al (left) and Mirams et al (right). (B) A 3D cellular automaton (CA) model (with stem-cell effects) of how chemical signaling with fibroblasts and macrophages can drive triple-negative breast cancer. Among these findings, if stromal cells can promote increased cancer cell migration, the overall tumor grows. Reprinted with permission from Norton et al. (C) A 2D CA model to investigate the spread of traits in growing tumors, when cancer cells and their progeny could carry four tumor traits. Traits disseminate largely radially, with clear implications for tumor needle biopsies. Adapted from Poleszczuk and Enderling. (D) A 2D cellular Potts model of stem cells in glioblastoma that shows their role in building resistance to radiotherapy. Reprinted with permission from Gao et al. (E) Lattice gas CA models of the "go or grow" hypothesis in glioblastoma multiforme. As cells spend more time proliferating, they contribute to better growth up to a critical transition point; beyond this point, decreased migration is insufficient to open space for cell division. Adapted with permission from Hatzikirou et al. (F) A center-based model to explore the "go or grow" hypothesis in glioblastoma multiforme. Here, G0 is the models' growth rate parameter. Adapted with permission from Kim et al.
FIG 5.
FIG 5.
Cancer invasion and immunosurveillance. (A) In a center-based model, signals secreted by stromal cells (red) induce tumor cells (gray) to degrade the basement membrane and invade the stroma (blue mesh). Adapted with permission from Kim et al. (B) A three-dimensional (3D) cellular automaton (CA) model to study selection in heterogeneous brain cancers. Cells could mutate their signaling network parameters, which leads to more invasive clones. Adapted with permission from Zhang et al. (C) An immersed boundary method of contact-based signaling and polarization in breast acini., Cells with altered signaling could fill the lumen or invade the stroma. Adapted with permission from Anderson et al. (D) A 2D CA model of tumor-immune interactions. Immune cells (blue dots) become exhausted after too many successful tumor cell kills and create fibrotic tissue (yellow). Tumor encapsulation, tumor elimination, and chronic response are observed in the model. Adapted with permission from Kather et al. (E) A sophisticated 3D CA model of treatments targeting programmed cell death-1 (PD-1) and programmed death ligand 1 (PD-L1) in cancer cells. (PD-L1+ cells express PD-L1; PD-L1 cells do not.) Reprinted with permission from Gong et al. (F) A 3D center-based model of immune responses to an immunostimulatory factor in a heterogeneous tumor (shaded by immunogenicity; yellow cells are most immunogenic). Immune cells (red) seek and adhere to cancer cells, test for immunogenicity, and induce apoptosis. The immune response failed after immune cells aggregated near a local maximum in the signaling factor, which allows the tumor to repopulate. Adapted with permission from Ghaffarizadeh et al. This work was explored further with high-performance computing.

References

    1. Macklin P, Frieboes HB, Sparks JL, et al. Progress towards computational 3-D multicellular systems biology. Adv Exp Med Biol. 2016;936:225–246. - PMC - PubMed
    1. Macklin P. Biological background. In: Cristini V, Lowengrub J, editors. Multiscale Modeling of Cancer: An Integrated Experimental and Mathematical Modeling Approach. Cambridge, United Kingdom: Cambridge University Press; 2010. pp. 8–23.
    1. Hanahan D, Weinberg RA. Hallmarks of cancer: The next generation. Cell. 2011;144:646–674. - PubMed
    1. Maley CC, Aktipis A, Graham TA, et al. Classifying the evolutionary and ecological features of neoplasms. Nat Rev Cancer. 2017;17:605–619. - PMC - PubMed
    1. Zhang D, Tang DG, Rycaj K. Cancer stem cells: Regulation programs, immunological properties and immunotherapy. Semin Cancer Biol. epub ahead of print on May 9, 2018. - PMC - PubMed

Publication types