

Hierarchical Rough-to-Fine Model for Infant Age Prediction Based on Cortical Features
- PMID: 30716056
- PMCID: PMC6675669
- DOI: 10.1109/JBHI.2019.2897020
Hierarchical Rough-to-Fine Model for Infant Age Prediction Based on Cortical Features
Abstract
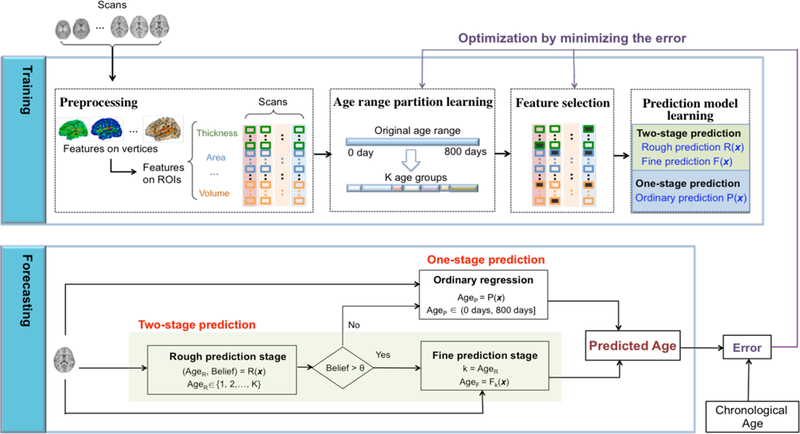
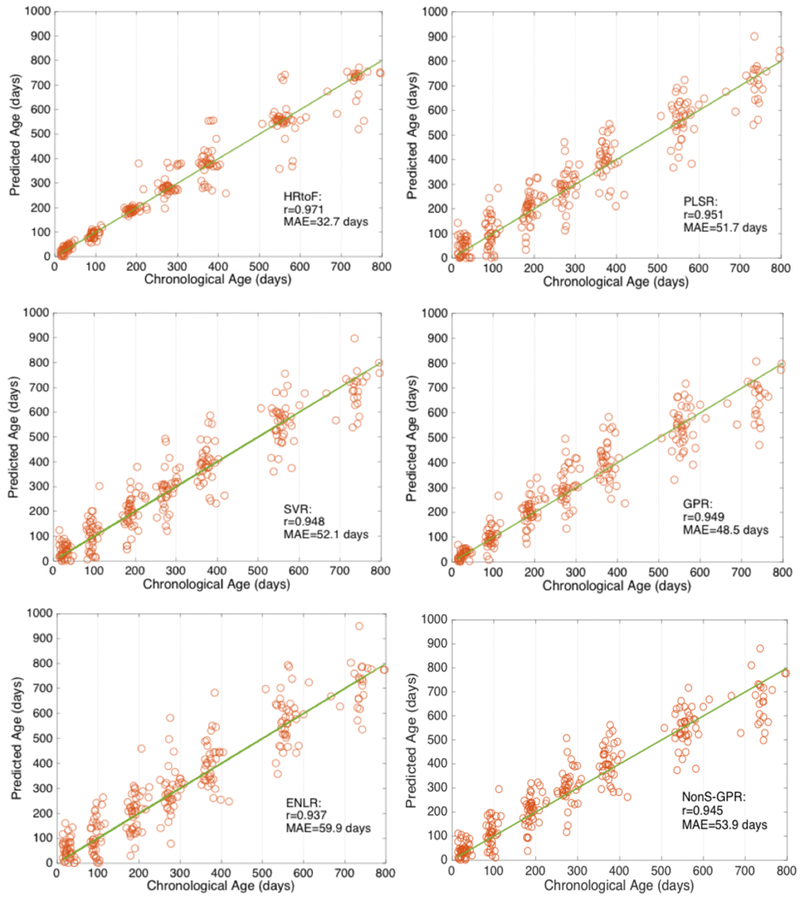
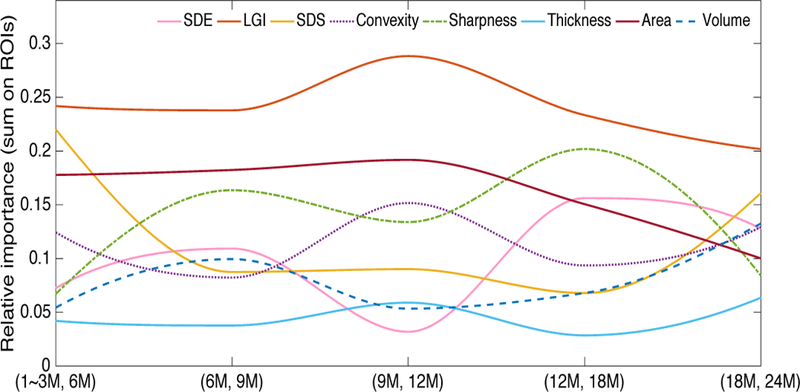
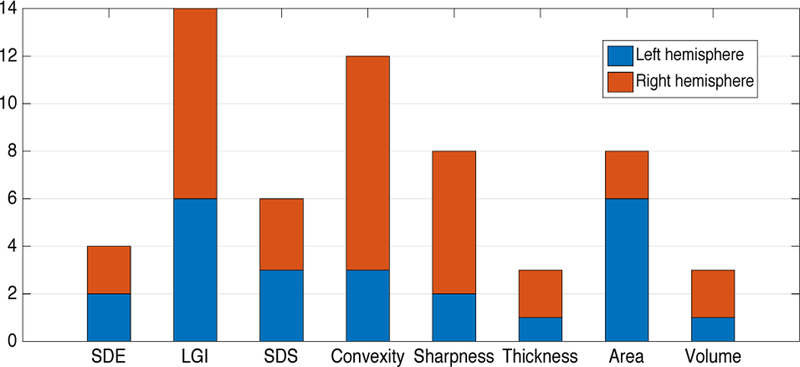
Prediction of the chronological age based on neuroimaging data is important for brain development analysis and brain disease diagnosis. Although many researches have been conducted for age prediction of older children and adults, little work has been dedicated to infants. To this end, this paper focuses on predicting infant age from birth to 2-year old using brain MR images, as well as identifying some related biomarkers. However, brain development during infancy is too rapid and heterogeneous to be accurately modeled by the conventional regression models. To address this issue, a two-stage prediction method is proposed. Specifically, our method first roughly predicts the age range of an infant and then finely predicts the accurate chronological age based on a learned, age-group-specific regression model. Combining this two-stage prediction method with another complementary one-stage prediction method, a hierarchical rough-to-fine (HRtoF) model is built. HRtoF effectively splits the rapid and heterogeneous changes during a long time period into several short time ranges and further mines the discrimination capability of cortical features, thus reaching high accuracy in infant age prediction. Taking 8 types of cortical morphometric features from structural MRI as predictors, the effectiveness of our proposed HRtoF model is validated using an infant dataset including 50 healthy subjects with 251 longitudinal MRI scans from 14 to 797 days. Comparing with five state-of-the-art regression methods, HRtoF model reduces the mean absolute error of the prediction from >48 days to 32.1 days. The correlation coefficient of the predicted age and the chronological age reaches 0.963. Moreover, based on HRtoF, the relative contributions of the eight types of cortical features for age prediction are also studied.
Figures
References
-
- Morgane PJ et al., “Prenatal Malnutrition and Development of the Brain,” (in English), Neuroscience and Biobehavioral Reviews, vol. 17, no. 1, pp. 91–128, Spr 1993. - PubMed
-
- Hogstrom LJ, Westlye LT, Walhovd KB, and Fjell AM, “The Structure of the Cerebral Cortex Across Adult Life: Age-Related Patterns of Surface Area, Thickness, and Gyrification,” (in English), Cerebral Cortex, vol. 23, no. 11, pp. 2521–2530, Nov 2013. - PubMed
Publication types
MeSH terms
Grants and funding
LinkOut - more resources
Full Text Sources
Medical
