. 2019 Feb 4;17(2):e3000128.
doi: 10.1371/journal.pbio.3000128. eCollection 2019 Feb.

Genetic redundancy fuels polygenic adaptation in Drosophila

Affiliations

Genetic redundancy fuels polygenic adaptation in Drosophila

Neda Barghi et al. PLoS Biol. .

Abstract

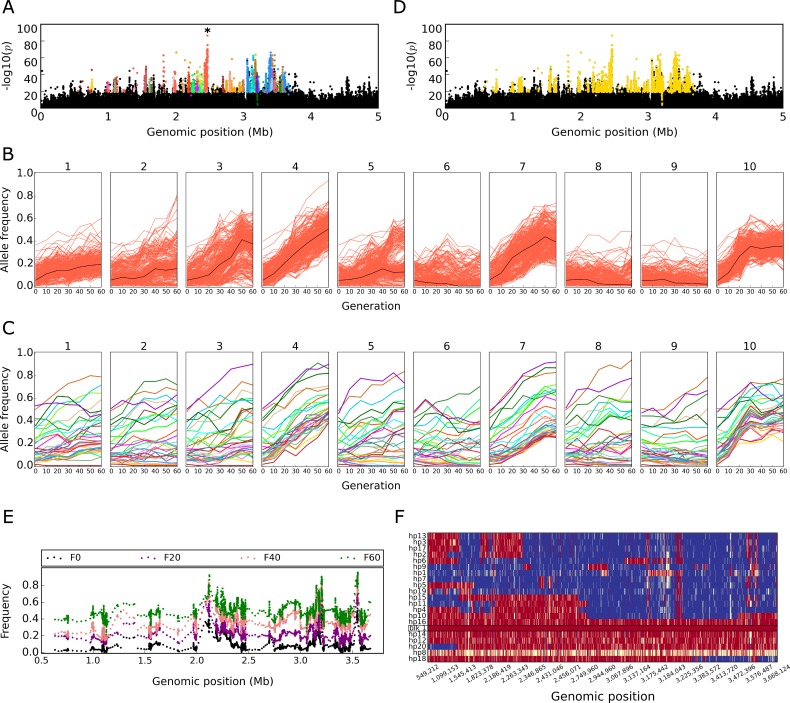
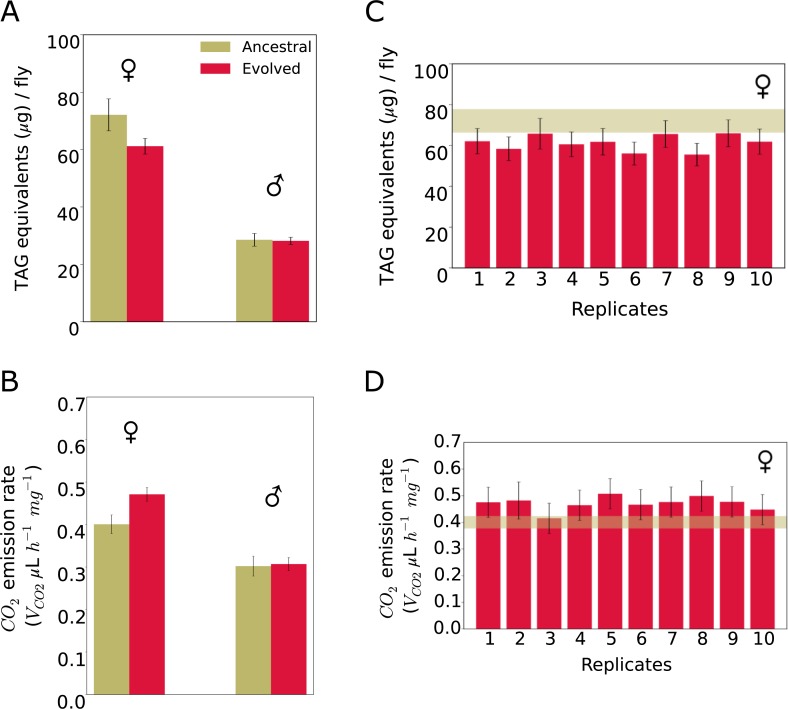
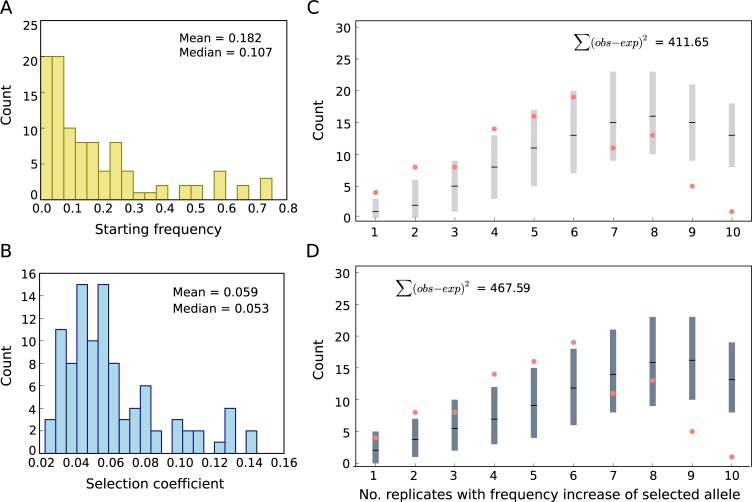
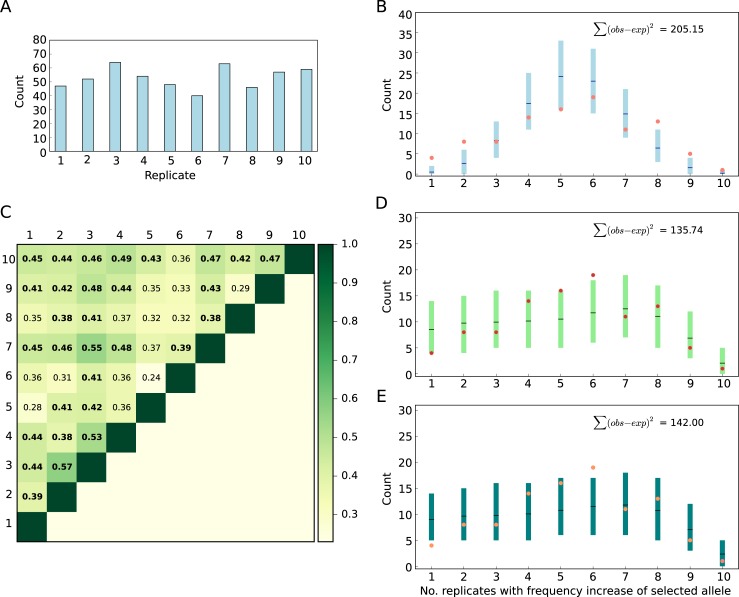
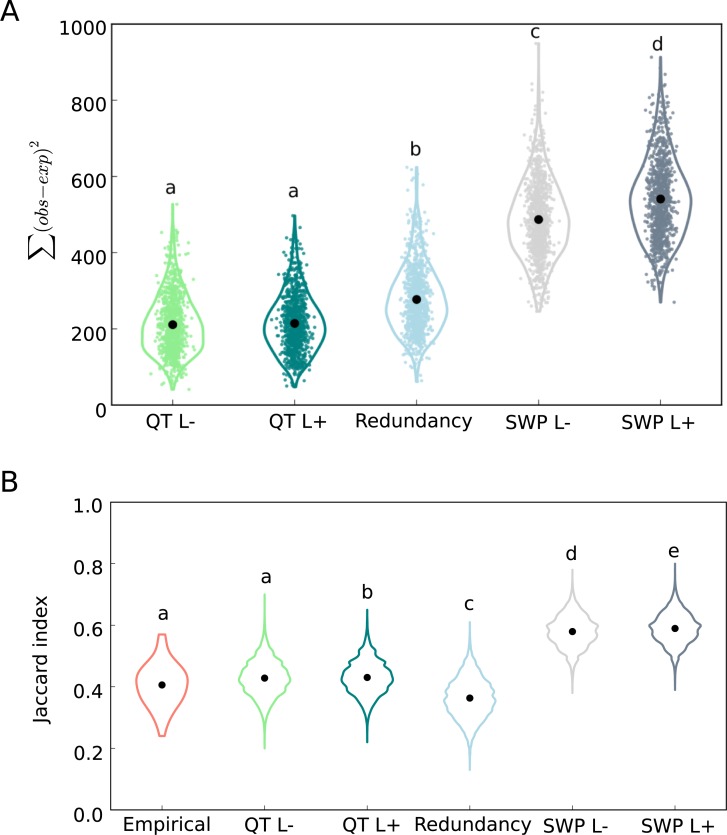
The genetic architecture of adaptive traits is of key importance to predict evolutionary responses. Most adaptive traits are polygenic-i.e., result from selection on a large number of genetic loci-but most molecularly characterized traits have a simple genetic basis. This discrepancy is best explained by the difficulty in detecting small allele frequency changes (AFCs) across many contributing loci. To resolve this, we use laboratory natural selection to detect signatures for selective sweeps and polygenic adaptation. We exposed 10 replicates of a Drosophila simulans population to a new temperature regime and uncovered a polygenic architecture of an adaptive trait with high genetic redundancy among beneficial alleles. We observed convergent responses for several phenotypes-e.g., fitness, metabolic rate, and fat content-and a strong polygenic response (99 selected alleles; mean s = 0.059). However, each of these selected alleles increased in frequency only in a subset of the evolving replicates. We discerned different evolutionary paradigms based on the heterogeneous genomic patterns among replicates. Redundancy and quantitative trait (QT) paradigms fitted the experimental data better than simulations assuming independent selective sweeps. Our results show that natural D. simulans populations harbor a vast reservoir of adaptive variation facilitating rapid evolutionary responses using multiple alternative genetic pathways converging at a new phenotypic optimum. This key property of beneficial alleles requires the modification of testing strategies in natural populations beyond the search for convergence on the molecular level.


Conflict of interest statement

The authors have declared that no competing interests exist.

Figures

Fig 1
Fig 1. Reconstruction of selected haplotype block from Pool-Seq data.
Manhattan plots (panel A, D) show negative log10 transformed p-values from CMH test contrasting the ancestral (F0) with evolved (F60) populations (Chromosome 2L: 1–5 Mb). SNPs with highly correlated allele frequencies across replicates and time points are clustered together with stringent clustering (panel A), and each cluster is indicated by a different color. SNPs in each cluster (e.g., the orange cluster marked with an asterisk in panel A) have correlated frequency trajectories across 60 generations in 10 replicates (panel B); the black line depicts the median allele frequency trajectory. (C) Trajectories of the median allele frequency of the correlated SNPs are shown for each of the clusters in this region (color code corresponds to panel A). Despite different starting frequencies, the median trajectories greatly resemble each other, suggesting that they are correlated and reflect a large selected genomic region. (D) Combining the adjacent short clusters with less stringent correlation identifies a haplotype block with weakly correlated SNPs. All SNPs, which cluster together, are used as markers for this selected haplotype block. (E) Time-resolved allele frequencies of marker SNPs for the haplotype block (panel D) are plotted along their genomic positions. Each dot indicates the mean frequency of five SNPs in overlapping windows (offset = 1 SNP). The time-resolved allele frequencies show a consistent increase across the entire haplotype block throughout the experiment. The data are from replicate 4. (F) The reconstructed haplotype block (panel D, E) is experimentally validated. Rows represent 20 phased haplotypes from evolved replicate 4. The reconstructed haplotype block is indicated by a black frame. Each column corresponds to a marker SNP, with red color indicating the character state of the haplotype block, blue the alternative allele, and yellow an unknown nucleotide. Data deposited in the Dryad Repository: https://doi.org/10.5061/dryad.rr137kn. CMH, Cochran-Mantel-Haenszel; SNP, single nucleotide polymorphism.
Fig 2
Fig 2. Adaptive response and phenotypic convergence in evolved replicates.
(A) The amount of triglyceride as main constituent of body fat. Females of evolved replicates have significantly lower fat content than the ancestral population. Two-way ANOVA with interaction, Tukey’s HSD test p = 0.0007, (B) Resting metabolism measured by CO2 production as measure of resting metabolic rate. Females of evolved replicates produced significantly more CO2 than the ancestral population, two-way ANOVA with interaction, Tukey’s HSD test p < 0.0001. No significant difference was observed among males of the evolved replicates and the ancestral population (body fat: p = 0.7680; metabolic rate: p = 0.7405). Convergent evolution for fat content (panel C) and metabolic rate (panel D) for females of 10 evolved replicates. No significant difference was detected between the replicates (two-way ANOVA, Tukey’s HSD test p > 0.05). The bars show the least-squares means of the linear model, and error bars depict 95% confidence levels of least-squares means. The dark khaki horizontal bars show the 95% confidence levels of least-squares means in the ancestral population. Fat content and metabolic rate in males is shown in S1C and S1D Fig. Data deposited in the Dryad Repository: https://doi.org/10.5061/dryad.rr137kn. HSD, honest significant difference; TAG, triglyceride.
Fig 3
Fig 3. Characteristics of selected alleles: No match to the selective sweep paradigm.
Distribution of (A) starting frequencies and (B) selection coefficients (s) of the selected alleles. The starting frequency of each selected allele has been estimated from the median frequency of all its marker SNPs. (C, D) The RFS from experimental data is indicated by salmon dots. The expected distribution of sweep paradigm with constant s across replicates without (C) and with (D) linkage using empirical Ne and locus-specific s (panel B) and starting frequency (panel A) was obtained from computer simulations. Light and dark grey bars show the 95% confidence interval of 1,000 iterations. Means are depicted in black lines in each bar. The difference between empirical (observed) and the mean of simulated (expected) data is shown as Σ(obs − exp)2. Data deposited in the Dryad Repository: https://doi.org/10.5061/dryad.rr137kn. RFS, replicate frequency spectrum; SNP, single nucleotide polymorphism.
Fig 4
Fig 4. Adaptive genetic redundancy of selected alleles.
(A) The number of selected alleles with ≥0.1 AFC (blue bars, average 53 loci/replicate) after 60 generations in each replicate. (B) Comparison of the empirical RFS (salmon) to the expected one under the assumption of genetic redundancy among alleles. 95% CI (blue) and means (black) were obtained by 1,000 iterations of delete-d jackknifing. (C) Pairwise Jaccard similarity indices among 10 evolved replicates. Indices significantly higher than expected by chance under the redundancy paradigm (panel B, Fig 5B) are shown in bold. Comparison of the empirical RFS (salmon) to the expected one assuming a QT paradigm without (panel D) and with (panel E) linkage after a change in trait optimum. 95% CI (light and dark green) were obtained by 1,000 iterations of forward simulations. The difference between empirical (observed) and the mean of simulated (expected) data, Σ(obs − exp)2, indicates a much better fit of the genetic redundancy and QT paradigm to the empirical data compared to sweep simulations (Fig 3C and 3D). Data deposited in the Dryad Repository: https://doi.org/10.5061/dryad.rr137kn. AFC, allele frequency change; RFS, replicate frequency spectrum.
Fig 5
Fig 5. QT and redundancy paradigms fit the RFS of the empirical data better than selective sweep paradigm.
(A) The difference between RFS of evolved replicates (observed) and that of the simulated (expected) data. For 1,000 iterations of each simulation, the difference between empirical and simulated RFS, Σ(obs − exp)2 is shown. The difference in RFS between evolved replicates and sweep simulations (SWP, without linkage: L− and with linkage: L+) are significantly higher than that of redundancy and QT paradigms (QT without linkage: L−; and with linkage: L+), One-way ANOVA, Tukey’s HSD test, p < 10−5. (B) Pairwise Jaccard indices in the empirical and simulated data. Replicates in the SWP L− and L+ simulations are significantly (p < 10−5) more similar than evolved replicates, while evolved replicates are significantly more similar than expected by chance, i.e., under the redundancy paradigm (p < 10−5). The Jaccard indices of replicates in QT simulations with (QT L+, p = 0.077) and without linkage (QT L−, p = 0.038) are more similar to the empirical data. Data deposited in the Dryad Repository: https://doi.org/10.5061/dryad.rr137kn. HSD, honest significant difference; QT, quantitative trait; RFS, replicate frequency spectrum; SWP, sweep.
Fig 6
Fig 6. Selected alleles occur at higher frequency than neutral SNPs.
The folded SFS of marker SNPs from selected alleles (23,835 SNPs) and nonselected SNPs (5,066,625 SNPs) in ancestral population is plotted. SNPs that were not identified as markers of selected alleles are considered nonselected SNPs. The distributions of these two SNP classes differ significantly (two-sided Kolmogorov-Smirnov test, ks value = 0.086, p < 10−16). Data deposited in the Dryad Repository: https://doi.org/10.5061/dryad.rr137kn. SFS, site frequency spectrum; SNP, single nucleotide polymorphism.

References

    1. Hoekstra HE. Genetics, development and evolution of adaptive pigmentation in vertebrates. Heredity. 2006;97:222–34. 10.1038/sj.hdy.6800861 - DOI - PubMed
    1. Hof AEV, Campagne P, Rigden DJ, Yung CJ, Lingley J, Quail MA, et al. The industrial melanism mutation in British peppered moths is a transposable element. Nature. 2016;534:102–5. 10.1038/nature17951 - DOI - PubMed
    1. Jones MR, Milles LS, Alves PC, Callahan CM, Alves JM, Lafferty DJR, et al. Adaptive introgression underlies polymorphic seasonal camouflage in snowshoe hares. Science. 2018;1358:1355–8. - PubMed
    1. Tishkoff SA, Reed FA, Ranciaro A, Voight BF, Babbitt CC, Silverman JS, et al. Convergent adaptation of human lactase persistence in Africa and Europe. Nat Genet. 2007;39(1):31–40. 10.1038/ng1946 - DOI - PMC - PubMed
    1. Magwire MM, Fabian DK, Schweyen H, Cao C, Longdon B, Bayer F, et al. Genome-Wide Association Studies Reveal a Simple Genetic Basis of Resistance to Naturally Coevolving Viruses in Drosophila melanogaster. PLoS Genet. 2012;8(11): e1003057 10.1371/journal.pgen.1003057 - DOI - PMC - PubMed

Publication types

LinkOut - more resources