. 2019 Feb 4;15(2):e1006226.
doi: 10.1371/journal.pcbi.1006226. eCollection 2019 Feb.

Mapping DNA sequence to transcription factor binding energy in vivo

Affiliations

Mapping DNA sequence to transcription factor binding energy in vivo

Stephanie L Barnes et al. PLoS Comput Biol. .

Abstract

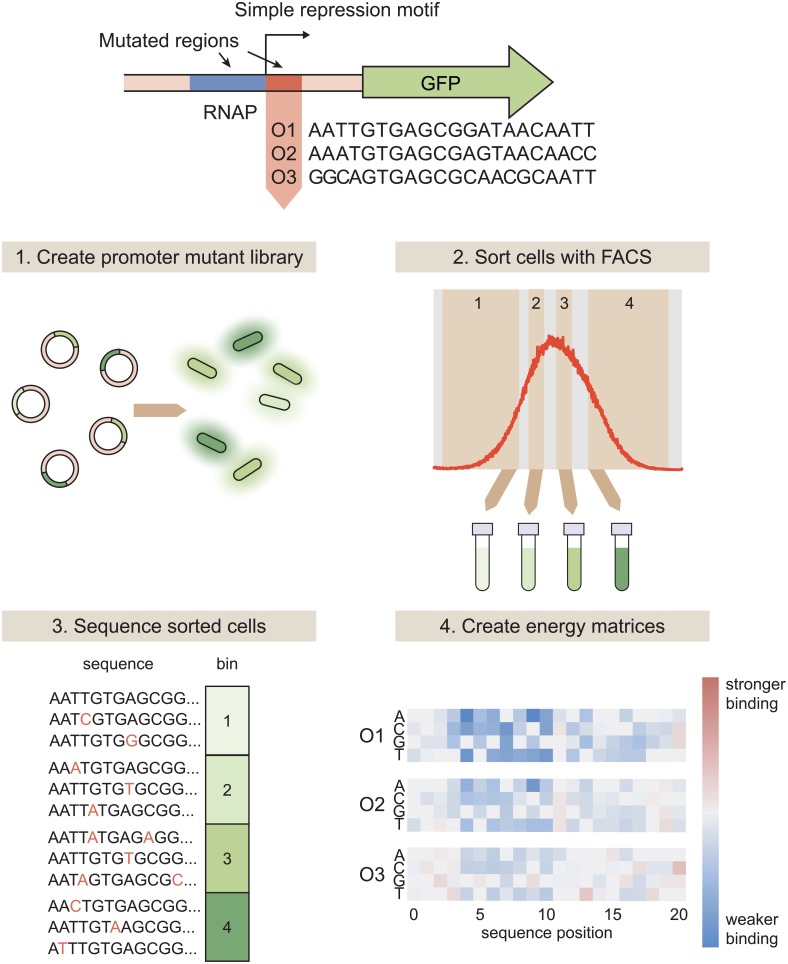
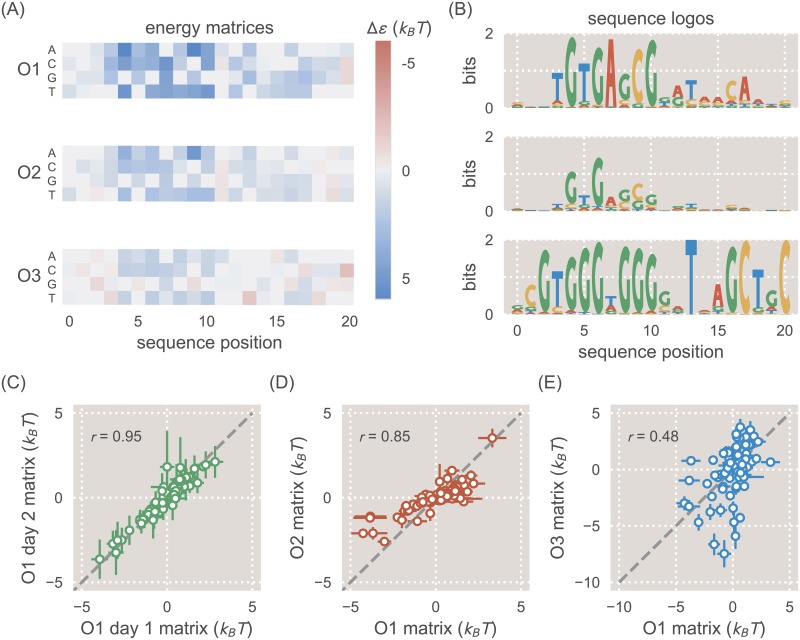
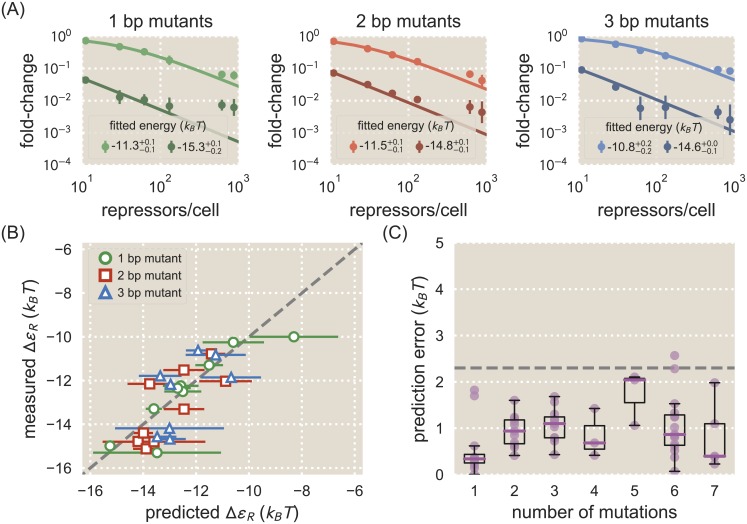
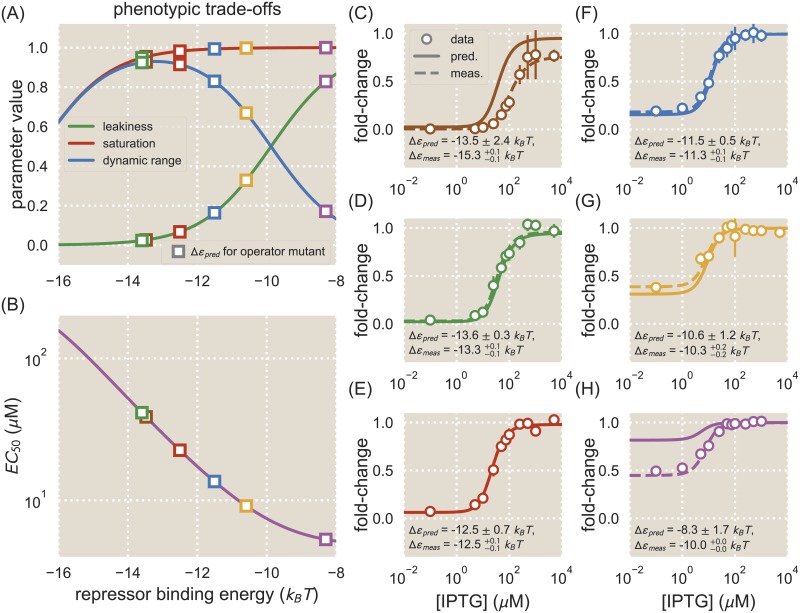
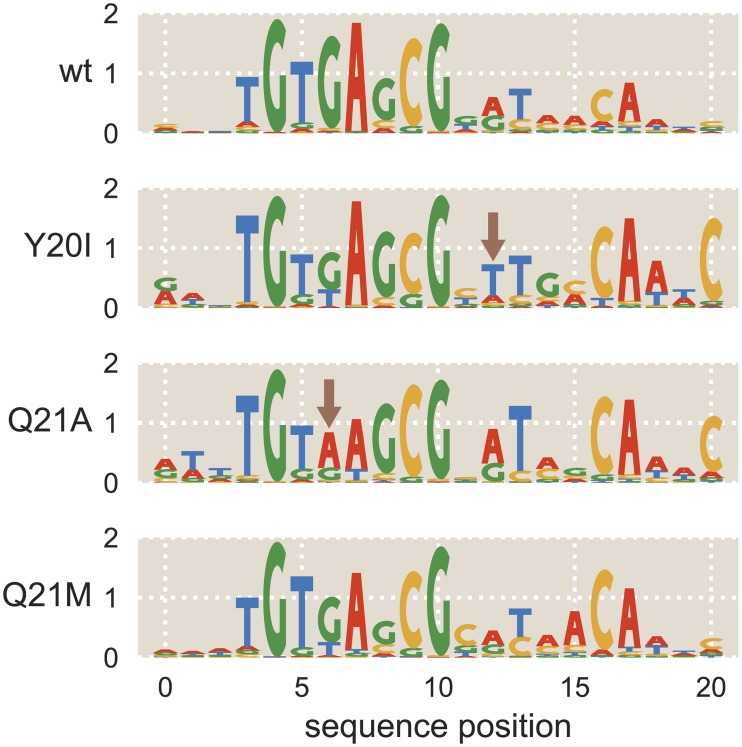
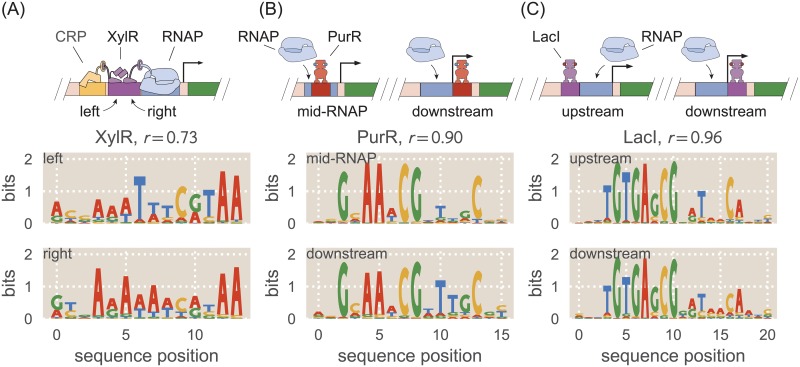
Despite the central importance of transcriptional regulation in biology, it has proven difficult to determine the regulatory mechanisms of individual genes, let alone entire gene networks. It is particularly difficult to decipher the biophysical mechanisms of transcriptional regulation in living cells and determine the energetic properties of binding sites for transcription factors and RNA polymerase. In this work, we present a strategy for dissecting transcriptional regulatory sequences using in vivo methods (massively parallel reporter assays) to formulate quantitative models that map a transcription factor binding site's DNA sequence to transcription factor-DNA binding energy. We use these models to predict the binding energies of transcription factor binding sites to within 1 kBT of their measured values. We further explore how such a sequence-energy mapping relates to the mechanisms of trancriptional regulation in various promoter contexts. Specifically, we show that our models can be used to design specific induction responses, analyze the effects of amino acid mutations on DNA sequence preference, and determine how regulatory context affects a transcription factor's sequence specificity.


Conflict of interest statement

The authors have declared that no competing interests exist.

Figures

Fig 1
Fig 1. Using Sort-Seq to obtain energy matrices.
To begin, we design a simple repression motif in which a repressor binding site is placed immediately downstream of the RNAP site. When RNAP binds, it initiates transcription of the GFP reporter gene. We analyze simple repression constructs using each of the three natural lac operators, O1, O2, and O3. Sort-Seq then proceeds as follows. 1. We create a mutant library in which the RNAP and operator sequences are randomly mutated at a rate of approximately 10%, and transform this library into a cell population such that each cell contains a different mutant operator sequence. 2. To measure gene expression, we sort the cell population into bins based on fluorescence level. 3. We then sequence variant promoter sequences within each bin. The bin in which each promoter is found serves as a measure of that promoter’s activity. 4. From this information, we can infer an energy matrix for the repressor binding site indicating which mutations result in a higher or lower binding energy relative to the reference sequence. Energy matrices can either be inferred using all of the Sort-Seq data, or the Sort-Seq data can be split into multiple “replicates” to obtain replicate energy matrices that can be used to estimate error.
Fig 2
Fig 2. Energy matrices and sequence logos for the natural lac operators.
A: Energy matrices show how mutations can be expected to affect binding energy. Reference sequences for each energy matrix (either the O1, O2, or O3 sequence) have been set at 0 kBT (gray squares), and the energy values at all other positions of the matrix are thus relative to the reference sequence. Red squares represent mutations that create a stronger binding energy than the reference sequence, and blue squares represent mutations that create a weaker binding energy. In columns where multiple squares are gray, this indicates that there is no significant change in binding energy relative to the reference sequence. B: While the energy matrices are qualitatively similar for all three operators, the sequence logos indicate clear differences in the information that can be provided by each operator. The O1 and O2 operators produce similar sequence logos, but the O3 sequence logo incorrectly predicts the preferred binding sequence for LacI. The O3 sequence logo also indicates a much lower information content than for O1 and O2. C: Two separate biological replicates of a matrix derived from the O1 reference sequence (with repressor copy number R = 62) are plotted against one another. D: The O1 energy matrix is plotted against the O2 energy matrix, both derived from strains with R = 130. E: The O1 energy matrix is plotted against the O3 energy matrix, both derived from strains with R = 130.
Fig 3
Fig 3. Energy matrix predictions compared to binding energies derived from fold-change data.
A: Fold-change data were obtained by flow cytometry for each of the mutant operators by measuring their respective fluorescence levels at multiple LacI copy numbers and normalizing by the fluorescence when R = 0. The solid lines in each plot represent a fold-change curve that has been fitted to the data set to obtain a binding energy measurement. Each plot shows data and fits for two operator mutants, one weak and one strong, for 1 bp (left), 2 bp (middle), and 3 bp (right) mutants. The fitted energy values are shown for each mutant, where the superscripts and subscripts represent the 95% confidence interval for the fit. All remaining data is shown in S2–S4 Figs. Approximately 30 operator mutants were measured in total. We note that lower expression measurements are less accurate than higher expression measurements due to autofluorescence and limitations in the flow cytometer’s ability to measure weak signals. This adversely affects the accuracy of fold-change values for strongly repressed strains. B: The measured binding energy values ΔεR (y axis) are plotted against binding energy values predicted from an energy matrix derived from the O1 operator (x axis). The horizontal error bars represent the standard deviation of predictions made from three matrix replicates obtained by splitting the Sort-Seq data into three groups. MCMC was used to obtain a scaling factor for each matrix to convert it into kBT units. The vertical error bars represent the 95% confidence interval of the fitted ΔεR values (where not visible, these error bars are smaller than the marker). While the quality of the binding energy predictions does appear to degrade as the number of mutations relative to O1 is increased, the O1 energy matrix is still able to approximately predict the measured values. C: Binding energies for each mutant were predicted using both the O1 and O2 energy matrices and compared against measured binding energy values. The prediction error, defined as the magnitude of the difference in kBT between a predicted binding energy and the corresponding measured binding energy, is plotted here against the number of mutations relative to the reference sequence whose energy matrix was used to make the prediction. Each data point is shown in purple, and box plots representing the data are overlaid to clearly show the median error and variability in error. For sequences with 4 or fewer mutations, the median prediction error is consistently lower than 1.5 kBT. The dashed horizontal line represents the point at which the error corresponds to an approximately 10-fold difference in fold-change.
Fig 4
Fig 4. Energy matrix predictions can be used to design phenotypic responses.
Phenotypic parameters exhibit trade-offs as ΔεR is varied. A: The values of the leakiness, saturation, and dynamic range are plotted as a function of transcription factor binding energy, ΔεR, for a strain with repressor copy number R = 130. Different values of ΔεR exhibit combinations of different phenotypic properties. Several operators were chosen whose predicted binding energies (squares) result in a range of phenotypes. B: The value of the [EC50] is plotted as a function of ΔεR for a strain with R = 130. The [EC50] decreases as the value of ΔεR increases. C-H: Operators with different values of ΔεR were chosen to have varying induction responses based on the phenotypic trade-offs shown in (A) and (B). The fold-change is shown for each operator as IPTG concentrations are varied. The fold-change data are overlaid with the predicted induction curve (solid) and an induction curve plotted using the measured binding energy for the operator (dashed). Shown are the predicted binding energy (where the error represents the standard deviation of predictions) and the fitted binding energy (where the superscripts and subscripts represent the 95% confidence intervals of the fits).
Fig 5
Fig 5. Mutations to LacI DNA-binding domain cause subtle changes to sequence specificity.
Mutations were made to residues 20 and 21 of LacI, both of which lie within the DNA-binding domain. The mutations Y20I and Q21A weaken the repressor-operator binding energy, while the mutation Q21M strengthens the binding energy [50]. The sequence preferences of each mutant are represented as sequence logos. Y20I exhibits minor changes to specificity in low-information regions of the binding site, and Q21A experiences a change to specificity within a high-information region of the binding site (see arrows). Specifically, Q21A prefers A at operator position 6 while the wild-type repressor prefers G at this position.
Fig 6
Fig 6. Regulatory context can alter sequence preference.
Sequence logos were obtained for the same transcription factors in different regulatory contexts and compared against one another. The Pearson’s correlation coefficient r between energy matrices is noted for each pair of binding sites. A: Sequence logos are shown for the two adjacent binding sites for the activator XylR in the xylE promoter, shown schematically at top. The sequence logos for the two binding sites indicate that they have significantly different sequence preferences. B: Sequence logos are shown for the PurR binding site in the purT promoter and a PurR binding site for a synthetic simple repression promoter in which the binding site is positioned differently, shown schematically at top. The sequence logos for the two binding sites indicate nearly identical sequence preferences. C: Sequence logos are shown for a LacI binding site upstream of the RNAP binding site and a LacI binding site downstream of the RNAP. Although regulatory mechanisms differ between these two binding sites, their sequence logos are nearly identical.

References

    1. Gama-castro S, Salgado H, Santos-zavaleta A, Ledezma-tejeida D, Mu L, Garc JS, et al. RegulonDB version 9.0: high-level integration of gene regulation, coexpression, motif clustering and beyond. Nucleic Acids Research. 2016;44:133–143. 10.1093/nar/gkv1156 - DOI - PMC - PubMed
    1. Oehler S, Eismann ER, Krämer H, Müller-Hill B. The three operators of the lac operon cooperate in repression. The EMBO journal. 1990;9(4):973–979. 10.1002/j.1460-2075.1990.tb08199.x - DOI - PMC - PubMed
    1. Gerdes K, Christensen SK, Lobner-Olesen A. Prokaryotic toxin-antitoxin stress response loci. Nature Reviews Microbiology. 2005;3:371–382. 10.1038/nrmicro1147 - DOI - PubMed
    1. Alekshun MN, Levy SB. Regulation of chromosomally mediated multiple antibiotic resistance: The mar regulon. Antimicrobial Agents and Chemotherapy. 1997;41(10):2067–2075. 10.1128/AAC.41.10.2067 - DOI - PMC - PubMed
    1. Minchin SD, Busby SJW. Analysis of mechanisms of activation and repression at bacterial promoters. Methods. 2009;47(1):6–12. 10.1016/j.ymeth.2008.10.012 - DOI - PubMed

Publication types

MeSH terms