. 2019 Apr;179(4):1444-1456.
doi: 10.1104/pp.18.01482. Epub 2019 Feb 4.

Single-Cell RNA Sequencing Resolves Molecular Relationships Among Individual Plant Cells

Affiliations

Single-Cell RNA Sequencing Resolves Molecular Relationships Among Individual Plant Cells

Kook Hui Ryu et al. Plant Physiol. 2019 Apr.

Abstract

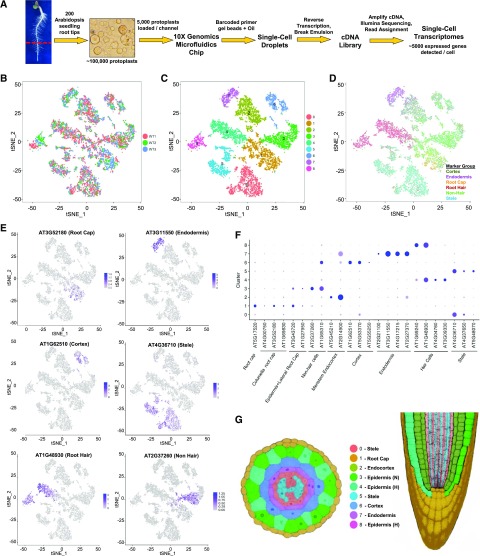
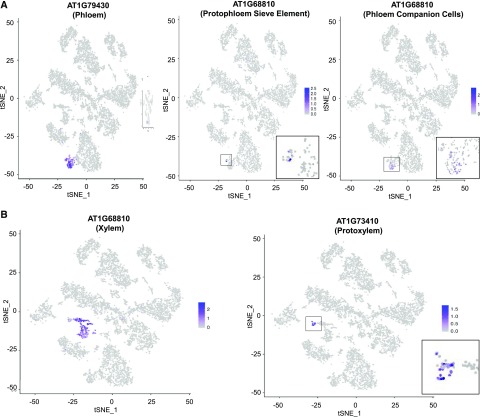
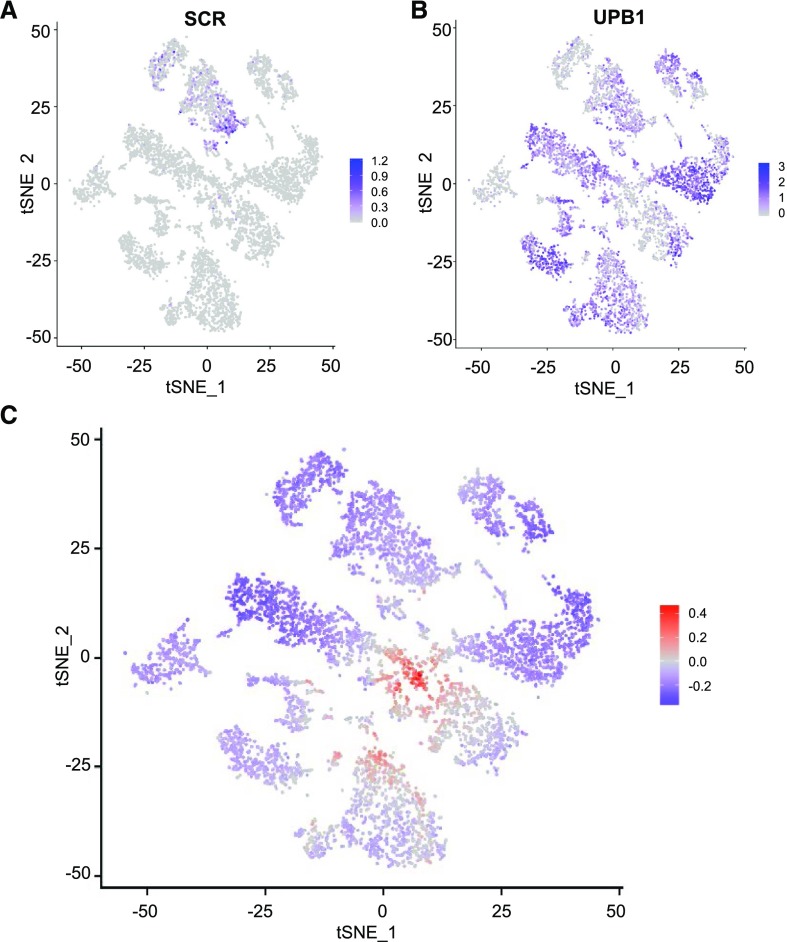
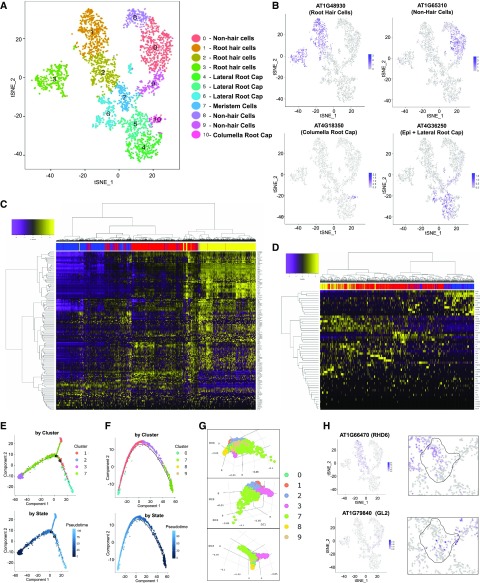
Single-cell RNA sequencing (scRNA-seq) has been used extensively to study cell-specific gene expression in animals, but it has not been widely applied to plants. Here, we describe the use of a commercially available droplet-based microfluidics platform for high-throughput scRNA-seq to obtain single-cell transcriptomes from protoplasts of more than 10,000 Arabidopsis (Arabidopsis thaliana) root cells. We find that all major tissues and developmental stages are represented in this single-cell transcriptome population. Further, distinct subpopulations and rare cell types, including putative quiescent center cells, were identified. A focused analysis of root epidermal cell transcriptomes defined developmental trajectories for individual cells progressing from meristematic through mature stages of root-hair and nonhair cell differentiation. In addition, single-cell transcriptomes were obtained from root epidermis mutants, enabling a comparative analysis of gene expression at single-cell resolution and providing an unprecedented view of the impact of the mutated genes. Overall, this study demonstrates the feasibility and utility of scRNA-seq in plants and provides a first-generation gene expression map of the Arabidopsis root at single-cell resolution.


Figures

Figure 1.
Figure 1.
Isolation and cluster analysis of single-cell transcriptomes from wild-type Arabidopsis roots. A, Workflow used for scRNA-seq to obtain transcriptomes from individual Arabidopsis root cells. B, tSNE projection plot showing dimensional reduction of the distribution of 7522 individual wild-type cell transcriptomes from three biological replicates. Cell transcriptomes derived from each replicate are indicated by different colors (red = replicate 1; green = replicate 2; blue = replicate 3). C, tSNE projection plot showing nine major clusters of the 7522 individual wild-type root cell transcriptomes. D, tSNE projection plot showing the combined transcript accumulation from all marker genes tested (listed in Supplemental Table S3) on the 7522 wild-type transcriptomes, organized by the tissue/cell type of the marker gene group (cortex, endodermis, root cap, root-hair, nonhair, and stele marker gene sets). E, tSNE projection plots showing transcript accumulation for specific tissue/cell marker genes in individual cells. Color intensity indicates the relative transcript level for the indicated gene in each cell. The tissue/cell types known to preferentially express each marker gene are given in parentheses (details available in Supplemental Table S3). Additional marker gene plots are provided in Supplemental Figure S2. F, Accumulation of marker gene transcripts by cluster. This dot plot indicates the fraction of cells in each cluster expressing a given marker (dot size) and the level of marker gene expression (dot intensity) for 24 genes known to exhibit preferential expression in distinct tissue/cell types (Supplemental Table S3). G, Assignment of cell clusters to root tissues. Depictions of transverse (left) and longitudinal (right) sections of the Arabidopsis primary root showing tissues in colors corresponding to the nine-cluster plot in C. N, Nonhair cells; H, root-hair cells. Note that cells corresponding to cluster 8 are not shown on the root images, because this cluster was found to contain mature root-hair cells which are not represented in these root images.
Figure 2.
Figure 2.
Stele marker gene expression on tSNE projection plots define clusters of distinct tissue and cell types in the stele. A, Phloem tissue/cell types. B, Xylem tissue/cell types. Color intensity indicates the relative transcript level for the indicated gene in each cell. The tissue/cell types known to preferentially express each marker gene are indicated in parentheses (Supplemental Table S4). Insets show higher resolution images of the expressing cell clusters. Additional stele marker gene plots are provided in Supplemental Figure S3.
Figure 3.
Figure 3.
Intracluster developmental variation in gene expression. A and B, tSNE projection plots showing transcript accumulation across the single cell population for the early ground tissue marker gene SCARECROW (SCR; A) and the elongation zone marker gene UPBEAT (UPB; B). Color intensity indicates the relative transcript level for the indicated gene in each cell. C, tSNE projection plot showing relative differentiation status of all cells in the population. The log ratio of meristematic zone gene expression to differentiation zone gene expression was calculated for each cell and plotted using the indicated color scheme (red indicates preferential meristem expressed genes; blue indicates preferential differentiation zone-expressed genes).
Figure 4.
Figure 4.
Analysis of single-cell transcriptomes from root epidermis and root cap tissues. A, tSNE projection plot showing 11 major clusters of cell transcriptomes. The specific cell/tissue types assigned to each cluster are indicated. B, tSNE projection plots showing accumulation of epidermal and root cap marker gene transcripts in individual cells. Color intensity indicates the relative transcript level for the indicated gene in each cell. The cell types known to preferentially express each marker gene are indicated in parentheses (details available in Supplemental Table S3). Additional marker gene plots are provided in Supplemental Figure S4. C, Heat maps illustrating transcript accumulation for 150 previously defined root-hair expressed genes (Bruex et al., 2012) in the cells from the root-hair clusters (clusters 1, 2, 3). The bar at the top of the map indicates the cluster origin for each cell (blue = cluster 2; red = cluster 1; yellow = cluster 3). D, Heat maps illustrating transcript accumulation for 52 previously defined nonhair expressed genes (Bruex et al., 2012) in the cells from the nonhair clusters (clusters 0, 8, 9). The bar at the top of the map indicates the cluster origin for each cell (yellow = cluster 9; red = cluster 0; blue = cluster 8). E, Pseudotime analysis using Monocle for cell transcriptomes in clusters 1,2,3,7 shows the developmental trajectory for the differentiating root-hair cells. F, Pseudotime analysis using Monocle for cell transcriptomes in clusters 0,7,8,9 shows the developmental trajectory for the differentiating nonhair cells. G, Diffusion plot of cells from clusters 0,1, 2, 3, 7, 8, and 9 using Destiny to indicate gene expression relationships among cells. Each panel represents a different two-dimensional view of a three-dimensional plot. H, tSNE projection plots showing transcript accumulation for early markers of root-hair (ROOT HAIR DEFECTIVE 6 [RHD6]) and nonhair (GLABRA 2 [GL2]) cell differentiation known to initiate expression in the meristematic epidermal cells. The right panels show a magnified view of the center of the plot, with the meristem cell cluster (cluster 7) outlined. tSNE projection plots showing additional early marker gene plots for root-hair (MYC-RELATED PROTEIN 1 and ENHANCER OF GLABRA 3) and nonhair (TRANSPARENT TESTA GLABRA 2 and ENHANCER OF TRY AND CPC 1) cell markers are provided in Supplemental Figure S5.
Figure 5.
Figure 5.
Identification of putative QC cells. A, Coexpression analysis of early root-hair and early nonhair transcriptional regulators in cell transcriptomes from clusters 0,1,2,7,8,9. tSNE projection plots showing cells that express at least one of the early root-hair cell markers RHD6, MYC1, and EGL3 (blue dots) and cells that express at least one of the early nonhair cell markers GL2, TTG2, and ETC1 (yellow dots). Red dots indicate cells that express at least one early root-hair marker and at least one early nonhair marker. Right is a magnified view of the cluster 7 region of the plot. Arrows indicate the location of the two putative quiescent center cells. B, tSNE projection plot showing transcript accumulation across the single cell population for known QC genes. Color intensity indicates the relative transcript level in each cell for the PLETHORA 1 (PLT1), PERIANTHIA (PAN), and BABY BOOM (BBM) genes. Additional QC marker gene plots are provided in Supplemental Figure S6. Right panels present a magnified view of the cluster 7 region of the plot. Arrows indicate the location of the two putative quiescent center cells. C, Aggregate expression data from 52 QC marker genes among 23 cells of cluster 7. Color intensity indicates the relative number and level of QC marker gene expression in each of the numbered cells. Arrows indicate the location of the two putative quiescent center cells. D, tSNE projection plot showing transcript accumulation across the entire wild-type root single cell population (from Fig. 1) for PLP6, a putative QC-specific gene. The locations of the two putative QC cells are indicated by an arrow.
Figure 6.
Figure 6.
Comparative single-cell transcriptome analysis of wild-type and root epidermis mutant roots. A, tSNE projection plot showing distribution of the wild-type (WT), rhd6 mutant, and gl2 mutant cell transcriptomes. Cell transcriptomes derived from each genotype are indicated by different colors (red = gl2; green = rhd6; blue = wild type). B, tSNE projection plot showing 12 major clusters of cell transcriptomes from the wild type, rhd6 mutant, and gl2 mutant. The specific tissue/cell types assigned to each cluster are indicated. C, tSNE projection plots showing accumulation of root-hair and nonhair marker gene transcripts in individual cell transcriptomes from wild-type, rhd6 mutant, and gl2 mutant. Color intensity indicates the relative transcript level for the indicated gene in each cell for each genotype (red = gl2; green = rhd6; blue = wild type). Additional marker gene plots are provided in Supplemental Figure S9. D, tSNE projection plots showing transcript accumulation from wild-type, rhd6 mutant, and gl2 mutant cell transcriptomes for root-hair and nonhair marker genes that initiate expression at a relatively early stage. Color intensity indicates the relative transcript level for the indicated gene in each cell for each genotype (red = gl2; green = rhd6; blue = wild type). Additional marker gene plots are provided in Supplemental Figure S9.

Comment in

References

    1. Bernhardt C, Zhao M, Gonzalez A, Lloyd A, Schiefelbein J (2005) The bHLH genes GL3 and EGL3 participate in an intercellular regulatory circuit that controls cell patterning in the Arabidopsis root epidermis. Development 132: 291–298 - PubMed
    1. Birnbaum K, Jung JW, Wang JY, Lambert GM, Hirst JA, Galbraith DW, Benfey PN (2005) Cell type-specific expression profiling in plants via cell sorting of protoplasts from fluorescent reporter lines. Nat Methods 2: 615–619 - PubMed
    1. Brady SM, Orlando DA, Lee JY, Wang JY, Koch J, Dinneny JR, Mace D, Ohler U, Benfey PN (2007) A high-resolution root spatiotemporal map reveals dominant expression patterns. Science 318: 801–806 - PubMed
    1. Brennecke P, Anders S, Kim JK, Kołodziejczyk AA, Zhang X, Proserpio V, Baying B, Benes V, Teichmann SA, Marioni JC, Heisler MG (2013) Accounting for technical noise in single-cell RNA-seq experiments. Nat Methods 10: 1093–1095 - PubMed
    1. Bruex A, Kainkaryam RM, Wieckowski Y, Kang YH, Bernhardt C, Xia Y, Zheng X, Wang JY, Lee MM, Benfey P, et al. (2012) A gene regulatory network for root epidermis cell differentiation in Arabidopsis. PLoS Genet 8: e1002446. - PMC - PubMed

Publication types