. 2019 May 15;25(10):2996-3005.
doi: 10.1158/1078-0432.CCR-18-3309. Epub 2019 Feb 4.

Single-Cell Profiling of Cutaneous T-Cell Lymphoma Reveals Underlying Heterogeneity Associated with Disease Progression

Affiliations

Single-Cell Profiling of Cutaneous T-Cell Lymphoma Reveals Underlying Heterogeneity Associated with Disease Progression

Nicholas Borcherding et al. Clin Cancer Res. .

Abstract

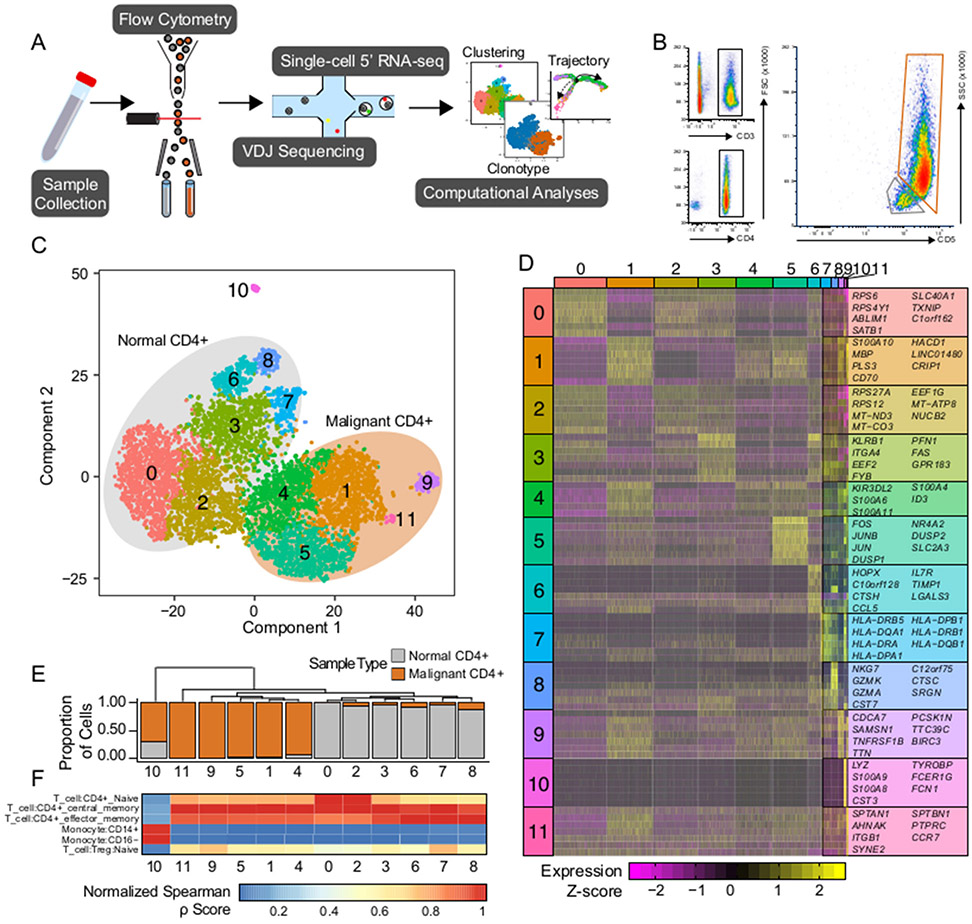
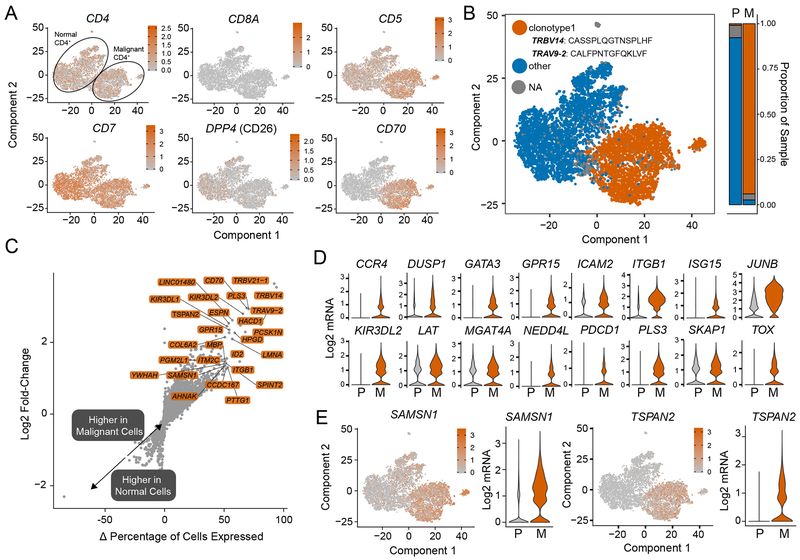
Purpose: Cutaneous T-cell lymphomas (CTCL), encompassing a spectrum of T-cell lymphoproliferative disorders involving the skin, have collectively increased in incidence over the last 40 years. Sézary syndrome is an aggressive form of CTCL characterized by significant presence of malignant cells in both the blood and skin. The guarded prognosis for Sézary syndrome reflects a lack of reliably effective therapy, due, in part, to an incomplete understanding of disease pathogenesis.

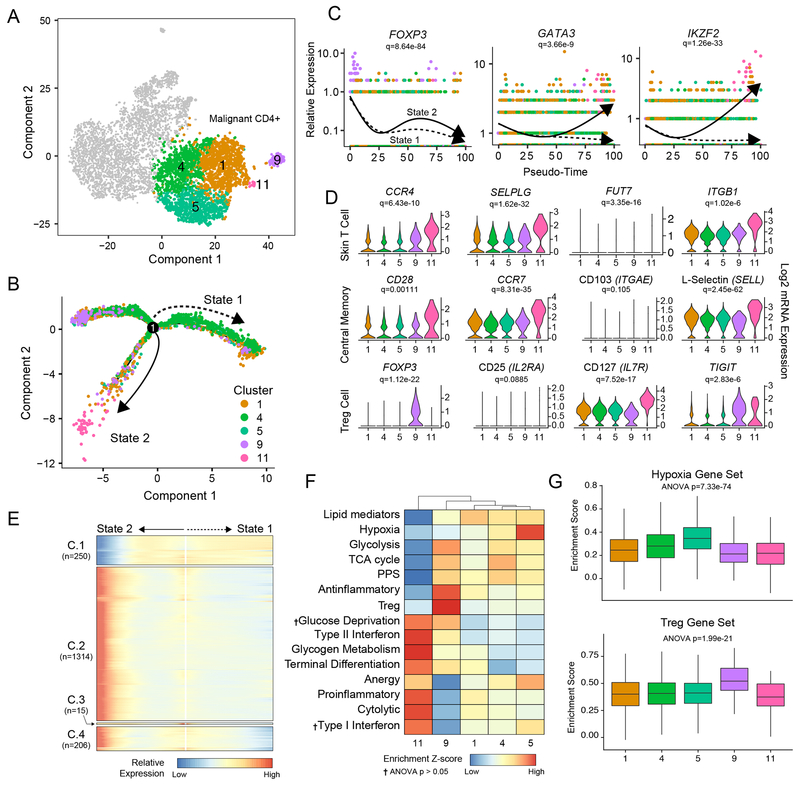
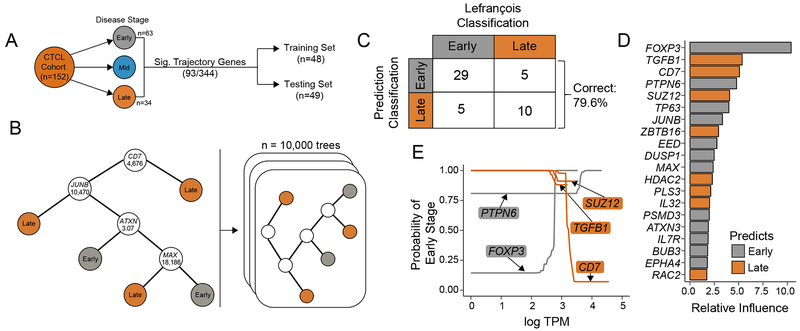
Experimental design: Using single-cell sequencing of RNA and the machine-learning reverse graph embedding approach in the Monocle package, we defined a model featuring distinct transcriptomic states within Sézary syndrome. Gene expression used to differentiate the unique transcriptional states were further used to develop a boosted tree classification for early versus late CTCL disease.

Results: Our analysis showed the involvement of FOXP3 + malignant T cells during clonal evolution, transitioning from FOXP3 + T cells to GATA3 + or IKZF2 + (HELIOS) tumor cells. Transcriptomic diversities in a clonal tumor can be used to predict disease stage, and we were able to characterize a gene signature that predicts disease stage with close to 80% accuracy. FOXP3 was found to be the most important factor to predict early disease in CTCL, along with another 19 genes used to predict CTCL stage.

Conclusions: This work offers insight into the heterogeneity of Sézary syndrome, providing better understanding of the transcriptomic diversities within a clonal tumor. This transcriptional heterogeneity can predict tumor stage and thereby offer guidance for therapy.


Conflict of interest statement

Declaration of Interests

The authors declare no competing interests

Figures

Figure 1
Figure 1. Single-cell isolation and sequencing of peripheral blood and Sézary Syndrome cells
(A) Schematic of the isolation, sequencing, and analysis of the single-cells. (B) Flow cytometry gating of the patient sample to isolate peripheral blood and tumor cells. (C) tSNE projection of patient sample with normal peripheral blood samples (n=4436) outline in grey and tumorigenic CD4 cells (n=3443) in orange. (D) Unique significant cluster genes without overlap between clusters and based on the Wilcoxon rank sum test, adjusted P-value < 1e-50. (E) Phylogenic tree of cluster identities based on mean mRNA values in the cluster with corresponding cluster proportion of cells composition. (F) Quantile-normalized Spearman correlation values of predicted immune cell phenotype based on SingleR algorithm for each tSNE cluster.
Figure 2
Figure 2. Transcriptomic comparison of malignant versus normal CD4+ T cells
(A) tSNE projects of common markers used to diagnose CTCL (B) VDJ sequencing of malignant CD4+ T cells examining the distribution of a single prominent clonotype in the malignant T cells (orange) (C) Log2-fold change expression versus the difference in the percent of cell expressing the gene comparing malignant to normal peripheral blood CD4+ T cells (Δ percentage of cells expressed). Genes labeled have a Δ percentage of cells expressed > 50%, log2-fold change > 1 and an adjusted p-value < 0.05. (D) Potential novel markers of CTCL cells with a Δ percentage of cells expressed greater than 50% and adjusted p-values < 1e-100. (E) Violin plots of previously identified markers of CTCL (adjusted P < 1e-10).
Figure 3
Figure 3. Transcriptional heterogeneity in malignant CD4+ T cells.
(A) tSNE projection of patient malignant CD4 cells (n=3,443). (B) Trajectory of malignant cells from clusters 1, 4, 5, 9, and 11 using the Monocle 2 algorithm, solid and dotted line represent distinct cell trajectories defined by single-cell transcriptomes (C) Pseudo-time projections of major immune transcriptional drivers in the malignant CD4+ T cells, demonstrating the change in relative expression over pseudo-time for the distinct transcriptional states, with each point representing a single cell. Significance based on differential testing by cluster identification used to generate pseudo-time and adjusted for multiple comparisons. (D) Selection of genes by cluster identity for skin-homing, central memory, and regulatory T cell phenotypes. Significance based on the pseudo-time generated by the Monocle 2 algorithm and correct for multiple comparisons. (E) Relative expression heatmap of significant (Q < 1e-4) genes based on branch expression analysis modeling comparing the two SS cell states and were used in the ordering of the pseudo-time variable. (F) Z-score transformed enrichment score for ssGSEA of T-cell-related gene sets in the malignant clusters. Pathways were significant with P < 0.05, as assessed by one-way ANOVA with multiple comparison adjustment unless indicated by †. (G) Hypoxia (upper panel) and Treg (lower panel) gene set enrichment across malignant SS clusters.
Figure 4
Figure 4. Predictive clinical correlates in CTCL using SS single-cell heterogeneity.
(A) Representative schematic of the composition of SRP114956 and the separation into training and testing sets for prediction of clinical stage. (B) A hypothetical classification decision tree is constructed to predict the CTCL stage based on RNA-seq expression data for each patient in the training set (n=48). At each branch in the tree, the patient’s transcripts per million (TPM) for a given gene are compared to a cutoff value. If the patient’s TPM are below the cutoff, the algorithm proceeds to the left and vice versa, until a terminal classification node is reached. A series of 10,000 boosted trees are grown in sequence utilizing information from previous trees, improving upon previous misclassifications. (C) The independent test patient data set (n=49) is applied to the 10,000 boosted classification trees and predicted disease states are compared to original classifications. Overall, the boosted decision trees correctly classify 79.6% of the disease states. (D) The 20 most important genes in generating the boosted classification trees are quantified and displayed in a ranked variable importance plot. Bar color logic is described below. (E) Partial dependence plots for the five most important variables represent how different levels of gene expression (log TPM) effect the probability of early-disease classification after integrating out the expression of all other genes. Genes with high expression predictive of early disease are colored in grey, while high gene expression more predictive of late stage disease are colored in orange.

References

    1. Willemze R, Jaffe ES, Burg G, Cerroni L, Berti E, Swerdlow SH, et al. WHO-EORTC classification for cutaneous lymphomas. Blood. 2005. page 3768–85. - PubMed
    1. Kirsch IR, Watanabe R, O’Malley JT, Williamson DW, Scott LL, Elco CP, et al. TCR sequencing facilitates diagnosis and identifies mature T cells as the cell of origin in CTCL. Sci Transl Med. 2015;7:308ra158. - PMC - PubMed
    1. Clark RA, Shackelton JB, Watanabe R, Calarese A, Yamanaka KI, Campbell JJ, et al. High-scatter T cells: A reliable biomarker for malignant T cells in cutaneous T-cell lymphoma. Blood. 2011;117:1966–76. - PMC - PubMed
    1. Ormsby A, Bergfeld WF, Tubbs RR, Hsi ED. Evaluation of a new paraffin-reactive CD7 T-cell deletion marker and a polymerase chain reaction-based T-cell receptor gene rearrangement assay: Implications for diagnosis of mycosis fungoides in community clinical practice. J Am Acad Dermatol. 2001;45:405–13. - PubMed
    1. Wilcox RA. Cutaneous T-cell lymphoma: 2017 update on diagnosis, risk-stratification, and management. Am J Hematol. 2017;92:1085–102. - PubMed

Publication types

MeSH terms

Substances