. 2019 Feb 19;116(8):3294-3299.
doi: 10.1073/pnas.1814670116. Epub 2019 Feb 4.

Ca2+ allostery in PTH-receptor signaling

Affiliations

Ca2+ allostery in PTH-receptor signaling

Alex D White et al. Proc Natl Acad Sci U S A. .

Abstract

The parathyroid hormone (PTH) and its related peptide (PTHrP) activate PTH receptor (PTHR) signaling, but only the PTH sustains GS-mediated adenosine 3',5'-cyclic monophosphate (cAMP) production after PTHR internalization into early endosomes. The mechanism of this unexpected behavior for a G-protein-coupled receptor is not fully understood. Here, we show that extracellular Ca2+ acts as a positive allosteric modulator of PTHR signaling that regulates sustained cAMP production. Equilibrium and kinetic studies of ligand-binding and receptor activation reveal that Ca2+ prolongs the residence time of ligands on the receptor, thus, increasing both the duration of the receptor activation and the cAMP signaling. We further find that Ca2+ allostery in the PTHR is strongly affected by the point mutation recently identified in the PTH (PTHR25C) as a new cause of hypocalcemia in humans. Using high-resolution and mass accuracy mass spectrometry approaches, we identified acidic clusters in the receptor's first extracellular loop as key determinants for Ca2+ allosterism and endosomal cAMP signaling. These findings coupled to defective Ca2+ allostery and cAMP signaling in the PTHR by hypocalcemia-causing PTHR25C suggest that Ca2+ allostery in PTHR signaling may be involved in primary signaling processes regulating calcium homeostasis.

Keywords: Ca2+ allosterism; GPCR signaling; PTH; PTH receptor; endosomal cAMP signaling.


Conflict of interest statement

The authors declare no conflict of interest.

Figures

Fig. 1.
Fig. 1.
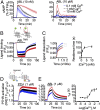
Allosteric action of extracellular Ca2+ on the PTH signaling. (A) Averaged cAMP responses over 35 min in HEK293 cells stably expressing the PTHR stimulated with 10 pM, 1 nM, and 10 nM PTH in the presence of a range of [Ca2+]. (B) cAMP responses for experiments represented in A, determined by measuring the area under the curve (a.u.c) from 0 to 35 min (Left). The effect of increasing concentration of Ca2+ on the PTH (10 nM)-mediated cAMP (Right). (C) Saturation-binding isotherms of the PTHTMR (where TMR represents tetramethylrhodamine) to the PTHR stably expressed in HEK293 cells with a range of [Ca2+]. (D) Averaged time courses of venus-tagged mini Gs (mGsvenus) recruitment to the PTHRCFP (where CFP stands for cyan fluorescent protein) in response to the PTH and in the presence of a range of extracellular [Ca2+] and measured by fluorescence resonance energy transfer (FRET) in HEK293 cells. Data represent the mean ± SEM of n = 3 carried out in triplicate for C and n = 812 cells/experiments for A, B, and D.
Fig. 2.
Fig. 2.
Ligand residence time determined by Ca2+ allostery. (A) Averaged cAMP response over 35 min in HEK293 cells stably expressing the PTHR stimulated with 10 nM and 10 pM ABL in the presence of a range of [Ca2+]. (B) Time courses of ABL-TMR (ABLTMR) binding to the PTHR-GFP expressed in HEK293 cells. Measurements were recorded in single cells continuously perfused with a buffer or 1 µM ABLTMR (horizontal bar) in the presence of varying [Ca2+]. (C) Comparison of ligand dissociation time courses from experiments in D (Left) and the corresponding residence time of the ligand, calculated as the inverse of the rate constant of ligand dissociation (1/τoff) as a function of [Ca2+] (Right). (D and E) Effects of Ca2+ on time courses of receptor activation/deactivation using the PTHRCFP/YFP (where YFP represents yellow fluorescent protein) stably expressed in HEK293 cells. Single cells were continuously perfused with a buffer or pulsed with 1 µM PTH (D) of ABL (E, Left) for the time indicated by the horizontal bar. Rate constants (τoff) of receptor deactivation (E, Right) as a function of [Ca2+] calculated from experiments similar to E (Left). Data represent the mean ± SEM of n > 3 and n = 8–30 cells/experiment.
Fig. 3.
Fig. 3.
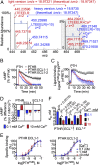
Involvement of the receptor’s ECL1 in Ca2+ allostery. (A) Representative MS of the tryptic digest of the PTHR from SILAC experiments showing the identified peptide 256LTEEELR262 located within the ECL1 of the receptor. The free and Ca2+-bound versions of the peptide were detected simultaneously. The red and blue colors represent light and heavy versions of the peptide. The theoretical mass-to-charge differences (Δm/z) between free and Ca2+-bound peptides are shown for both light and heavy versions. The Δm/z values of the corresponding light and heavy peptides are 5. For clarity, the MS peaks for Ca2+-bound peptides are enlarged and highlighted in a gray box. (B) Averaged time courses of cAMP production in response to the PTH in HEK293 cells expressing the PTHR or the PTHR-ECL1 mutants measured by FRET. Individual cells were continuously perfused with a buffer or with the ligand (10 nM) for the time indicated by the horizontal bar. (C) Averaged dissociation time courses of the PTH-TMR from the WT (black) or the mutant PTHRGFP (ECL1-1—red, ECL1-2—blue). FRET recordings from HEK293 cells are shown as a normalized ratio. (D) The effect of 0.1 and 10 mM Ca2+ on cAMP response mediated by the 10 nM PTH in HEK293 cells expressing either the WT PTHR, or the ECL1 mutant receptors. cAMP responses were quantified by measuring the area under the curve from 0 to 35 min and are represented as percentage differences from the 1 mM Ca2+ effect. (E) Saturation-binding isotherms of the PTHTMR to ECL1 mutants of the PTHR stably expressed in HEK293 cells. The mean ± SEM of n = 3 carried out in triplicate. (F) The bars represent the mean of the Kd values ± SEM of binding experiments shown in Figs. 1C and 3E. *Significantly different when P < 0.05. Time courses represent the mean value ± SEM of n > 3 with n = 14–26 cells/experiment.
Fig. 4.
Fig. 4.
Involvement of R25 of the PTH in interaction stabilization and receptor signaling. (A) Saturation-binding isotherms of the PTH-R25CTMR to the PTHR stably expressed in HEK293 cells with [Ca2+] = 0.1 (blue), 1 (black), or 10 (red) mM. The mean ± SEM of n = 3 experiments carried out in triplicate. (B) Averaged time courses of cAMP production in response to the PTHR25C in HEK293 cells expressing the PTHR in the presence of a range of [Ca2+] measured by FRET. (C) Time courses of cAMP production in response to the PTH (Right) or the PTHR25C (Left) in HEK293 cells expressing the PTHR. Experiments were run at two conditions: cells expressing only the PTHR (black), and cells coexpressing the PTHR and DynK44A dominant negative mutant (gray). Individual cells were perfused with a buffer or with the ligand (10 nM) for the time indicated by the horizontal bar. (D) Pearson’s correlation values obtained from colocalization experiments between PTH-TMR or PTHR25C-TMR with anti-HA-Alexa 488 (the PTHRAF488, Right) or the early endosome marker Rab5-GFP (Left). The individual channel and merged images are shown in SI Appendix, Figs. S12D and S15. The arrows indicate the time of ligand perfusion. (E) Averaged time courses of cAMP production in response to the PTHR25C in HEK293 cells expressing the PTHR or the PTHR-ECL1 mutants (Left), and dissociation time courses of the PTHR25C-TMR from WT or the mutant PTHRGFP also expressed in HEK293 cells (Right) measured by FRET. Individual cells were continuously perfused with buffer or with the ligand (10 nM) for the time indicated by the horizontal bar. (F) Homology model of the PTHR generated from GPCR-I-TASSER (32) with the modeled PTH. The PTHR is shown as an electrostatic surface, and the PTH is represented as a green helix. The PTH R25 points toward an acidic face of the PTHR, which consists of ECL1-1 and ECL1-2 residues; the PTH R25 and residues of ECL1-1 and ECL1-2 are shown as sticks. (G) Time courses of internalization and recycling of the PTHRSEP in response to a ligand, measured by time-lapse confocal microscopy with images acquired every 60 s. The baseline was established, and cells were perfused with a 100 nM ligand for 20 s then washed out. (H) Averaged dissociation time courses of the PTH-TMR from the PTHRGFP. FRET recordings from HEK293 cells are shown as normalized ratios. Cells were perfused with a 50 nM ligand for 30 s then washed out. The gray line is a recording of pH using the PTH-fluorescein isothiocyanate in HEK293 cells expressing the PTHR C-terminally tagged with CFP. Time courses represent the mean value ± SEM of n = 3 with n = 8–20 cells/experiment.

References

    1. Gardella TJ, Vilardaga JP. International Union of Basic and Clinical Pharmacology. XCIII. The parathyroid hormone receptors–Family B G protein-coupled receptors. Pharmacol Rev. 2015;67:310–337. - PMC - PubMed
    1. Vilardaga JP, Jean-Alphonse FG, Gardella TJ. Endosomal generation of cAMP in GPCR signaling. Nat Chem Biol. 2014;10:700–706. - PMC - PubMed
    1. Ferrandon S, et al. Sustained cyclic AMP production by parathyroid hormone receptor endocytosis. Nat Chem Biol. 2009;5:734–742. - PMC - PubMed
    1. Calebiro D, et al. Persistent cAMP-signals triggered by internalized G-protein-coupled receptors. PLoS Biol. 2009;7:e1000172. - PMC - PubMed
    1. Kotowski SJ, Hopf FW, Seif T, Bonci A, von Zastrow M. Endocytosis promotes rapid dopaminergic signaling. Neuron. 2011;71:278–290. - PMC - PubMed

Publication types

MeSH terms