. 2019 Feb 4;9(1):14.
doi: 10.1038/s41398-018-0360-y.

Genome-wide by environment interaction studies of depressive symptoms and psychosocial stress in UK Biobank and Generation Scotland

Affiliations

Genome-wide by environment interaction studies of depressive symptoms and psychosocial stress in UK Biobank and Generation Scotland

Aleix Arnau-Soler et al. Transl Psychiatry. .

Abstract

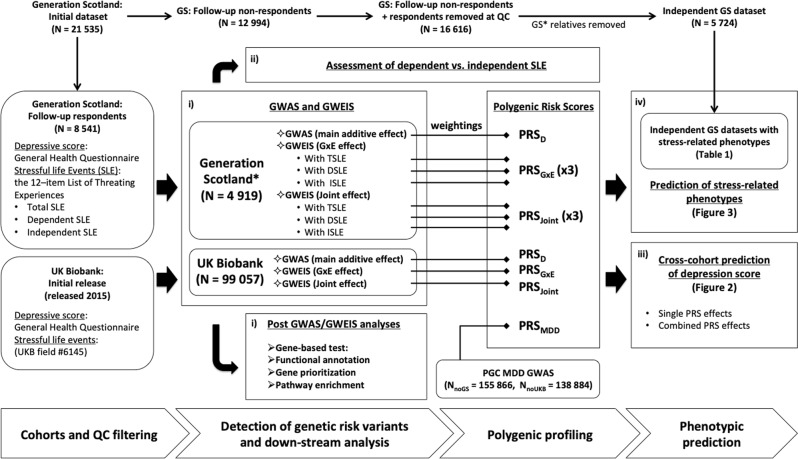
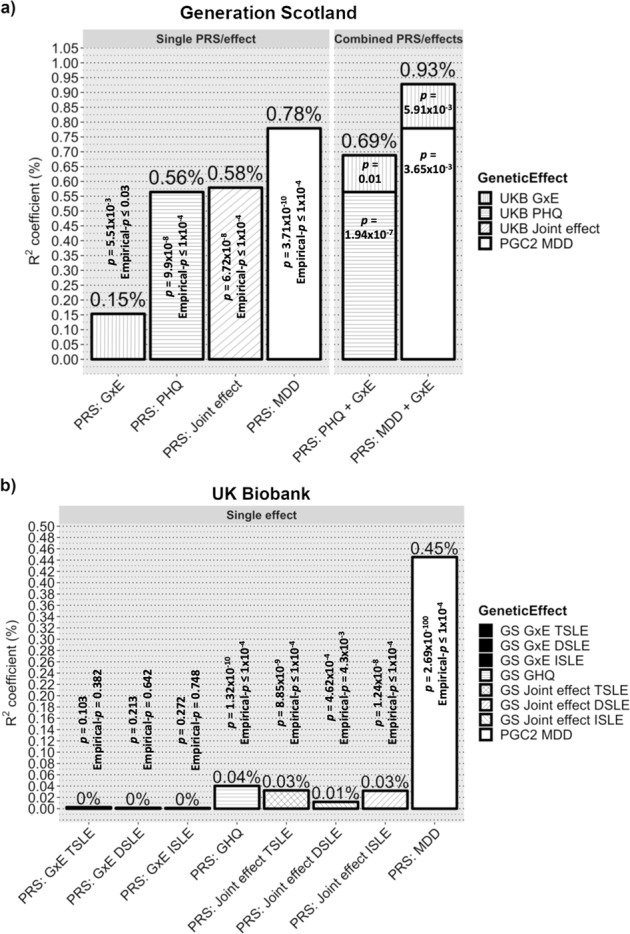
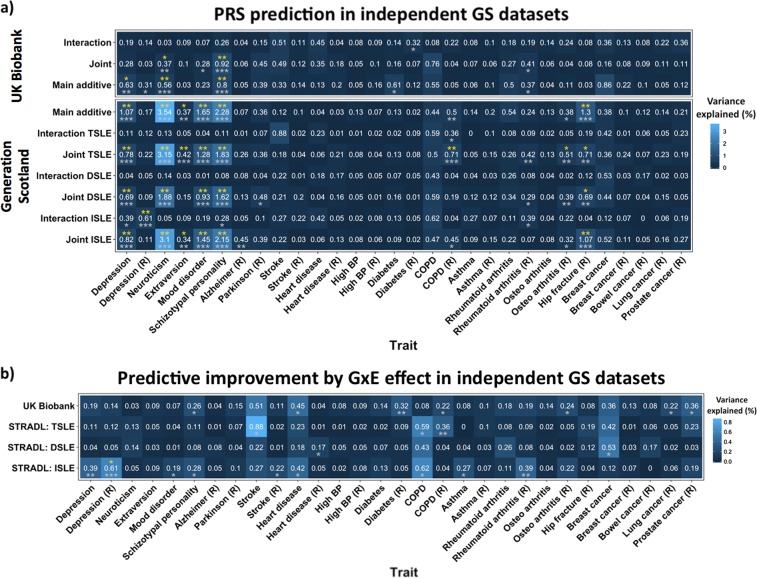
Stress is associated with poorer physical and mental health. To improve our understanding of this link, we performed genome-wide association studies (GWAS) of depressive symptoms and genome-wide by environment interaction studies (GWEIS) of depressive symptoms and stressful life events (SLE) in two UK population-based cohorts (Generation Scotland and UK Biobank). No SNP was individually significant in either GWAS, but gene-based tests identified six genes associated with depressive symptoms in UK Biobank (DCC, ACSS3, DRD2, STAG1, FOXP2 and KYNU; p < 2.77 × 10⁻⁶). Two SNPs with genome-wide significant GxE effects were identified by GWEIS in Generation Scotland: rs12789145 (53-kb downstream PIWIL4; p = 4.95 × 10⁻⁹; total SLE) and rs17070072 (intronic to ZCCHC2; p = 1.46 × 10⁻⁸; dependent SLE). A third locus upstream CYLC2 (rs12000047 and rs12005200, p < 2.00 × 10⁻⁸; dependent SLE) when the joint effect of the SNP main and GxE effects was considered. GWEIS gene-based tests identified: MTNR1B with GxE effect with dependent SLE in Generation Scotland; and PHF2 with the joint effect in UK Biobank (p < 2.77 × 10⁻⁶). Polygenic risk scores (PRSs) analyses incorporating GxE effects improved the prediction of depressive symptom scores, when using weights derived from either the UK Biobank GWAS of depressive symptoms (p = 0.01) or the PGC GWAS of major depressive disorder (p = 5.91 × 10⁻³). Using an independent sample, PRS derived using GWEIS GxE effects provided evidence of shared aetiologies between depressive symptoms and schizotypal personality, heart disease and COPD. Further such studies are required and may result in improved treatments for depression and other stress-related conditions.


Conflict of interest statement

The authors declare that they have no conflict of interest.

Figures

Fig. 1
Fig. 1. Study flowchart.
Overview of the analyses conducted in this study: (i) identify loci associated with depressive symptoms through genetic response to SLE; (ii) test whether results of studying dependent and independent SLE support a contribution of genetically mediated exposure to stress; (iii) assess whether GxE effects improve the proportion of phenotypic variance in depressive symptoms explained by genetic additive main effects alone and (iv) test whether there is significant overlap in the genetic aetiology of the response to SLE and mental and physical stress-related phenotypes. Two core cohorts are used, Generation Scotland (GS) and UK Biobank (UKB). Summary statistics from genome-wide association studies (GWAS) and genome-wide by environment interaction studies (GWEIS) are used to generate polygenic risk scores (PRSs). Summary statistics from Psychiatric Genetic Consortium (PGC) Major Depressive Disorder (MDD) GWAS are also used to generate PRS (PRSMDD). PRS weighted by: additive effects (PRSD and PRSMDD), GxE effects (PRSGxE) and joint effects (the combined additive and GxE effect; PRSJoint), are used for phenotypic prediction. TSLE stands for total number of SLE reported. DSLE stands for SLE dependent on an individual’s own behaviour. Conversely, ISLE stands for independent SLE. N stands for sample size. NnoGS stands for sample size with GS individuals removed. NnoUKB stands for sample size with UKB individuals removed
Fig. 2
Fig. 2. Prediction of depression scores by PRSGxE, PRSD, PRSMDD and PRSJoint.
Variance of depression score explained by PRSGxE PRSD, PRSMDD and PRSJoint as single effect; and combining both PRSD and PRSMDD with PRSGxE in single models. Prediction was conducted using a Generation Scotland (GS) and b UK Biobank (UKB) as target sample. PRSGxE were weighted by cross- sample genome-wide by environment interaction studies (GWEIS) using GxE effect. PRSD were weighted by cross-sample genome-wide association studies (GWAS) of depressive symptoms effect. PRSMDD was weighted by Psychiatric Genetic Consortium (PGC) Major Depressive Disorder (MDD)-GWAS summary statistics. PRSJoint were weighted by cross-sample GWEIS using joint effect. A nominally significant gain in variance explained of General Health Questionnaire (GHQ) of about 23% was seen in GS when PRSGxE was incorporated into a multiple regression model along with PRSD; and of about 19% when PRSGxE was incorporated into a multiple regression model along with PRSMDD. Such a gain was not seen in UKB, but it must be noted that both PRSD and PRSMDD also explains much less variance of PHQ in UKB than of GHQ in GS. Also note, a noticeably reduction of variance explained by PRSJoint compared with combined polygenic risk scores (PRS)/effects
Fig. 3
Fig. 3. Polygenic risk score (PRS) prediction in independent Generation Scotland (GS) datasets.
a Heatmap illustrating PRS prediction of a wide range of traits from GS listed in the x axis (Table 1). (R) refers to traits using mapping by proxy approach (i.e., where first-degree relatives of individuals with the disease are considered proxy cases and included into the group of cases). Y axis shows the discovery sample and the effect used to weight PRS. Numbers in cells indicate the % of variance explained, also represented by colour scale. Significance is represented by asterixes according to the following significance codes: **p < 0.01; *p < 0.05; in grey Empirical-p-values after permutation (10,000 times) and in yellow FDR-adjusted Empirical-p-values. b Predictive improvement by GxE effect in independent GS datasets. Heatmap illustrating the predictive improvement as a result of incorporating PRSGxE into a multiple model along with PRSD and covariates (full model), over a model fitting PRSD alone with covariates (null model); predicting a wide range of traits from GS listed in the x axis (Table 1). Covariates: age, sex and 20 PCs. (R) refers to traits using mapping by proxy approach (i.e., where first-degree relatives of individuals with the disease are consider proxy cases and included into the group of cases). PRSGxE are weighted by genome-wide by environment interaction studies (GWEIS) using GxE effects. PRSD were weighted by the genome-wide association studies (GWAS) of depressive symptoms additive main effects. The y axis shows the discovery sample used to weight PRS. Numbers in cells indicate the % of variance explained by the PRSGxE, also represented by colour scale. Notice that those correspond to the PRSGxE predictions in Fig. 3a when PRSGxE are weighted by GxE effects. Significance was tested by likelihood ratio tests (LRT): full model including PRSD + PRSGxE vs. null model with PRSD alone (covariates adjusted). Significance is represented by asterixes according to the following significance codes: ***p < 0.001; **p < 0.01; *p < 0.05; in grey LRT-p-values and in yellow FDR-adjusted LRT-p-values

References

    1. Plomin R, Owen M, McGuffin P. The genetic basis of complex human behaviors. Science. 1994;264:1733–1739. doi: 10.1126/science.8209254. - DOI - PubMed
    1. Kendler KS, Eaves LJ. Models for the joint effect of genotype and environment on liability to psychiatric illness. Am. J. Psychiatry. 1986;143:279–289. doi: 10.1176/ajp.143.3.279. - DOI - PubMed
    1. Kendler KS, Baker JH. Genetic influences on measures of the environment: a systematic review. Psychol. Med. 2007;37:615–626. doi: 10.1017/S0033291706009524. - DOI - PubMed
    1. Colodro-Conde L, et al. A direct test of the diathesis-stress model for depression. Mol. Psychiatry. 2017;23:1590–1596. doi: 10.1038/mp.2017.130. - DOI - PMC - PubMed
    1. Luciano M, et al. Shared genetic aetiology between cognitive ability and cardiovascular disease risk factors: Generation Scotland’s Scottish family health study. Intelligence. 2010;38:304–313. doi: 10.1016/j.intell.2010.03.002. - DOI

Publication types