. 2019 Feb 4;9(1):72.
doi: 10.1038/s41398-019-0382-0.

Structural neuroimaging correlates of social deficits are similar in autism spectrum disorder and attention-deficit/hyperactivity disorder: analysis from the POND Network

Affiliations

Structural neuroimaging correlates of social deficits are similar in autism spectrum disorder and attention-deficit/hyperactivity disorder: analysis from the POND Network

Danielle A Baribeau et al. Transl Psychiatry. .

Abstract

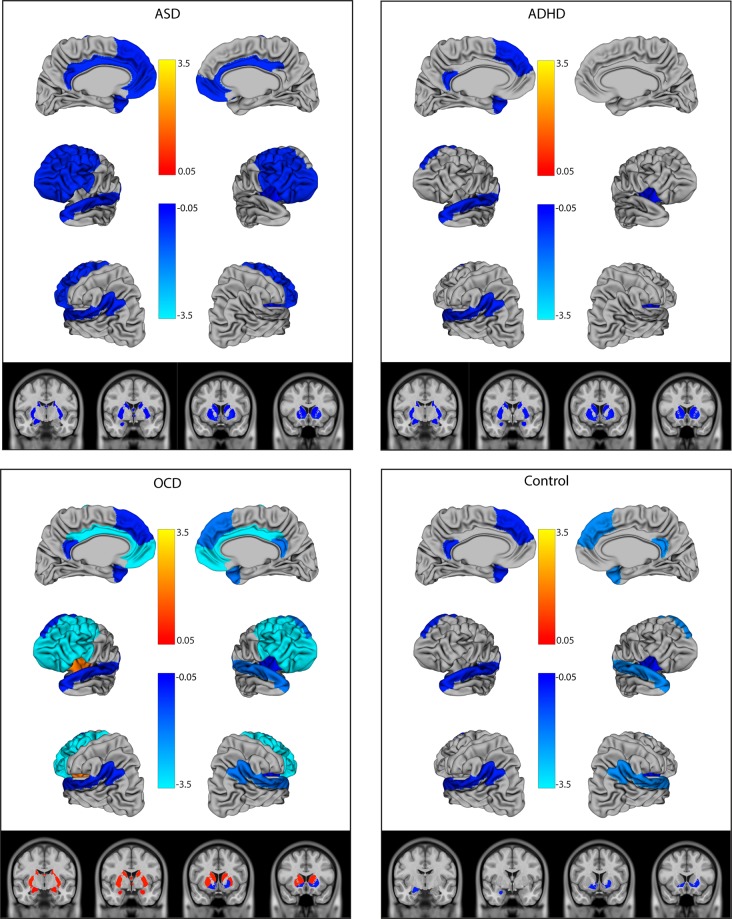
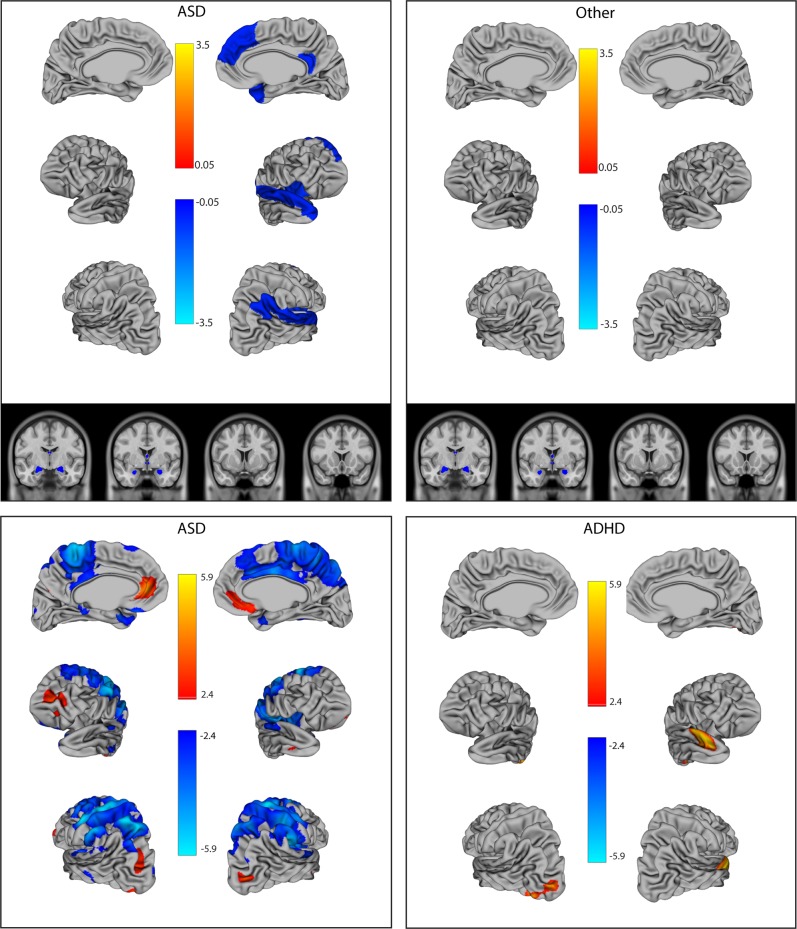
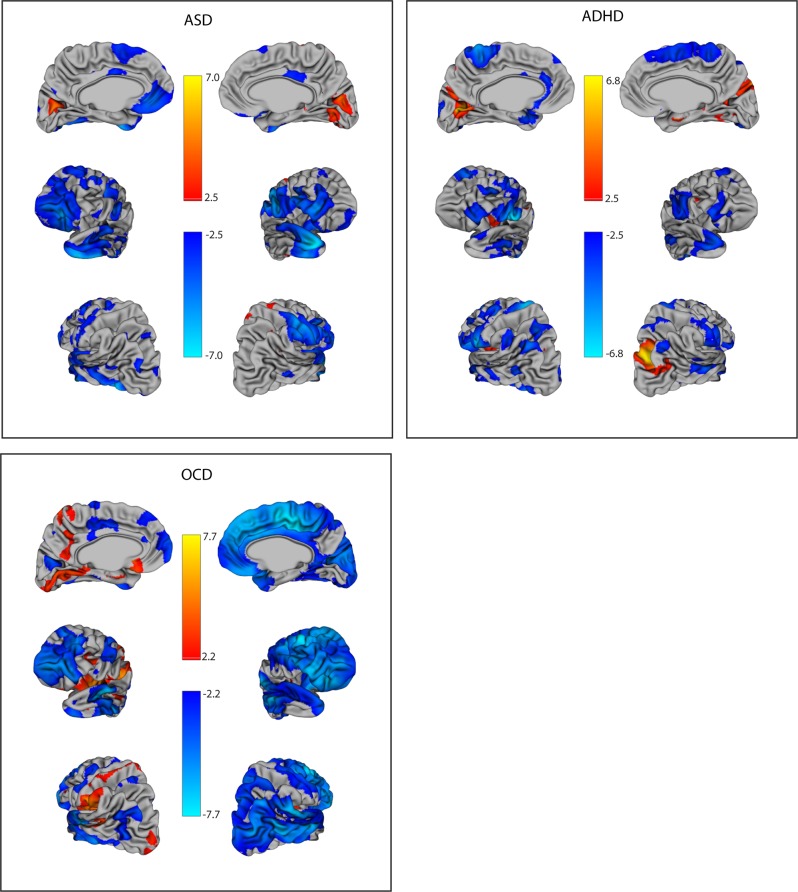
Autism spectrum disorder (ASD), attention-deficit/hyperactivity disorder (ADHD), and obsessive-compulsive disorder (OCD) have been associated with difficulties recognizing and responding to social cues. Neuroimaging studies have begun to map the social brain; however, the specific neural substrates contributing to social deficits in neurodevelopmental disorders remain unclear. Three hundred and twelve children underwent structural magnetic resonance imaging of the brain (controls = 32, OCD = 44, ADHD = 77, ASD = 159; mean age = 11). Their social deficits were quantified on the Social Communication Questionnaire (SCQ) and the Reading the Mind in the Eyes Test (RMET). Multivariable regression models were used to examine the structural neuroimaging correlates of social deficits, with both a region of interest and a whole-brain vertex-wise approach. For the region of interest analysis, social brain regions were grouped into three networks: (1) lateral mentalization (e.g., temporal-parietal junction), (2) frontal cognitive (e.g., orbitofrontal cortex), and (3) subcortical affective (e.g., limbic system) regions. Overall, social communication deficits on the SCQ were associated with thinner cortices in the left lateral regions and the right insula, and decreased volume in the ventral striatum, across diagnostic groups (p = 0.006 to <0.0001). Smaller subcortical volumes were associated with more severe social deficits on the SCQ in ASD and ADHD, and less severe deficits in OCD. On the RMET, larger amygdala/hippocampal volumes were associated with fewer deficits across groups. Overall, patterns of associations were similar in ASD and ADHD, supporting a common underlying biology and the blurring of the diagnostic boundaries between these disorders.


Conflict of interest statement

R.J.S. has consulted to Highland Therapeutics, Eli Lilly and Co., and Purdue Pharma. He has commercial interest in a cognitive rehabilitation software company, “eHave.” P.D.A. holds a patent for “SLCIAI Marker for Anxiety Disorder” granted 6 May 2008. P.S. has received royalties from Guilford Press. E.A. has served as a consultant to Roche. She has received grant funding from SanofiCanada and SynapDx. She has received royalties from APPI and Springer. E.A. and A.K. hold a provisional patent for the device, “Anxiety Meter.” S.W.S. is an academic scientific consultant advising or is in licensing arrangements with Athena, Diagnostics, King Abdulaziz University Lineagen, Deep Genomics and Population Diagnostics. He also holds the CIHR-GlaxoSmithKline Endowed Chair in Genome Sciences at the Hospital for Sick Children and University of Toronto. The remaining authors declare no competing interests.

Figures

Fig. 1
Fig. 1. Log odds ratios of the association between brain structure in social regions of interest and social communication deficits on the SCQ.
The figure shows the log odds ratios (ORs) for regions where p < 0.05 in the multivariable model. ORs indicate the change in SCQ score per increase in size (per mm increase in thickness, 0.1 cm3 increase in volume for the amygdala/hippocampus, or 1.0 cm3 increase in volume for other subcortical structure). Blue indicates ORs <1, where thicker/larger structures are associated with fewer deficits. Orange indicates ORs >1, where thicker/larger structures are associated with greater social deficits. OCD: obsessive-compulsive disorder, ADHD: attention-deficit/ hyperactivity disorder, ASD: autism spectrum disorder, SCQ: Social Communication Questionnaire
Fig. 2
Fig. 2. Log odds ratios of the association between brain structure and social perception deficits on the RMET.
Top panels show the region of interest approach; log odds ratios (ORs) are for regions that were significant the multivariable model after false discovery rate (FDR) correction (q = 0.05). The bottom panels present the vertex-wise analysis for ASD and ADHD; vertices are shown that remained significant after an FDR correction at q = 0.05 (no vertices remained significant for the controls or OCD group). ORs indicate the change in RMET score per increase in size (per mm increase in thickness, 0.1 cm3 increase in volume for the amygdala/hippocampus, or 1.0 cm3 increase in volume for other subcortical structures). Blue indicates ORs <1, where thicker/larger structures are associated with fewer deficits. Orange indicates ORs >1, where thicker/larger structures are associated with greater social deficits. OCD: obsessive-compulsive disorder, ADHD: attention-deficit/ hyperactivity disorder, ASD: autism spectrum disorder, RMET: Reading the Mind in the Eyes Test
Fig. 3
Fig. 3. Log odds ratios of the association between cortical thickness and social communication deficits on the SCQ using a vertex-wise analysis.
Vertices are shown that remained significant after an false discovery rate (FDR) correction at q = 0.05 (no vertices remained significant for the control group). Odds ratios (ORs) indicate the change in SCQ score per increase in size (per mm increase in thickness, 0.1 cm3 increase in volume for the amygdala/hippocampus, or 1.0 cm3 increase in volume for other subcortical structures). Blue indicates ORs <1, where thicker/larger structures are associated with fewer deficits. Orange indicates ORs >1, where thicker/larger structures are associated with greater social deficits. OCD: obsessive-compulsive disorder, ADHD: attention-deficit/hyperactivity disorder, ASD: autism spectrum disorder, SCQ: Social Communication Questionnaire

References

    1. Baribeau DA, et al. Examining and comparing social perception abilities across childhood-onset neurodevelopmental disorders. J. Am. Acad. Child Adolesc. Psychiatry. 2015;54:479–486 e1. doi: 10.1016/j.jaac.2015.03.016. - DOI - PubMed
    1. Liu W, et al. Disassociation of cognitive and affective aspects of theory of mind in obsessive-compulsive disorder. Psychiatry Res. 2017;255:367–372. doi: 10.1016/j.psychres.2017.06.058. - DOI - PubMed
    1. Kang JI, Namkoong K, Yoo SW, Jhung K, Kim SJ. Abnormalities of emotional awareness and perception in patients with obsessive-compulsive disorder. J. Affect Disord. 2012;141:286–293. doi: 10.1016/j.jad.2012.04.001. - DOI - PubMed
    1. Cullen B, et al. Social and communication difficulties and obsessive-compulsive disorder. Psychopathology. 2008;41:194–200. doi: 10.1159/000120988. - DOI - PubMed
    1. Kim K, Reynolds K, Alfano C. Social impairment in children with obsessive compulsive disorder: Do comorbid problems of inattention and hyperactivity matter? J. Obsessive Compuls. Relat. Disord. 2012;1:228–233. doi: 10.1016/j.jocrd.2012.06.005. - DOI

Publication types

MeSH terms