. 2019 Feb 4;10(1):567.
doi: 10.1038/s41467-019-08534-1.

Virus-specific memory T cells populate tumors and can be repurposed for tumor immunotherapy

Affiliations

Virus-specific memory T cells populate tumors and can be repurposed for tumor immunotherapy

Pamela C Rosato et al. Nat Commun. .

Abstract

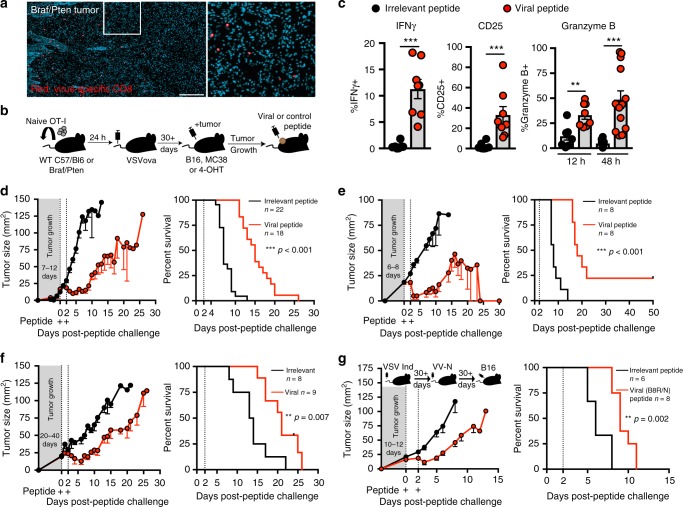
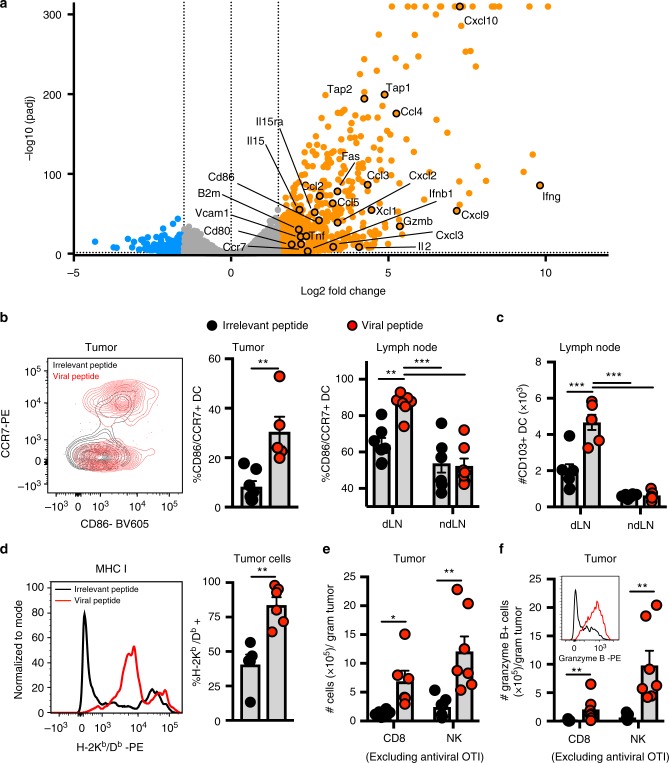
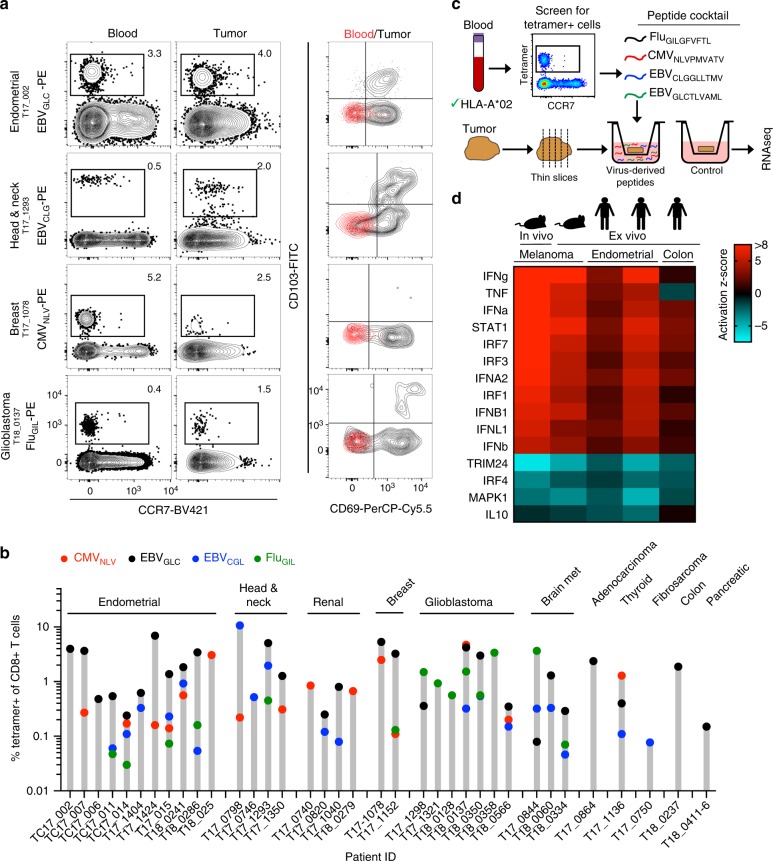
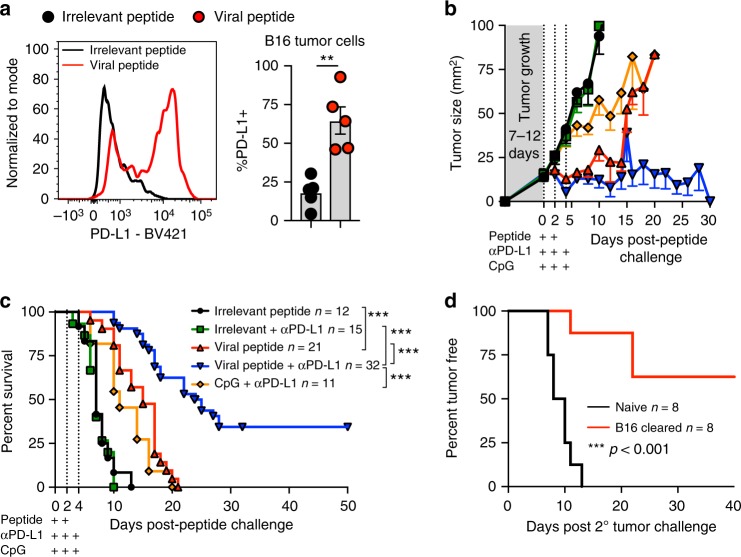
The immunosuppressive tumor microenvironment limits the success of current immunotherapies. The host retains memory T cells specific for previous infections throughout the entire body that are capable of executing potent and immediate immunostimulatory functions. Here we show that virus-specific memory T cells extend their surveillance to mouse and human tumors. Reactivating these antiviral T cells can arrest growth of checkpoint blockade-resistant and poorly immunogenic tumors in mice after injecting adjuvant-free non-replicating viral peptides into tumors. Peptide mimics a viral reinfection event to memory CD8+ T cells, triggering antigen presentation and cytotoxic pathways within the tumor, activating dendritic cells and natural killer cells, and recruiting the adaptive immune system. Viral peptide treatment of ex vivo human tumors recapitulates immune activation gene expression profiles observed in mice. Lastly, peptide therapy renders resistant mouse tumors susceptible to PD-L1 blockade. Thus, re-stimulating known antiviral immunity may provide a unique therapeutic approach for cancer immunotherapy.


Conflict of interest statement

The authors declare no competing interests.

Figures

Fig. 1
Fig. 1
Antiviral memory T-cell activation arrests tumor growth. a Immunofluorescence staining of Braf/Pten tumor (Red, OT-I; teal, 4′,6-diamidino-2-phenylindole (DAPI)-stained nuclei. Scale bar = 250 μm. b Schematic of experimental set up. c Proportion of IFNγ +, CD25 + and granzyme B + OT-I in B16 melanoma tumors 12 h following intratumoral irrelevant (black circles) or viral SIINFEKL peptide (red circles) with n = 8 mice (12 h), and n = 13 mice (48 h). dg Tumor growth (left) and survival (right) following two intratumoral peptide injections 48h apart in OT-I chimeras with B16 melanoma (d), OT-I chimeras with MC38 (e), Braf/Pten OT-I chimeras (f), or mice with endogenous memory generated to VSV Indiana and VV-N (g). Black lines denote irrelevant control peptide and red lines denote viral peptide in figures (dg). Sample size for tumor growth and survival plots indicated in the figure where n = number of mice. Significance was determined by unpaired two-tailed Mann–Whitney (IFNγ and CD25), and unpaired two-tailed t-test (granzyme B) for (c), and Log-rank Mantel–Cox test for (dg) where **p < 0.01, ***p < 0.001. a Image representative of three tumors. c, d, f, Data pooled from three independent experiments. e, g, Data pooled from two independent experiments. Lines represent means and error bars are SEM
Fig. 2
Fig. 2
Antiviral T-cell reactivation promotes intratumoral immune activation. a Volcano plot of differentially expressed genes determined by RNAseq from whole B16 tumors 9 h after peptide exposure. Orange and blue circles are significantly (q-value < 0.05) upregulated (>1.5 log2FC) or downregulated genes (<−1.5 log2FC), respectively, compared to irrelevant peptide treated tumors (n = 3 mice; data from one experiment). b Proportion of CD86 +/CCR7 + CD103+ DCs in tumor at 12 h (n = 6 mice for irrelevant, n = 5 mice for viral), and tumor draining (dLN) or non-draining (ndLN) LN at 48 h (n = 7) following intratumoral irrelevant (black circles) or viral SIINFEKL peptide (red circles). c Quantification of CD103 + DCs in LN at 48 h. n = 6 mice (irrelevant), n = 7 mice (viral). d Proportion of B16 tumor cells expressing MHC I at 24 h. n = 5 mice (irrelevant), n = 6 mice (viral). e Quantification of NK cells and CD44hi CD8+ T cells (excluding OT-I) in Braf/Pten tumors (48 h). n = 6 mice (CD8), and n = 7 mice (NK). f Enumeration of granzyme B + NK and non-viral peptide-specific CD8+ T cells in Braf/Pten tumors. Example of granzyme B staining in NK cells (inset) at 48 h; n = 7 mice. All data, unless indicated, are pooled from at least two independent experiments. Significance was determined by unpaired two-tailed Mann–Whitney test (e, CD8); and unpaired two-tailed t-test (b, tumor) d, and (e, NK), and a one-way unpaired ANOVA with Tukey post hoc test (b, LN) and (c). Lines represent means and error bars are SEM. *p < 0.05, **p < 0.01, ***p < 0.001
Fig. 3
Fig. 3
Antiviral T cells populate human tumors and can promote immune activation. a Flow plots of human tumors and paired blood stained for HLA-A*02 + tetramers specific for EBV (EBVGLC and EBVCLG), CMV (CMVNLV), and Influenza (FluGIL) (showing 4 of 36 patients, as indicated (b). Left two columns gated on CD8 +/CD3 + cells. Right column; CD69 and CD103 phenotype of tetramer-positive cells. b Frequency of tetramer + T cells in all human tumors analyzed. Each bar is a patient. Symbol color represents specific tetramer; red circles = CMVNLV, black circles = EBVGLC, blue circles = EBVCGL, green circles = FluGIL. c Schematic of human organotypic slice culture experimental design. d Upstream transcriptional regulator analysis using ingenuity pathway analysis (IPA) software on differentially expressed genes after 9 h treatment with control or viral peptide with a q-value < 0.1 from in vivo mouse B16 tumors (n = 3 mice), ex vivo Braf/Pten tumors slice culture (n = 3 mice) or two distinct human endometrial (from three technical replicates each) or one colon (from two technical replicates) tumor slice cultures (colors denote activation z-score). Patient IDs in order from left to right are T18_0241, T17_1424, and T18_0237. Upstream transcriptional regulators could not be identified by IPA in a fourth human tumor sample (T18_0286), as no significantly differentially expressed genes were identified (see Supplementary Table 2)
Fig. 4
Fig. 4
Antiviral T-cell reactivation sensitizes B16 to checkpoint blockade therapy. a PD-L1 expression on B16 tumor cells 24 h following intratumoral irrelevant (black circles) or viral peptide (red circles), n = 5; data pooled from two experiments. Lines represent means and error bars are SEM. b, c Tumor growth (b) and survival (c) of OT-I immune chimeras with B16 treated with irrelevant peptide (black lines), irrelevant peptide with anti-PD-L1 (green lines), viral peptide (red lines), viral peptide with anti-PD-L1 (blue lines) or CpG with anti-PD-L1 (orange lines). Peptide was injected intratumorally twice 24 h apart, CpG was injected intratumorally thrice 24 h apart, and anti-PD-L1 antibody was delivered i.v. thrice 24 h apart, as denoted by plus symbols. Pooled data from at least two experiments. d Percent of naive control (black lines) or cured peptide + anti-PD-L1 treated mice that remained tumor-free after B16 re-challenge in opposite flank (red lines); data pooled from two experiments. Sample size for tumor growth and survival plot indicated in the figures where n = number of mice. Statistical significance was determined by unpaired two-tailed t-test (a) and Log-rank Mantel–Cox test (c, d) where **p < 0.01, ***p < 0.001

References

    1. Sharpe AH, Pauken KE. The diverse functions of the PD1 inhibitory pathway. Nat. Rev. Immunol. 2017;18:153–167. doi: 10.1038/nri.2017.108. - DOI - PubMed
    1. Lim WA, June CH. The principles of engineering immune cells to treat. Cancer Cell. 2017;168:724–740. - PMC - PubMed
    1. Joyce JA, Fearon DT. T cell exclusion, immune privilege, and the tumor microenvironment. Science. 2015;348:74–80. doi: 10.1126/science.aaa6204. - DOI - PubMed
    1. Sharma P, Hu-Lieskovan S, Wargo JA, Ribas A. Primary, adaptive, and acquired resistance to cancer immunotherapy. Cell. 2017;168:707–723. doi: 10.1016/j.cell.2017.01.017. - DOI - PMC - PubMed
    1. Masopust D, Vezys V, Marzo AL, Lefrancois L. Preferential localization of effector memory cells in nonlymphoid tissue. Science. 2001;291:2413–2417. doi: 10.1126/science.1058867. - DOI - PubMed

Publication types

MeSH terms

Substances