. 2019 Feb 4;10(2):103.
doi: 10.1038/s41419-019-1377-8.

CEMIP (KIAA1199) induces a fibrosis-like process in osteoarthritic chondrocytes

Affiliations

CEMIP (KIAA1199) induces a fibrosis-like process in osteoarthritic chondrocytes

Céline Deroyer et al. Cell Death Dis. .

Abstract

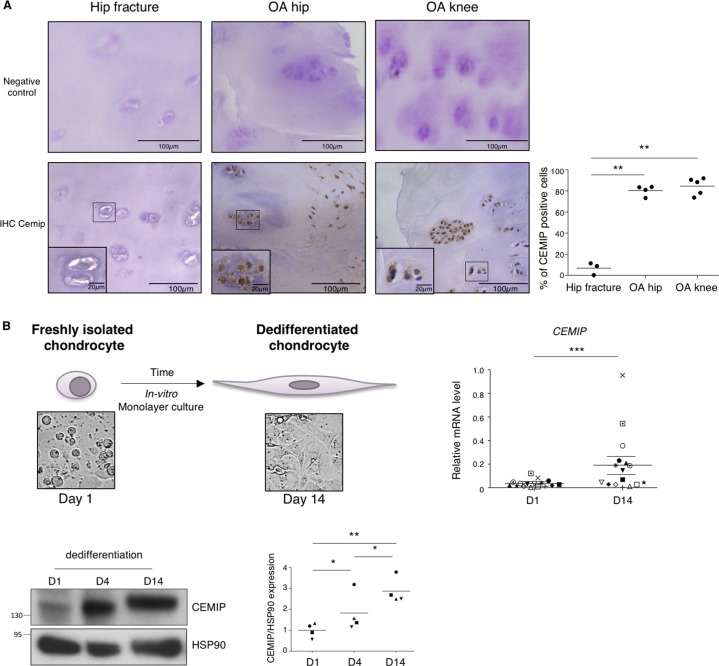
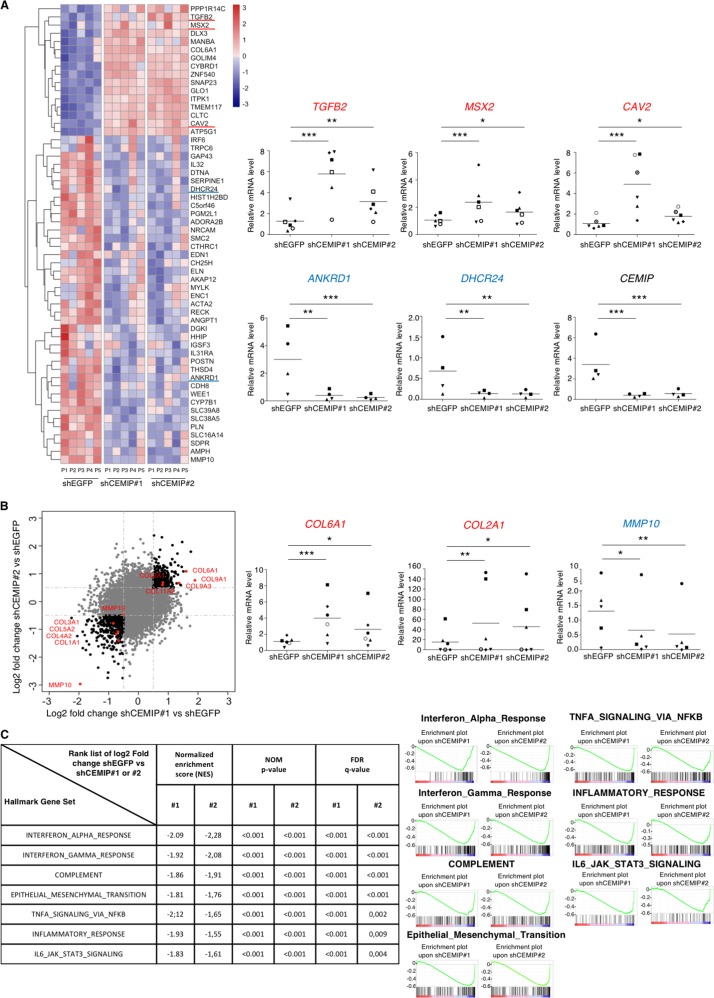
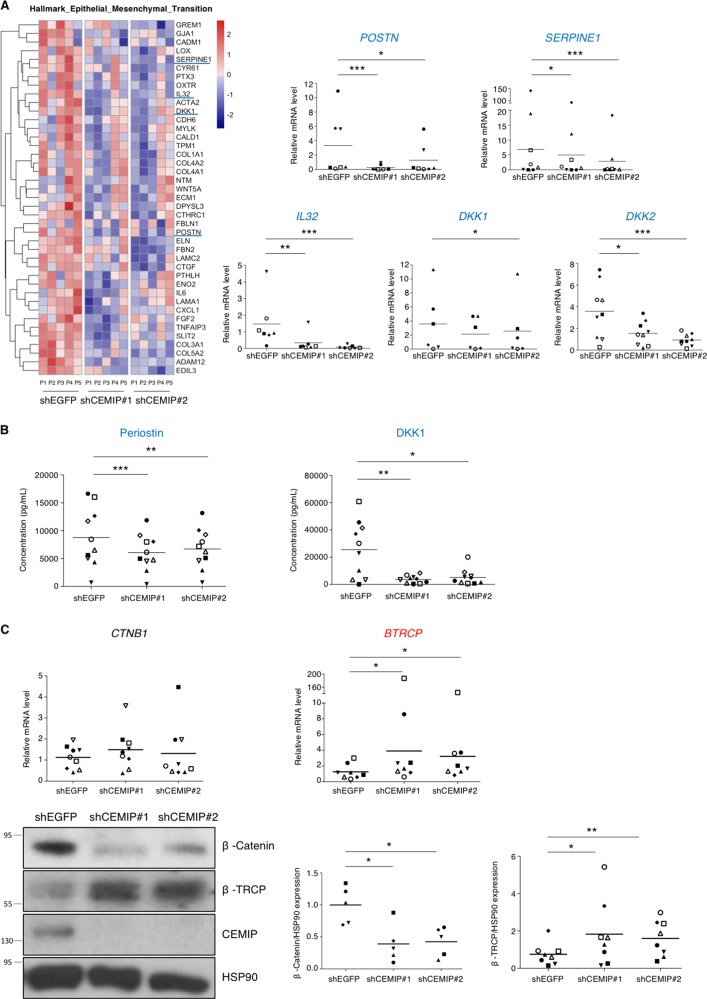
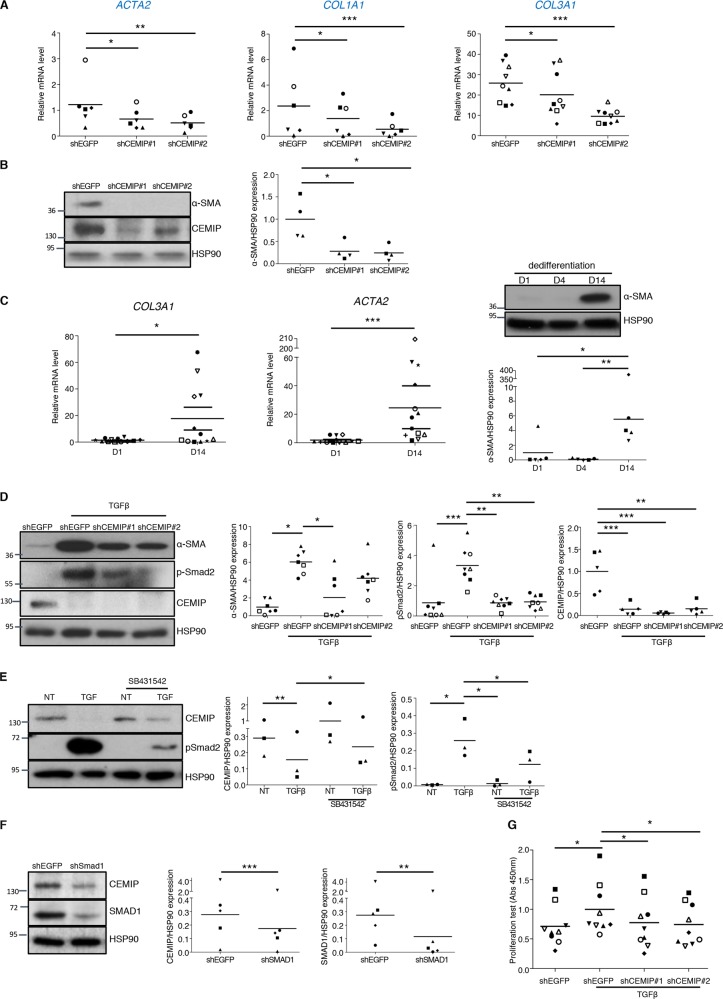
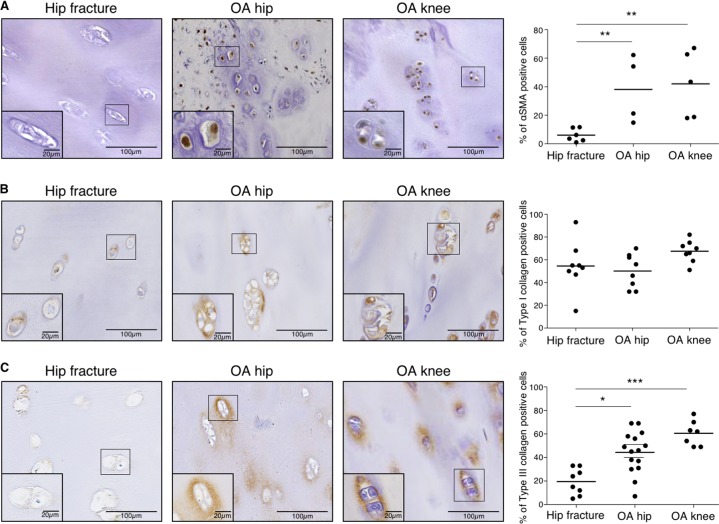
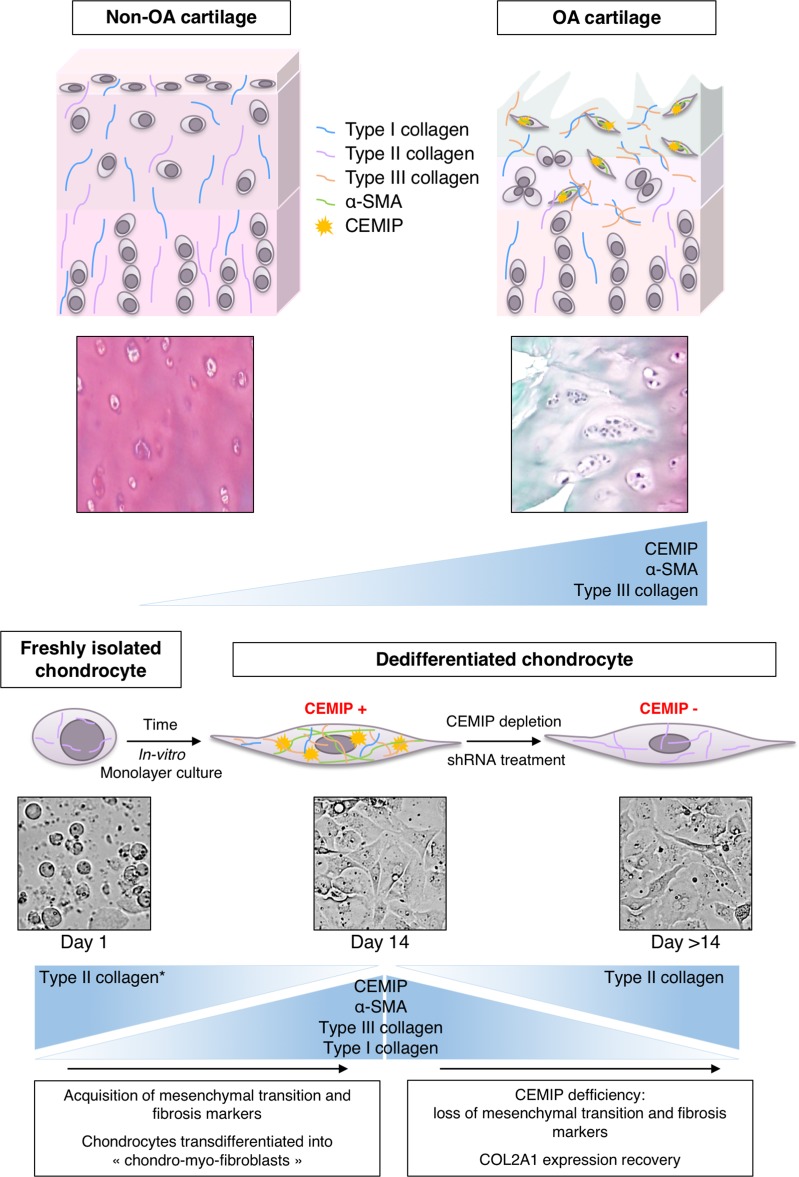
CEMIP (for "Cell migration-inducing protein" also called KIAA1199 and Hybid for "Hyaluronan-binding protein") expression is increased in cancers and described as a regulator of cell survival, growth and invasion. In rheumatoid arthritis, CEMIP is referred to as an angiogenic marker and participates in hyaluronic acid degradation. In this study, CEMIP expression is investigated in healthy and osteoarthritis (OA) cartilage from human and mouse. Its role in OA physiopathology is deciphered, specifically in chondrocytes proliferation and dedifferentiation and in the extracellular matrix remodeling. To this end, CEMIP, αSMA and types I and III collagen expressions were assessed in human OA and non-OA cartilage. CEMIP expression was also investigated in a mouse OA model. CEMIP expression was studied in vitro using a chondrocyte dedifferentiation model. High-throughput RNA sequencing was performed on chondrocytes after CEMIP silencing. Results showed that CEMIP was overexpressed in human and murine OA cartilage and along chondrocytes dedifferentiation. Most of genes deregulated in CEMIP-depleted cells were involved in cartilage turnover (e.g., collagens), mesenchymal transition and fibrosis. CEMIP regulated β-catenin protein level. Moreover, CEMIP was essential for chondrocytes proliferation and promoted αSMA expression, a fibrosis marker, and TGFβ signaling towards the p-Smad2/3 (Alk5/PAI-1) pathway. Interestingly, CEMIP was induced by the pSmad1/5 (Alk1) pathway. αSMA and type III collagen expressions were overexpressed in human OA cartilage and along chondrocytes dedifferentiation. Finally, CEMIP was co-expressed in situ with αSMA in all OA cartilage layers. In conclusion, CEMIP was sharply overexpressed in human and mouse OA cartilage and along chondrocytes dedifferentiation. CEMIP-regulated transdifferentiation of chondrocytes into "chondro-myo-fibroblasts" expressing α-SMA and type III collagen, two fibrosis markers. Moreover, these "chondro-myo-fibroblasts" were found in OA cartilage but not in healthy cartilage.


Conflict of interest statement

The authors declare that they have no conflict of interest.

Figures

Fig. 1
Fig. 1. CEMIP expression is increased in mouse OA cartilage.
a Representative IHC picture of cartilage section from sham and DMM mice at 4, 8, 12, 20, and 24 weeks stained without (negative control) and with anti-CEMIP antibody. b Representative picture of cartilage section from sham and DMM mice at 4 weeks stained with SafraninO-FastGreen. OA score was significantly increased in DMM mice (n = 10) compared to Sham mice (n = 7) (up). Representative IHC picture of cartilage section stained without (negative control) and with an anti-CEMIP antibody. Analysis was done on several mice (n = 9 for each group): the percentage of CEMIP positive chondrocytes was significantly increased in DMM mice at 4 weeks compared to sham mice (bottom). (Mann–Whitney test: *p < 0.05 and **p < 0.01). c Representative picture of cartilage section from sham and DMM mice at 8 weeks stained with SafraninO-FastGreen. OA score was significantly increased in DMM mice compared to Sham mice (n = 10 for each group) (up). Representative IHC picture of cartilage section stained without (negative control) and with an anti-CEMIP antibody. Analysis was done on several mice (n = 9 for each group): the percentage of CEMIP positive chondrocytes was significantly increased in DMM mice at 8 weeks compared to sham mice (bottom). (Mann–Whitney test: *p < 0.05 and **p < 0.01)
Fig. 2
Fig. 2. CEMIP expression is increased in human OA cartilage and in human dedifferentiated chondrocytes.
a Representative IHC picture of cartilage section from hip fracture, OA hip and OA knee stained without (negative control) and with an anti-CEMIP antibody (Left). Analysis was done on several patients: the percentage of CEMIP positive cells was significantly increased in OA hip (n = 4) and OA knee (n = 5) compared to hip fracture (n = 3) (right). (ANOVA tests: **p < 0.01). b Schematic representation of in vitro chondrocyte dedifferentiation (top left). CEMIP mRNA levels were significantly increased at D14 compared to D1 (n = 16) (error bar: SED, Wilcoxon-paired test: p < 0.001) (top right). Representative picture of western blot using CEMIP and HSP90-specific antibodies at D1, D4, and D14 is presented (bottom left). Analysis was done on several patients (n = 4): western blot quantification illustrating the significant increase of CEMIP/HSP90 expression at D14 compared to D1 and D4 and at D4 compared to D1 (bottom right). (ANOVA paired tests: *p < 0.05, **p < 0.01)
Fig. 3
Fig. 3. CEMIP modulates ECM components in human dedifferentiated chondrocytes.
a Heatmap of differential gene expression values upon CEMIP depletion in chondrocytes from 5 patients for genes with a shrunk Log2 fold change better than ±1 (left). RT-qPCR analysis of TGFB2, MSX2, CAV2, ANKRD1, DHCR24, and CEMIP genes in CEMIP-depleted chondrocytes compared to non-depleted chondrocytes. TGFB2 (n = 6), MSX2 (n = 6), and CAV2 (n = 6) relative gene expressions were increased in CEMIP-depleted cells compared to non-depleted cells while ANKRD1 (n = 4), DHCR24 (n = 4), and CEMIP (n = 6) were decreased (right). (ANOVA paired tests: *p < 0.05, **p < 0.01, ***p < 0.001). b Dot plot representing the comparison of Shrunk Log2 fold change for shCEMIP#1 compared to shEGFP and shCEMIP#2 compared to shEGFP. Genes with an adjusted p-value < 0.01 and a Shrunk Log2 fold change < −0.5 or >0.5 for both comparisons are represented in black. Genes of ECM components are highlighted in red (left). RT-qPCR analysis of different ECM component genes. COL6A1 (n = 6), COL2A1 (n = 6) relative genes expressions were increased in CEMIP-depleted cells compared to non-depleted cells while MMP10 (n = 5) relative gene expression was decreased (right). (ANOVA paired tests: *p < 0.05, **p < 0.01, ***p < 0.001). c. GSEA analysis using Hallmark pathway database. NES and adjusted p-values are added for each enrichment dataset and for both comparisons (shCEMIP#1 vs shEGFP and shCEMIP#2 vs shEGFP)
Fig. 4
Fig. 4. CEMIP modulated a mesenchymal transition-like process in human dedifferentiated chondrocytes.
a The EMT pathway highlighted by GSEA analysis and the corresponding heatmap after CEMIP depletion in chondrocytes from five patients (left). RT-qPCR analysis of POSTN, SERPINE1, IL32, DKK1, and DKK2, genes in CEMIP-depleted chondrocytes compared to non-depleted chondrocytes. POSTN (n = 7), SERPINE1 (n = 8), IL32 (n = 7), DKK1 (n = 6), and DKK2 (n = 9) relative gene expressions were decreased in CEMIP-depleted cells (right). (ANOVA paired tests: *p < 0.05, **p < 0.01, ***p < 0.001). b ELISA analysis of Periostin (left) and DKK1 (right) secretion in CEMIP-depleted cells and control cells. Secretions of Periostin (n = 10) and DKK1 (n = 10) were decreased in CEMIP-depleted chondrocytes compared to control chondrocytes. (ANOVA paired tests: *p < 0.05, **p < 0.01, ***p < 0.001). c RT-qPCR analysis of CTNB1 and BTRCP genes in CEMIP-depleted chondrocytes compared to non-depleted chondrocytes (up). BTRCP (n = 8) was increased in CEMIP-depleted cells compared to control cells while CTNB1 (n = 9) expression was not modified (ANOVA paired tests: *p < 0.05). Representative picture of western blot analysis of β-catenin, β-TRCP, CEMIP, and HSP90 expression in cells treated with shEGFP, shCEMIP#1, and shCEMIP#2 (left). Analysis was done on several patients: western blot quantification illustrating the decrease of β-catenin/HSP90 expression (n = 5) and the increase of β-TRCP/HSP90 (n = 8) in cells treated with shCEMIP#1 and #2 compared to shEGFP treated cells (bottom). (ANOVA paired tests: *p < 0.05, **p < 0.01)
Fig. 5
Fig. 5. CEMIP induces a fibrosis-like process in human dedifferentiated chondrocytes.
a RT-qPCR analysis of ACTA2, COL1A1, and COL3A1 genes in CEMIP-depleted chondrocytes compared to non-depleted chondrocytes. ACTA2 (n = 6), COL1A1 (n = 6), COL3A1 (n = 9) relative gene expressions were decreased in CEMIP-depleted cells. (ANOVA paired tests: *p < 0.05, **p < 0.01, ***p < 0.001). b Representative picture of western blot analysis of α-SMA, CEMIP, and HSP90 upon CEMIP depletion. Analysis was done on several patients (n = 4): western blot quantification illustrating the decrease of αSMA/HSP90 expression in CEMIP-depleted cells compared to non-depleted cells. (ANOVA paired tests: *p < 0.05). c COL3A1 (n = 12) and ACTA2 (n = 12) mRNA levels were increased at D14 compared to D1 (left). (Error bar: SED, Wilcoxon-paired test: *p < 0.05, ***p < 0.001). Representative picture of western blot analysis of α-SMA and HSP90 at D1, D4, and D14. Analysis was done on several patients (n = 5): western blot quantification illustrating the increase of α-SMA/HSP90 expression at D14 compared to D1 and D4 (right). (ANOVA paired tests: *p < 0.05 and **p < 0.01). d Representative picture of western blot analysis of α-SMA, p-Smad2, CEMIP, and HSP90 upon CEMIP depletion and TGFβ stimulation. Analysis was done on several patients and western blot quantification illustrating: the increase of αSMA/HSP90 expression upon TGFβ stimulation and its decrease in CEMIP-depleted cells compared to non-depleted cells upon TGFβ stimulation (n = 7); the increase of p-Smad2/HSP90 expression upon TGFβ stimulation and its decrease in CEMIP-depleted cells compared to non-depleted cells upon TGFβ stimulation (n = 8); the decrease of CEMIP/HSP90 expression upon TGFβ stimulation and in CEMIP-depleted cells compared to non-depleted cells upon TGFβ stimulation (n = 5) (right). (ANOVA paired tests: *p < 0.05, **p < 0.01, ***p < 0.001). e Representative picture of western blot analysis of CEMIP, p-Smad2, and HSP90 upon SB431542 stimulation. Analysis was done on several patients and western blot quantification illustrating: the decrease of CEMIP/HSP90 expression upon TGFβ stimulation; the increase of CEMIP/HSP90 expression upon SB431542 stimulation in TGFβ treated cells; the increase expression of pSmad2/HSP90 upon TGFβ stimulation; the increase expression of pSmad2/HSP90 upon TGFβ stimulation in SB431542 treated cells; the decrease expression of pSmad2/HSP90 upon SB431542 stimulation in TGFβ treated cells; (n = 3) (ANOVA paired tests: *p < 0.05, **p < 0.01). f Representative picture of western blot analysis of CEMIP, SMAD1, and HSP90 upon SMAD1 depletion. Analysis was done on several patients and western blot quantification illustrating: the decrease of CEMIP/HSP90 expression in SMAD1 depleted cells and the decrease of SMAD1/HSP90 expression in SMAD1 depleted cells; (n = 5) (ANOVA paired tests: **p < 0.01, ***p < 0.001). g Graphic representation of BrdU proliferation test. Relative absorbance was increased in cells stimulated with TGFβ compared to non-treated cells and decreased in CEMIP-depleted cells compared to non-depleted cells upon TGFβ stimulation (n = 9). (ANOVA paired tests: *p < 0.05)
Fig. 6
Fig. 6. αSMA and type III collagen (but not type I) expression are increased in human OA cartilage.
a Representative picture of IHC analysis of cartilage section from human hip fracture, OA hip and OA knee stained with anti-αSMA antibody. Analysis was done on several patients: the percentage of αSMA positive cells was significantly increased in OA hip (n = 4) and OA knee (n = 5) compared to hip fracture (n = 6). (ANOVA tests: **p < 0.01). b Representative picture of IHC analysis of cartilage section from human hip fracture, OA hip and OA knee stained with anti-type I collagen antibody. Analysis was done on several patients: the percentage of type I collagen positive cells was not significantly different in OA hip (n = 8) and OA knee (n = 8) compared to hip fracture (n = 8). (ANOVA tests: not significant for both comparisons). c Representative picture of IHC analysis of cartilage section from human hip fracture, OA hip and OA knee stained with anti-type III collagen antibody. Analysis was done on several patients: the percentage of type III collagen positive cells was significantly increased in OA hip (n = 15) and OA knee (n = 7) compared to hip fracture (n = 8). (Error bar: SED, ANOVA tests: *p < 0.05, ***p < 0.001)
Fig. 7
Fig. 7. CEMIP is co-expressed with αSMA in the upper layer and with αSMA and type X collagen the deep zone of human OA cartilage.
a Representative picture of IHC analysis (n = 2) of cartilage section from OA hip stained with anti-CEMIP (left), anti-αSMA (middle), and anti-Type X collagen (right) antibodies. b Representative picture of IHC analysis (n = 4) of cartilage section from OA knee stained with anti-CEMIP (left), anti-αSMA (middle), and anti-Type X collagen (right) antibodies
Fig. 8
Fig. 8. Schematic representation of CEMIP-, αSMA-, and collagen-type expression.
CEMIP, αSMA, and type III collagen are overexpressed in OA cartilage compared to non-OA cartilage (upper panel). CEMIP, αSMA, and types I and III collagen are overexpressed in dedifferentiated chondrocytes compared to freshly isolated chondrocytes. All these decreased when CEMIP expression is abolished. Type II collagen expression decreased along chondrocytes dedifferentiation and increased while CEMIP expression is abolished (lower panel)

References

    1. Abe S, Usami S, Nakamura Y. Mutations in the gene encoding KIAA1199 protein, an inner-ear protein expressed in Deiters’ cells and the fibrocytes, as the cause of nonsyndromic hearing loss. J. Hum. Genet. 2003;48:564–70. doi: 10.1007/s10038-003-0079-2. - DOI - PubMed
    1. Usami S, et al. The localization of proteins encoded by CRYM, KIAA1199, UBA52, COL9A3, and COL9A1, genes highly expressed in the cochlea. Neuroscience. 2008;154:22–28. doi: 10.1016/j.neuroscience.2008.03.018. - DOI - PubMed
    1. Birkenkamp-Demtroder K, et al. Repression of KIAA1199 attenuates Wnt-signalling and decreases the proliferation of colon cancer cells. Br. J. Cancer. 2011;105:552–61. doi: 10.1038/bjc.2011.268. - DOI - PMC - PubMed
    1. Tiwari A, et al. Early insights into the function of KIAA1199, a markedly overexpressed protein in human colorectal tumors. PLoS ONE. 2013;8:e69473. doi: 10.1371/journal.pone.0069473. - DOI - PMC - PubMed
    1. Michishita E, Garcés G, Barrett JC, Horikawa I. Upregulation of the KIAA1199 gene is associated with cellular mortality. Cancer Lett. 2006;239:71–77. doi: 10.1016/j.canlet.2005.07.028. - DOI - PubMed

Publication types

MeSH terms