. 2019 Feb 4;9(1):1262.
doi: 10.1038/s41598-018-37766-2.

Three-dimensional organization of transzonal projections and other cytoplasmic extensions in the mouse ovarian follicle

Affiliations

Three-dimensional organization of transzonal projections and other cytoplasmic extensions in the mouse ovarian follicle

Valentina Baena et al. Sci Rep. .

Abstract

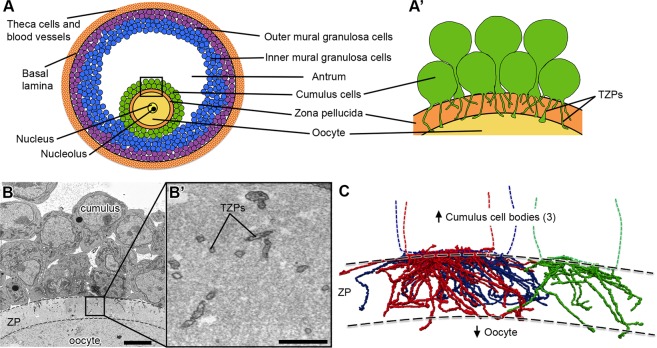
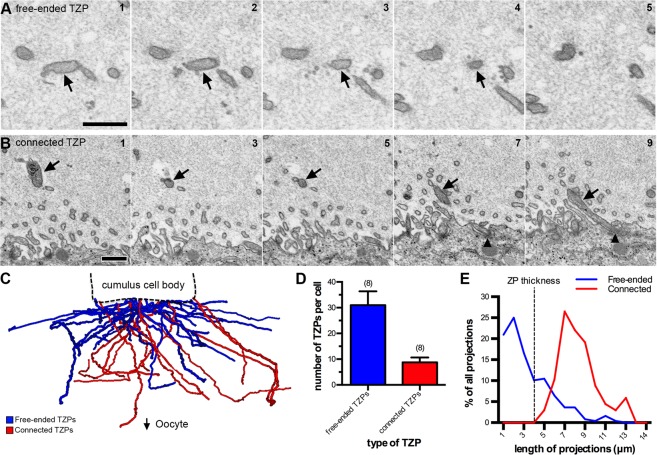
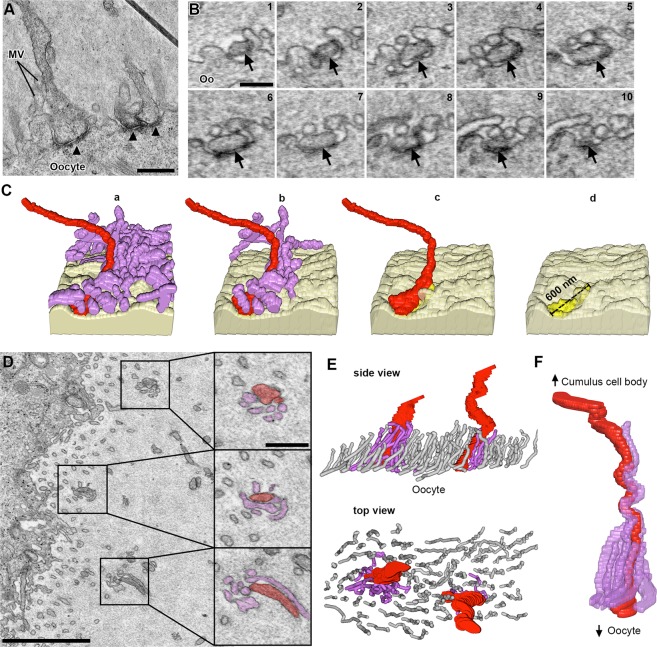
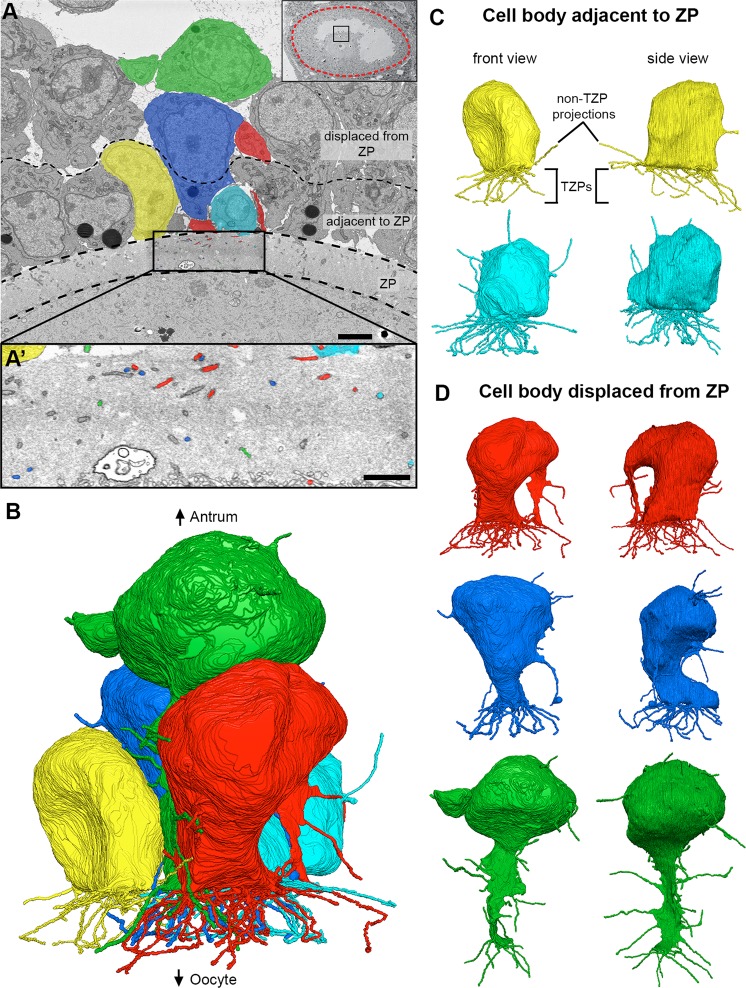
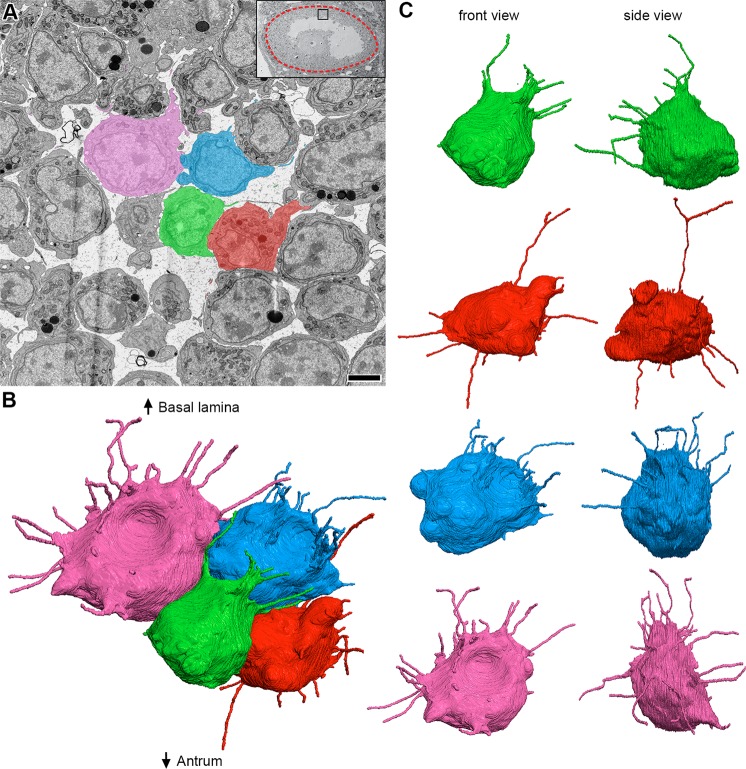
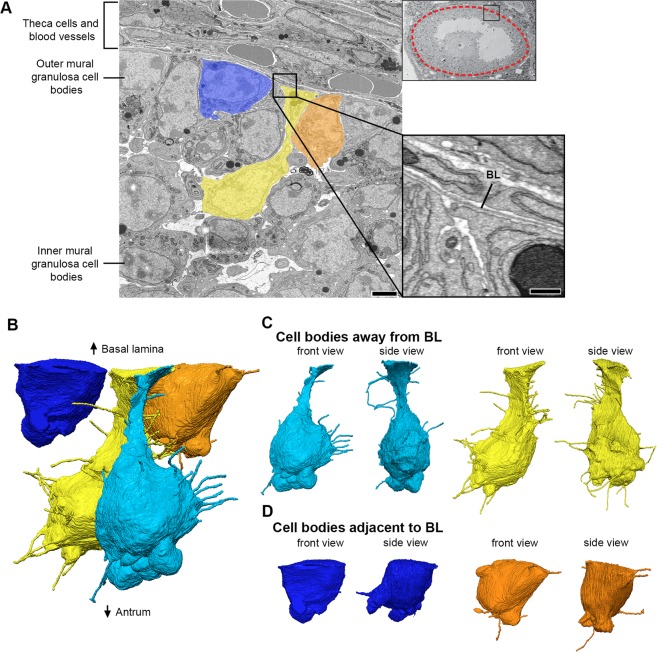
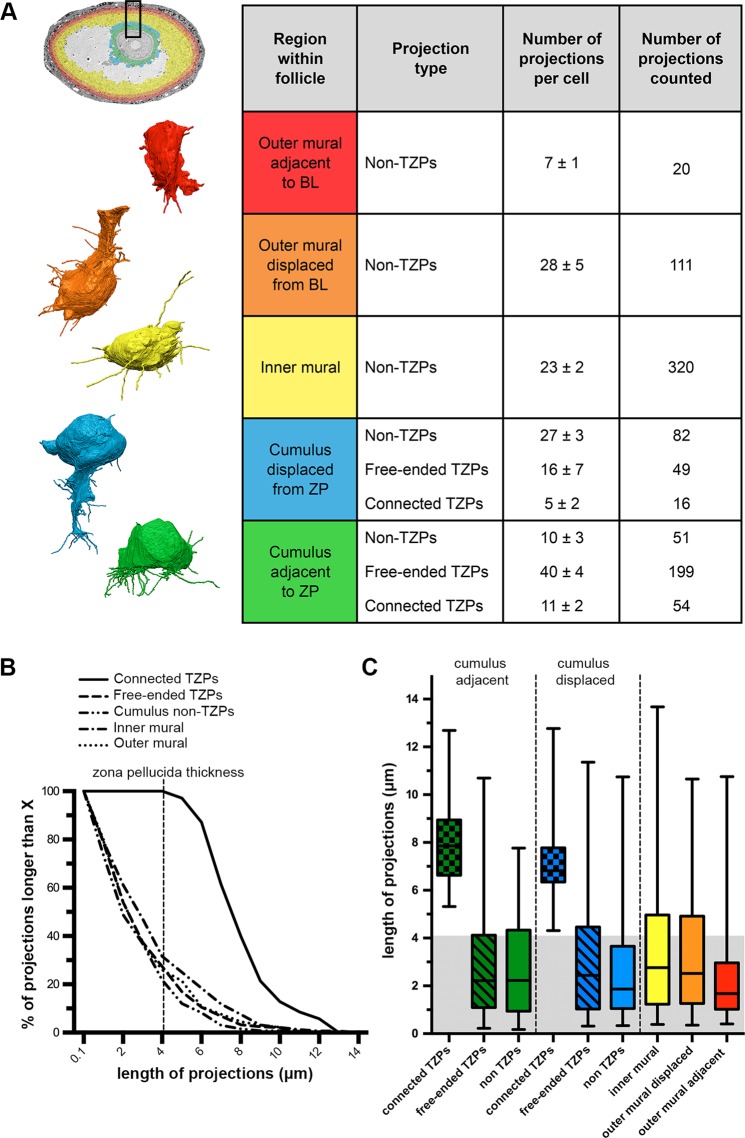
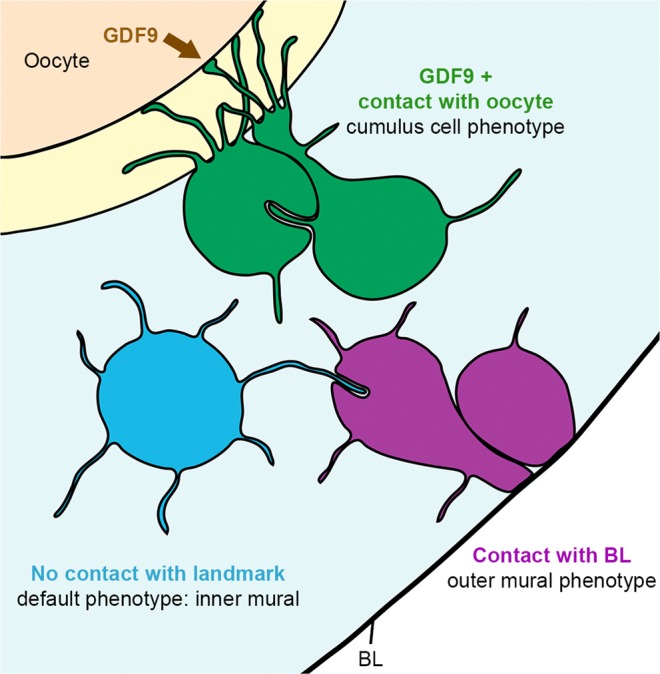
Each mammalian oocyte is nurtured by its own multi-cellular structure, the ovarian follicle. We used new methods for serial section electron microscopy to examine entire cumulus and mural granulosa cells and their projections in mouse antral ovarian follicles. Transzonal projections (TZPs) are thin cytoplasmic projections that connect cumulus cells to the oocyte and are crucial for normal oocyte development. We studied these projections in detail and found that most TZPs do not reach the oocyte, and that they often branch and make gap junctions with each other. Furthermore, the TZPs that connect to the oocyte are usually contacted on their shaft by oocyte microvilli. Mural granulosa cells were found to possess randomly oriented cytoplasmic projections that are strikingly similar to the free-ended TZPs. We propose that granulosa cells use cytoplasmic projections to search for the oocyte, and cumulus cell differentiation results from a contact-mediated paracrine interaction with the oocyte.


Conflict of interest statement

The authors declare no competing interests.

Figures

Figure 1
Figure 1
Cumulus cells send numerous projections through the zona pellucida. (A) Schematic of a mouse antral follicle. Black square represents area magnified in (A’). (A’) Schematic of several cumulus cells that send transzonal projections (TZPs) through the zona pellucida to connect to the oocyte. Cumulus cell bodies can be adjacent to or displaced from the zona pellucida. (B) SEM image of a cross-section through cumulus cells, zona pellucida (ZP, outlined by dashed lines), and oocyte of an antral follicle. Video 1 shows 202 serial sections of this area and highlights a cumulus cell with all of its projections. Scale bar, 5 μm. (B’) High-magnification of a region in the zona pellucida showing several TZPs in cross-section imaged by SEM. Scale bar, 1 μm. (C) Reconstruction of every TZP sent by three neighboring cumulus cells, each shown in a different color. TZPs were segmented from 405 serial electron micrographs, encompassing a volume of 22.5 × 6.7 × 18.2 μm (x, y, z). ZP, zona pellucida.
Figure 2
Figure 2
TZPs can be free-ended or connect to the oocyte. (A) Serial section SEM images of a free-ended TZP. The TZP (arrow) ends on section 4 without making contact with the oocyte or another TZP. Scale bar, 500 nm. (B) A series of SEM images showing every other section of a TZP that connects to the oocyte. Black triangles indicate the TZP-oocyte site of contact. Scale bar, 500 nm. (C) Treelines representing every TZP sent by one cumulus cell. Free-ended TZPs are shown in blue, and connected TZPs are shown in red. (D) Average number of TZPs per cumulus cell. TZP types were divided into free-ended (blue) and connected (red). 8 cumulus cells from 2 different follicles were analyzed. Total number of projections was 316. Average is shown as mean ± standard error of the mean. (E) Histogram of the length of free-ended (blue) and connected (red) TZPs from the data in D. An example of a remarkably long connected TZP can be seen in Video 3.
Figure 3
Figure 3
Contacts between TZPs and oocyte components. (A) TEM image of TZPs that make adherens junctions with the oocyte surface. Adherens junctions are identified by an electron-dense region at the site of TZP-oocyte contact (black triangles). Mv, oocyte microvilli. Scale bar 500 nm. (B) Serial section SEM images of a TZP (black arrow) that makes an adherens junction with the oocyte surface. Oo, oocyte. Scale bar, 300 nm. (C) Reconstruction of an adherens junction made by the TZP shown in B. Reconstruction is 2.0 × 1.1 × 1.7 μm (x, y, z), spanning through 38 serial sections (each, 45 nm-thick). Light yellow: oocyte surface. Purple: oocyte microvilli. Red: TZP. Bright yellow: adherens junction. (a) TZP and all oocyte microvilli in the volume. (b) Unattached microvilli have been removed from the reconstruction to show only those that make a contact with the TZP. (c) All microvilli have been removed from the reconstruction. (d) TZP has been removed from the reconstruction to show the adherens junction on the oocyte surface. (D) SEM image of an area of the zona pellucida in which TZPs and microvilli appear clumped (squares). High-magnification subpanels show the TZP in red and oocyte microvilli in purple (confirmed by serial sections). Scale bars, 2 μm on low magnification, and 500 nm on high magnification subpanels. Video 5 shows this in serial sections (reconstructed in F). (E) Side and top views of a reconstruction of an area in the zona pellucida that is 3.4 × 1.8 × 2.8 μm (x, y, z), spanning through 63 serial sections (each, 45 nm-thick), showing two areas where TZPs (red) are seen clumped with microvilli from the oocyte (purple). Non-interacting microvilli are shown in gray. (F) Reconstruction of a single TZP (red), and oocyte microvilli that tightly contact it (purple). The reconstruction is 2.9 × 1.2 × 2.7 μm (x, y, z), spanning through 61 serial sections (each, 45 nm-thick). This reconstruction was segmented from the data seen in Video 5.
Figure 4
Figure 4
Directionality of cumulus cell projections. (A) SEM image showing multiple cumulus cell bodies, zona pellucida, and part of the oocyte in cross-section. Five cells (colored) were chosen for reconstruction. Scale bar, 5 μm. Video 1 shows 202 serial sections of this area and highlights the green cell and all of its projections. (A’) High-magnification SEM image of the zona pellucida showing TZPs in cross-section. The colored TZPs originated from the cumulus cells chosen for reconstruction in A. Scale bar, 2 μm. (B) Reconstruction of 5 cumulus cell bodies from (A) and every cytoplasmic projection derived from them. Reconstruction is 28.4 × 24.6 × 18.2 μm (x, y, z), encompassing 405 serial sections (each, 45 nm-thick). A rotating view of this reconstruction can be seen in Video 2. (C,D) Front and side views of reconstructed cumulus cells found directly adjacent to the zona pellucida (C), or displaced by 1–2 cell diameters (D).
Figure 5
Figure 5
Inner mural granulosa cells send projections in many directions. (A) SEM image showing multiple inner mural granulosa cell bodies in cross-section. Four cells (colored) were chosen for reconstruction. Scale bar, 5 μm. Video 6 shows 240 serial sections of these cells and their projections. (B) Reconstruction of 4 inner mural granulosa cell bodies from (A) and every cytoplasmic projection derived from them. Reconstruction is 21.2 × 16.4 × 20.8 μm (x, y, z), encompassing 462 serial sections (each, 45 nm-thick). A rotating view of this reconstruction can be seen in video 7. (C) Front and side views of individual inner mural granulosa cell reconstructions from (B).
Figure 6
Figure 6
Outer mural granulosa cells send projections in many directions. (A) SEM image showing a region of inner and outer mural granulosa cells, the basal lamina, and theca cells and blood vessels found outside of the follicle. Four outer mural granulosa cells were chosen for reconstruction (three colored; one cell was not in the plane of the section). Scale bar, 5 μm. Video 8 shows 267 serial sections of this area. High-magnification insert shows parts of the cell bodies from outer mural granulosa cells on the bottom half and cell processes from theca or endothelial cells on the upper half. The basal lamina (BL) separates these cell types. Scale bar, 500 nm. (B) Reconstruction of 4 outer mural granulosa cell bodies and every cytoplasmic projection derived from them. Reconstruction is 16.4 × 14.7 × 22.4 μm (x, y, z), encompassing 497 serial sections (each, 45 nm-thick). A rotating view of this reconstruction can be seen in video 9. (C,D) Front and side views of reconstructed outer mural cells from (B), which were located 1–2 cell diameters away from the basal lamina (C) or directly adjacent to it (D).
Figure 7
Figure 7
Summary of cytoplasmic projections in somatic cells of antral ovarian follicles. (A) Summary table describing the number of projections per cell in each region of the ovarian follicle. Outer mural adjacent to BL refers to cells found directly adjacent to the basal lamina (n = 3). Outer mural displaced from BL refers to cells found two-to-three cell diameters away from the basal lamina but that still connect to it through a thick cytoplasmic process (n = 4). Inner mural refers to cells not connected to the oocyte or to the basal lamina (n = 14). Cumulus displaced from ZP refers to cells found two-to-three cell diameters away from the zona pellucida but that still connect to the oocyte through TZPs (n = 3). Cumulus adjacent to ZP refers to cells found directly adjacent to the zona pellucida (n = 5). Numbers are shown as mean ± standard error of the mean. To the left of the table are representative reconstructions of one cell from each of the cell groups in the table. Follicle insert is colored to represent the different cell groups. (B) Distribution of the length of projections from each group. All cumulus cells, regardless of the position of their cell body, were pooled together for the groups free-ended TZPs, connected TZPs, and cumulus non-TZPs. Outer mural granulosa cells were also pooled together. (C) Length of projections from every cell group represented as quartiles. Lower and upper edges of the box represent the first and third quartiles, respectively (25th and 75th percentiles). The line in the middle of the box represents the median (50th percentile). The lower and upper limits of the “whiskers” represent the minimum and maximum values, respectively. Cell groups are divided as described in (A). Gray-shaded region represents the thickness of the zona pellucida (~4.1 μm). Note that ~25% of all of the projections from each cell type are longer than the width of the zona pellucida (suggesting they could contact the oocyte if the cell body is at an appropriate distance).
Figure 8
Figure 8
Proposed model. Differentiation of somatic cells in the ovarian follicle is dependent on contact with the oocyte or with the basal lamina. Here, a granulosa cell becomes a cumulus cell (green) if it contacts the oocyte through TZPs and receives the GDF9 signal from the oocyte. If a granulosa cell makes contact with the basal lamina, it becomes an outer mural granulosa cell (purple). Conversely, if a granulosa cell does not make contact with the oocyte or with the basal lamina, it remains as an inner mural granulosa cell (blue), the default phenotype.

References

    1. Hawkins SM, Matzuk MM. Menstrual cycle: basic biology. Ann N Y Acad Sci. 2008;1135:10–18. doi: 10.1196/annals.1429.018. - DOI - PMC - PubMed
    1. Hirshfield AN. Development of follicles in the mammalian ovary. Int. Rev. Cytol. 1991;124:43–101. doi: 10.1016/S0074-7696(08)61524-7. - DOI - PubMed
    1. Edson MA, Nagaraja AK, Matzuk MM. The mammalian ovary from genesis to revelation. Endocr. Rev. 2009;30:624–712. doi: 10.1210/er.2009-0012. - DOI - PMC - PubMed
    1. Richards JS, Pangas SA. The ovary: basic biology and clinical implications. J. Clin. Invest. 2010;120:963–972. doi: 10.1172/JCI41350. - DOI - PMC - PubMed
    1. Dong J, et al. Growth differentiation factor-9 is required during early ovarian folliculogenesis. Nature. 1996;383:531–535. doi: 10.1038/383531a0. - DOI - PubMed

Publication types