. 2019 Feb 4;9(1):1166.
doi: 10.1038/s41598-018-37774-2.

Modeling spinocerebellar ataxias 2 and 3 with iPSCs reveals a role for glutamate in disease pathology

Affiliations

Modeling spinocerebellar ataxias 2 and 3 with iPSCs reveals a role for glutamate in disease pathology

Ching-Yu Chuang et al. Sci Rep. .

Abstract

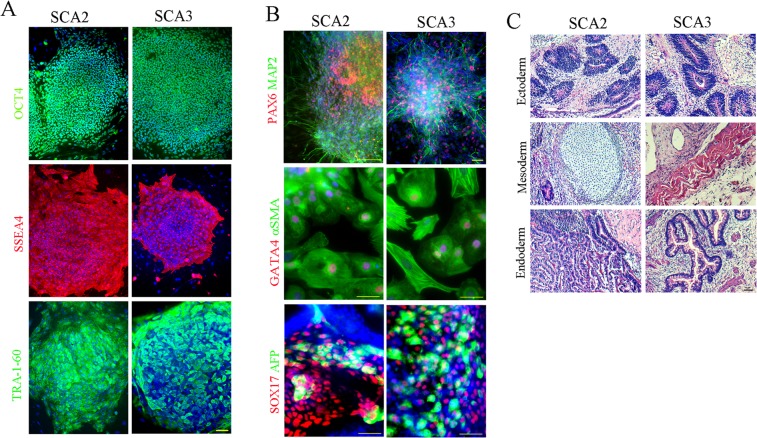
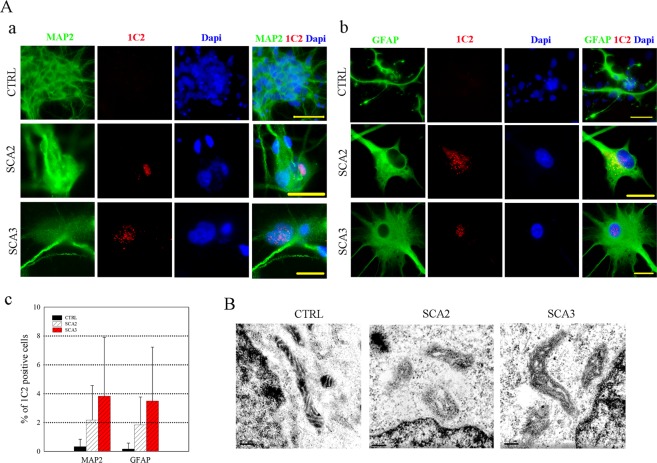
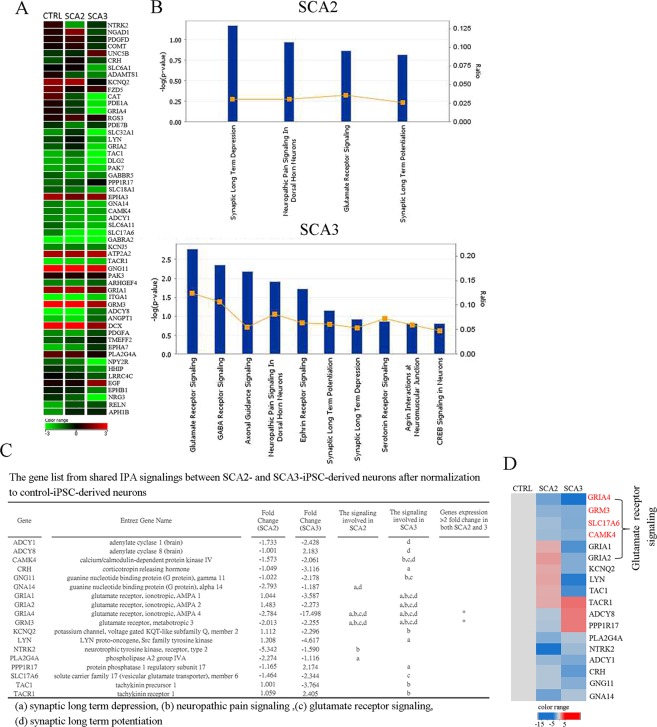
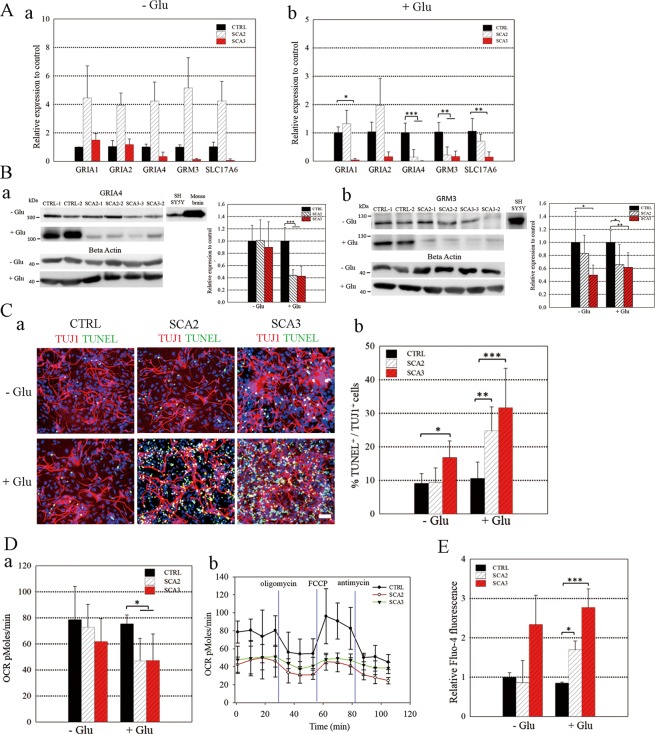
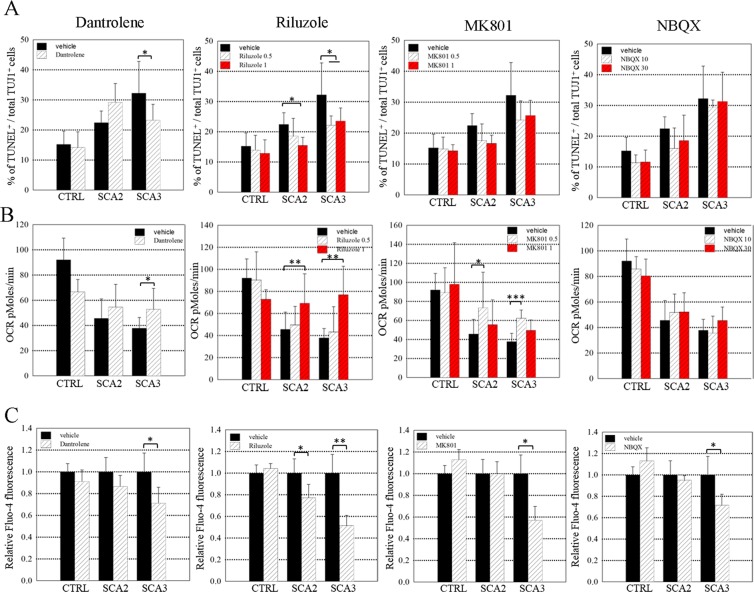
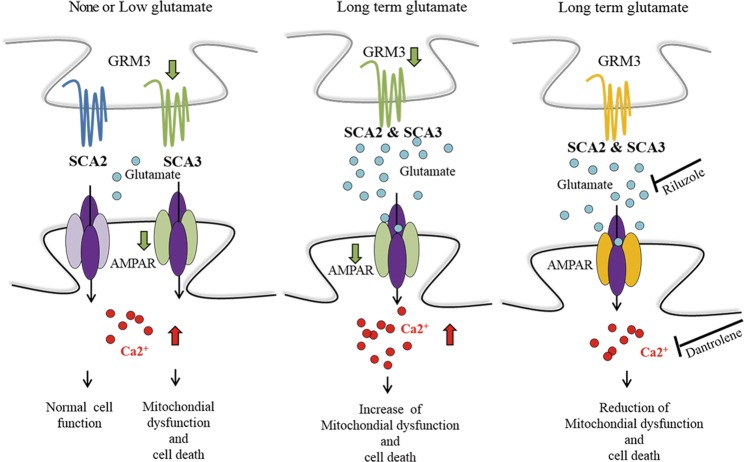
Spinocerebellar ataxias 2 and 3 (SCA2 and SCA3) are dominantly inherited neurodegenerative diseases caused by expansion of polyglutamine-encoding CAG repeats in the affected genes. The etiology of these disorders is known to involve widespread loss of neuronal cells in the cerebellum, however, the mechanisms that contribute to cell death are still elusive. Here we established SCA2 and SCA3 induced pluripotent stem cells (iPSCs) and demonstrated that SCA-associated pathological features can be recapitulated in SCA-iPSC-derived neurons. Importantly, our results also revealed that glutamate stimulation promotes the development of disease-related phenotypes in SCA-iPSC-derived neurons, including altered composition of glutamatergic receptors, destabilized intracellular calcium, and eventual cell death. Furthermore, anti-glutamate drugs and calcium stabilizer treatment protected the SCA-iPSC-derived neurons and reduced cell death. Collectively, our study demonstrates that the SCA-iPSC-derived neurons can recapitulate SCA-associated pathological features, providing a valuable tool to explore SCA pathogenic mechanisms and screen drugs to identify potential SCA therapeutics.


Conflict of interest statement

The authors declare no competing interests.

Figures

Figure 1
Figure 1
Characterization of representative SCA2-1 (iSCA2-17) and SCA3-1 (iSCA3-1) iPSCs. Immunostaining analysis for (A) pluripotency-associated markers in representative SCA-iPSC colonies and (B) three embryonic germ layer-associated markers in differentiated SCA-iPSC derivatives. (C) Hematoxylin and eosin staining of teratomas derived from representative SCA-iPSCs. All scale bars: 50 μm.
Figure 2
Figure 2
Recapitulating SCA-associated disease phenotypes in the SCA-iPSC-derived neural cells. (A) Intracellular polyQ accumulation occurs in (a) neurons (MAP2+) and (b) glial cells (GFAP+). Detection of polyQ aggregates was achieved using the anti-PolyQ-Expansion Disease Marker 1C2 antibody (red). Scale bar: 20 μm. (c) Quantitative analysis of polyQ aggregates in neurons and glial cells. (B) EM analysis of ultrastructural features in SCA-iPSC-derived neurons. Scale bar: 200 nm. CTRL-1 & 2, SCA2-1 & 2 and SCA3-1 & 2 iPSC lines were used in the experiments.
Figure 3
Figure 3
Transcriptome profiling revealed that genes associated with glutamate signaling were affected in SCA-iPSC-derived neuronal populations. (A) The heatmap shows fold changes of genes included in the gene ontology (GO) term, ‘neurotransmitters and other nervous system signaling’. Results from CTRL-, SCA2- and SCA3-derived neurons are shown. (B) The list of signaling categories predicted by IPA analysis of microarray results. The analysis was performed using data with gene expression > 2 fold between CTRL-iPSC-derived neuronal populations, and SCA2- or SCA3-iPSC-derived neurons. The x-axis represents the pathway. The y-axis for the line and square symbols is the ratio of the number of genes from the dataset that map to the pathway and the number of all known genes ascribed to the pathway. The y-axis for the bars is based on Fisher’s exact test p-value. The score cutoff was selected by a −log (p-value) > 0.8. (C) The gene list and (D) heatmap analysis of shared signaling differences between CTRL-iPSC-derived neurons and SCA-iPSC-derived neuronal populations. The fold changes of genes are shown as upregulated or downregulated in SCA-iPSC-derived neurons after normalization to CTRL-iPSC-derived neuronal populations. CTRL-1, 2 & 3, SCA2-1 & 2 and SCA3-1 & 2 iPSC lines were used in the experiments.
Figure 4
Figure 4
Culturing with glutamate enhanced expression differences of glutamate receptor-related genes and SCA-associated pathological phenotypes in the SCA-iPSC-derived neuronal populations. (A) RT-qPCR analysis of selected glutamate signaling-associated genes in control, SCA2- and SCA3-iPSC-derived neurons cultured (a) without or (b) with glutamate. Relative gene expression was first normalized to GAPDH, and then calculated as the fold change relative to control cells. (B) Immunoblotting and quantitative analysis of protein expression for (a) GRIA4 and (b) GRM3 in SCA-iPSC-derived neuronal populations without or with glutamate treatment. Relative protein expression was first normalized to β-ACTIN, and then fold changes compared to control were calculated. The full-length blots are presented in Fig. S10. (C) SCA-iPSC-derived neuronal cultures treated with or without glutamate were assessed for apoptosis with a TUNEL assay. (a) Neurons were stained with TUJ1 (red) and TUNEL positive signals are green. Nuclei were stained with DAPI. Scale bar: 50 μm. (b) Quantitative analysis of TUNEL+ cells among TUJ1+ neuronal population. At least 1 × 104 cells were counted for each experiment. (D) Measurement of oxygen consumption rates (OCR) by the Seahorse XF24 Extracellular Flux Analyzer. (a) Comparison of basal respiration among SCA2-, SCA3- and CTRL-iPSC-derived neuronal populations treated with or without glutamate. (b) The mitochondrial stress test in neurons cultured in glutamate-containing media. Vertical lines (Blue) indicate the time points at which different treatments were administered. (E) Intracellular calcium measurement by Fluo-4 fluorescence intensity in SCA-iPSC-derived neuronal populations without or with glutamate. All data represent the mean ± SD. ***P < 0.001, **P < 0.01, *P < 0.05. −Glu: without glutamate. +Glu: with glutamate. CTRL-1 & 2, SCA2-1 & 2 and SCA3-1 & 2 iPSC lines were used in the experiments.
Figure 5
Figure 5
A calcium stabilizer and anti-glutamate drugs alleviated the pathological phenotypes of SCA-iPSC-derived neuronal populations. SCA-iPSC-derived neurons were treated with Dantrolene, Riluzole, MK801 or NBQX and subjected to (A) TUNEL assay, (B) OCR analysis, and (C) calcium signal level analysis. The concentration of the drugs used: Dantrolene (50 μM, D50), Riluzole (1 μM, R1 or 0.5 μM, R0.5), MK801 (1 μM, MK1 or 0.5 μM, MK0.5) and NBOX 30, or 10 μM (N30, N10). Calcium signal data were compared among CTRL-, SCA2- and SCA3- iPSC-derived neurons treated with Dantrolene (50 μM), Riluzole (1 μM), MK801 (0.5 μM) or NBOX (30 μM) by measurement of Fluo-4 fluorescence intensity. All data represent the mean ± SD. *P < 0.05, **P < 0.01, ***P < 0.001. CTRL-1 & 2, SCA2-1 & 2 and SCA3-1 & 2 iPSC lines were used in the experiments.
Figure 6
Figure 6
Proposed model for glutamate-mediated SCA pathogenesis. In SCA2, the expression of glutamate receptor related genes, such as GRM3 and GRIA4 are normal under low/none glutamate conditions, leading to normal cell function (left panel). However, after long term glutamate exposure, glutamate receptor related genes are downregulated. Subsequently, increased intracellular calcium impairs mitochondrial function and eventually causes cell death (middle panel). In SCA3, the expression of glutamate receptor related genes is reduced under low/none glutamate conditions (left panel), leading to impaired cellular function. Long term glutamate exposure worsens the expression and cellular function impairment (middle panel). Riluzole or Dantrolene can mitigate the cell dysfunction from glutamate induced cell death by anti-glutamate or calcium stabilizing actions.

References

    1. Manto MU. The wide spectrum of spinocerebellar ataxias (SCAs) Cerebellum. 2005;4:2–6. doi: 10.1080/14734220510007914. - DOI - PubMed
    1. Paulson HL. The spinocerebellar ataxias. J Neuroophthalmol. 2009;29:227–237. doi: 10.1097/WNO0b013e3181b416de. - DOI - PMC - PubMed
    1. Durr A. Autosomal dominant cerebellar ataxias: polyglutamine expansions and beyond. The Lancet. Neurology. 2010;9:885–894. doi: 10.1016/S1474-4422(10)70183-6. - DOI - PubMed
    1. Matilla-Duenas A, et al. Consensus paper: pathological mechanisms underlying neurodegeneration in spinocerebellar ataxias. Cerebellum. 2014;13:269–302. doi: 10.1007/s12311-013-0539-y. - DOI - PMC - PubMed
    1. Warrick JM, et al. Expanded polyglutamine protein forms nuclear inclusions and causes neural degeneration in Drosophila. Cell. 1998;93:939–949. doi: 10.1016/S0092-8674(00)81200-3. - DOI - PubMed

Publication types