Comparative Study
. 2019 Feb 4;9(1):1130.
doi: 10.1038/s41598-018-37916-6.

Independent Left Ventricular Morphometric Atlases Show Consistent Relationships with Cardiovascular Risk Factors: A UK Biobank Study

Affiliations
Comparative Study

Independent Left Ventricular Morphometric Atlases Show Consistent Relationships with Cardiovascular Risk Factors: A UK Biobank Study

Kathleen Gilbert et al. Sci Rep. .

Abstract

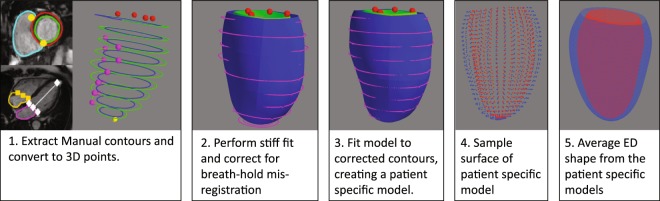
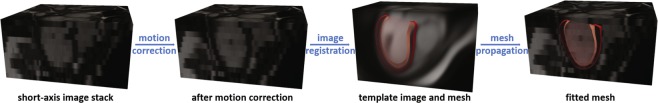
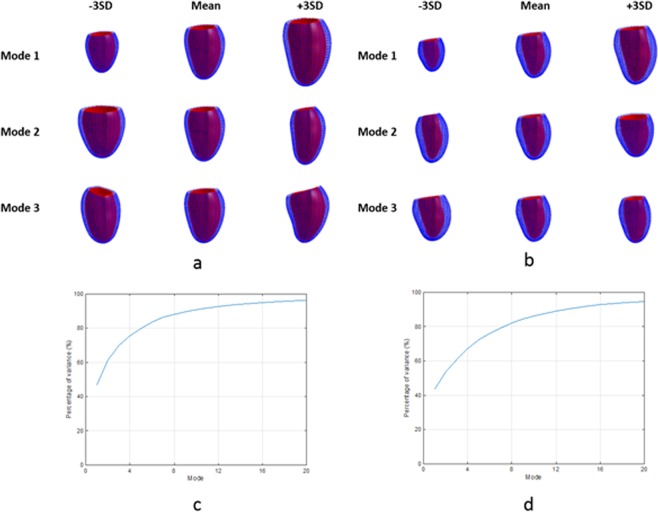
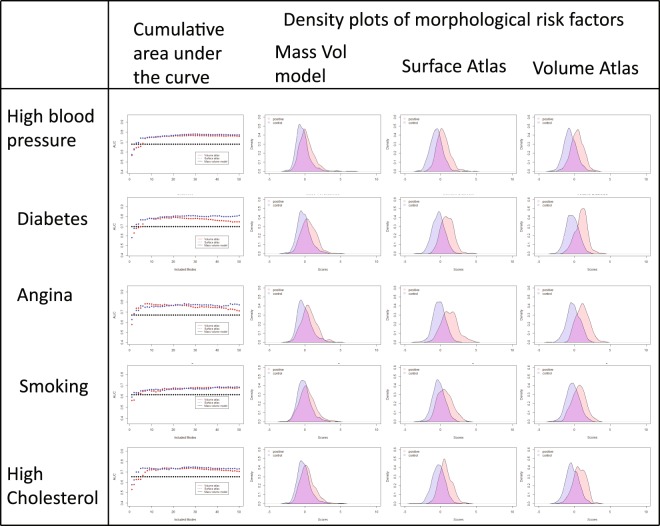
Left ventricular (LV) mass and volume are important indicators of clinical and pre-clinical disease processes. However, much of the shape information present in modern imaging examinations is currently ignored. Morphometric atlases enable precise quantification of shape and function, but there has been no objective comparison of different atlases in the same cohort. We compared two independent LV atlases using MRI scans of 4547 UK Biobank participants: (i) a volume atlas derived by automatic non-rigid registration of image volumes to a common template, and (ii) a surface atlas derived from manually drawn epicardial and endocardial surface contours. The strength of associations between atlas principal components and cardiovascular risk factors (smoking, diabetes, high blood pressure, high cholesterol and angina) were quantified with logistic regression models and five-fold cross validation, using area under the ROC curve (AUC) and Akaike Information Criterion (AIC) metrics. Both atlases exhibited similar principal components, showed similar relationships with risk factors, and had stronger associations (higher AUC and lower AIC) than a reference model based on LV mass and volume, for all risk factors (DeLong p < 0.05). Morphometric variations associated with each risk factor could be quantified and visualized and were similar between atlases. UK Biobank LV shape atlases are robust to construction method and show stronger relationships with cardiovascular risk factors than mass and volume.


Conflict of interest statement

S.E.P. provides consultancy to Circle Cardiovascular Imaging Inc, Calgary, Canada. A.Y. provides consultancy to Siemens Healthineers, Erlangen, Germany.

Figures

Figure 1
Figure 1
Surface atlas construction. Left to right: Images to average shape model.
Figure 2
Figure 2
Volume atlas construction. Left to right: Images to shape model.
Figure 3
Figure 3
Principal component analysis results for the surface atlas. (a) ED first three principal components; (b) ES first three principal components; (c) ED % variance explained for the first 20 modes; (d) ES % variance explained for the first 20 modes. The viewpoint is from the septum with the inferior wall on the left.
Figure 4
Figure 4
Principal component analysis results for the volume atlas. (a) ED first three principal components; (b) ES first three principal components; (c) ED % variance explained for the first 20 modes; (d) ES % variance explained for the first 20 modes. The viewpoint is from the septum with the inferior wall on the left.
Figure 5
Figure 5
Cumulative area under the curve with increasing numbers of modes included and density of morphometric risk factor scores. Scores for the reference (healthy) cohort are shown in blue and those for risk factor positive cases are shown in orange.
Figure 6
Figure 6
Morphometric risk factor shapes. The 9th and 95th percentile of the logistic regression models rendered at ED and ES. The average shapes were drawn with differences shown in the color scale yellow (outward surface movement) to blue (inward surface movement). View point is from the anterior, with septum on the left. Displacements are in mm.

References

    1. White HD, et al. Left ventricular end-systolic volume as the major determinant of survival after recovery from myocardial infarction. Circulation. 1987;76:44–51. doi: 10.1161/01.CIR.76.1.44. - DOI - PubMed
    1. Wong, S. P. et al. Relation of left ventricular sphericity to 10-year survival after acute myocardial infarction. Am J Cardiol94, 1270–1275, doi:S0002-9149(04)01224-X (2004). - PubMed
    1. Vakili BA, Okin PM, Devereux RB. Prognostic implications of left ventricular hypertrophy. Am Heart J. 2001;141:334–341. doi: 10.1067/mhj.2001.113218. - DOI - PubMed
    1. Bluemke, D. A. et al. The relationship of left ventricular mass and geometry to incident cardiovascular events: the MESA (Multi-Ethnic Study of Atherosclerosis) study. J Am Coll Cardiol. 52, 2148–2155, doi:S0735-1097(08)03231-2 (2008). - PMC - PubMed
    1. Littlejohns, T. J., Sudlow, C., Allen, N. E. & Collins, R. UK Biobank: opportunities for cardiovascular research. Eur Heart J., 10.1093/eurheartj/ehx254 (2017). - PMC - PubMed

Publication types