. 2019 Feb 4;9(1):1351.
doi: 10.1038/s41598-018-37448-z.

High percentages and activity of synovial fluid NK cells present in patients with advanced stage active Rheumatoid Arthritis

Affiliations

High percentages and activity of synovial fluid NK cells present in patients with advanced stage active Rheumatoid Arthritis

Rachel Yamin et al. Sci Rep. .

Abstract

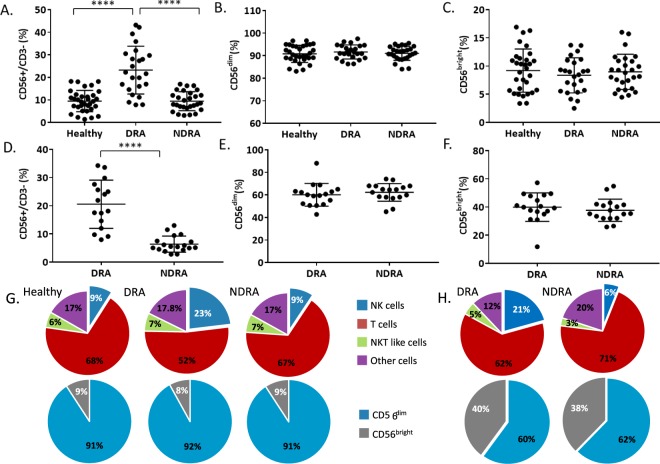
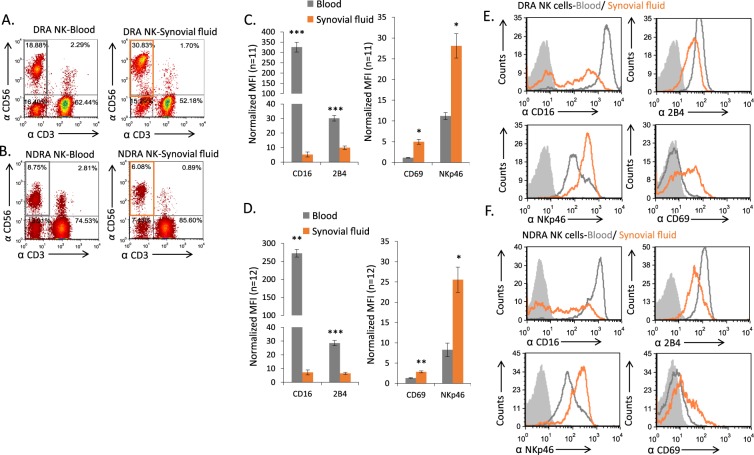
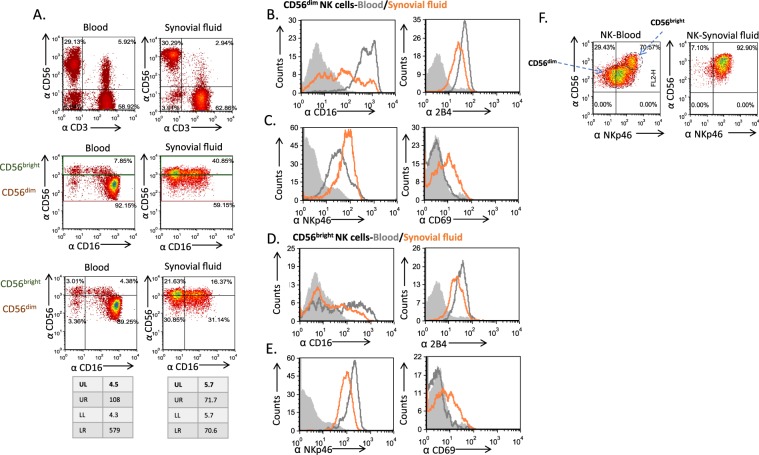
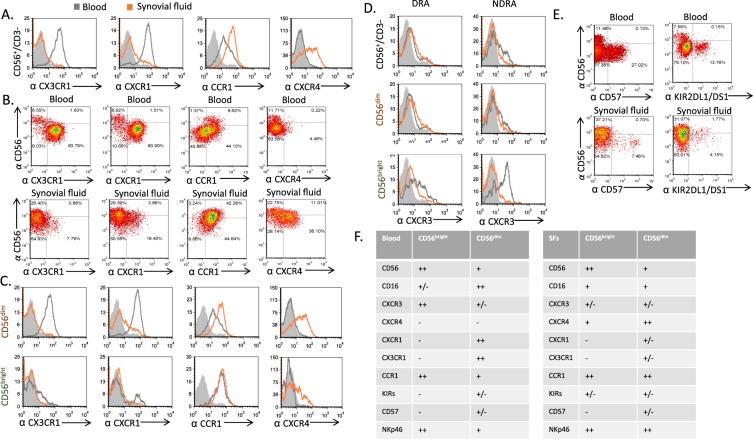
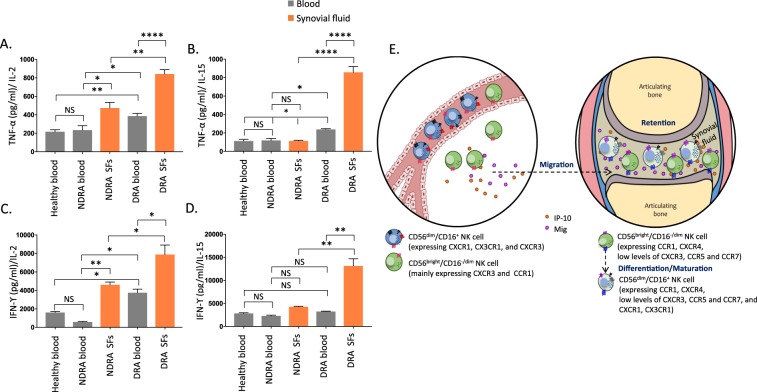
Rheumatoid Arthritis (RA) causes chronic inflammation of joints. The cytokines TNFα and IFNγ are central players in RA, however their source has not been fully elucidated. Natural Killer (NK) cells are best known for their role in elimination of viral-infected and transformed cells, and they secrete pro-inflammatory cytokines. NK cells are present in the synovial fluids (SFs) of RA patients and are considered to be important in bone destruction. However, the phenotype and function of NK cells in the SFs of patients with erosive deformative RA (DRA) versus non-deformative RA (NDRA) is poorly characterized. Here we characterize the NK cell populations present in the blood and SFs of DRA and NDRA patients. We demonstrate that a distinct population of activated synovial fluid NK (sfNK) cells constitutes a large proportion of immune cells found in the SFs of DRA patients. We discovered that although sfNK cells in both DRA and NDRA patients have similar phenotypes, they function differently. The DRA sfNK secrete more TNFα and IFNγ upon exposure to IL-2 and IL-15. Consequently, we suggest that sfNK cells may be a marker for more severely destructive RA disease.


Conflict of interest statement

The authors declare no competing interests.

Figures

Figure 1
Figure 1
Increase of NK cell percentages in the peripheral blood and SFs of DRA patients. (A–C) Peripheral blood mononuclear cells (PBMCs) were isolated from healthy controls (n = 32), DRA patients (n = 24), and NDRA patients (n = 27). The mean percentages and standard deviations of NK cells (CD56+/CD3, A) and different NK cell sub-populations (CD56dim, B, CD56bright, C) in the blood of each group are shown in the graphs. *The ratio of CD56+/CD3 varies significantly among the three groups (****p < 10−11). Two of the three post hoc pairwise tests (blood DRA versus healthy or blood DRA versus NDRA) were also very highly significant (****p < 10−5). (DF) Mononuclear cells were isolated from SFs of DRA patients (left panels, n = 16), and NDRA patients (right panels, n = 18) described in (AC). The mean percentages and standard deviations of sfNK cells (CD56+/CD3, D) and different NK cell sub-populations (CD56dim, E, CD56bright, F) in the SFs of each group are shown in the graphs.****p < 10−6 (G) Pie charts summarizing the different sub-populations of immune cells derived from the blood of healthy controls, DRA and NDRA patients (upper charts), and the different sub-populations of blood CD56dim and CD56bright NK cells (lower charts) derived from healthy controls, DRA and NDRA patients described in (A–C). (H) Pie charts summarizing the different sub-populations of immune cells derived from the SFs of DRA and NDRA patients (upper charts), and the different sub-populations of SFs CD56dim and CD56bright NK cells (lower charts) derived from DRA and NDRA patients described in (DF).
Figure 2
Figure 2
Alterations in NK receptors expressed on cells in blood and SFs of DRA and NDRA patients. (A,B) NK cells from peripheral blood (A, left, gray rectangle) or SFs (A, right, orange rectangle) of DRA, and blood and SFs NK cells of NDRA patients (B, left for blood, right for SFs) were double stained with anti CD56, anti CD3, and then triple stained with various monoclonal antibodies directed against different NK receptors. (C) Summary of data from FACS stainings of 11 DRA patients for the CD16, 2B4, NKp46 receptors and CD69 are presented as mean ± SE. (D) Summary of data from FACS stainings of 12 NDRA patients for the CD16, 2B4, NKp46 receptors and CD69 are presented as mean ± SE. Normalized MFI represents the specific MFI of an individual staining divided by the MFI of the background staining with an isotype control. Representative FACS staining of a DRA and NDRA patient is shown in E, and F, respectively. Open gray histograms show the staining of the receptors on cells from the peripheral blood. Open orange histograms indicate cells from the SFs. Filled gray histograms show the background staining of cells from the SFs with an isotype control. The backgrounds of the PBMCs were similar to the SF cells and are not shown in the figure. *p < 0.05. **p < 0.005. ***p < 0.0005.
Figure 3
Figure 3
Blood and sfNK cell subsets are different. (A–C) Difference and similarity between subsets of blood and sfNK cells (A) Representative staining of mononuclear cells isolated from peripheral blood (left panels) and SFs (right panels) of DRA patient with anti CD56, anti CD3 and anti CD16. Following CD56+/CD3 (NK cells) gating (upper panels), the CD56dim and CD56bright NK cells were gated (middle panels). The percentages and the MFI of the CD16 expression on the NK cell subsets are shown in the lower panels. Analysis of stainings of NK cell subsets of the study patients is shown in Fig. 1 (B) Mononuclear cells from peripheral blood or SFs of DRA patients were quadruple stained with anti CD56, anti CD3, anti CD16 and various monoclonal antibodies directed against the different NK receptors. CD56dim and CD56bright NK cells were gated, and the expression of NK receptors CD16 (B,D, left), 2B4 (B,D, right), NKp46 (C,E, left), and CD69 (C,E, right) was determined. Figure shows staining of cells from one representative donor out of 7 described in Fig. 2 that were tested. Open gray histograms and open orange histograms show the staining of the receptors on cells from the peripheral blood and the SFs, respectively. Filled gray histograms show the background staining of cells from the SFs with an isotype control. The backgrounds of the PBMCs were similar to the SFs cells and are not shown in the figure. (F) Representative triple staining with anti CD56, anti CD3, and NKp46 on blood and sfNK cells derived from a DRA patient. The two NK cell subsets are marked with circles. Figure shows staining of cells from one representative donor out of 7 described in Fig. 2 that were tested.
Figure 4
Figure 4
Alterations in NK receptors expressed on CD56dim and CD56bright subsets present in the blood and SFs of DRA and NDRA patients. (A–C) Representative FACS analysis of the expression level of various chemokine receptors on whole NK cells (A,B), CD56dim (C, upper panels) and CD56bright (C, lower panels) NK subsets from the blood (open gray histograms) or the SFs (open orange histograms) of DRA patient (staining of representative NDRA patient is shown in Fig. S3A). Filled gray histograms show the background staining of cells from the SFs with an isotype control. Figure shows staining of cells from one representative donor out of 6 that were tested. (D) Representative FACS analysis of the expression level of CXCR3 chemokine receptor on whole NK cells (histograms, upper panels), CD56dim (middle panels) and CD56bright (lower panels) NK subsets from the blood (open gray histograms) or the SFs (open orange histograms) of DRA and NDRA patients. Filled gray histograms show the background staining of cells from the SFs with an isotype control. Figure shows staining of cells from one representative donor out of 6 that were tested. (E) FACS staining of blood (upper panels) and sfNK cells (lower panels) of DRA patient with anti-CD3, anti-CD56 and specific antibodies against CD57 (left panels), and various KIRs receptors (right panels), with KIR2DL1/DS1 shown as a representative. A gate was set on CD56+/CD3 (NK cells), versus CD57 or specific KIR is shown. Figure shows staining of cells from one representative donor (for each receptor) out of 6 that were tested. Similar staining of blood and sfNK cells of an NDRA patient is shown in Supplementary Fig. 3C. (E) Table summarizing differences between blood (left) and SFs (right) CD56bright and CD56dim NK cells ((++, strong expression (bright); +, weak expression (dim); +/−, expression only on a subpopulation; −, no expression)).
Figure 5
Figure 5
sfNK cells from DRA patients secrete higher levels of TNFα and IFNγ compared with sfNK cells from NDRA patients following incubation with IL-2 or IL-15. (A) NK cells sorted from a pool of blood of 6 normal controls and a pool of blood and SFs of 9 DRA and 10 NDRA patients described in Tables 1–3, incubated with either rhIL-2 or rhIL-15 following 48 h of standardization (dividing equal number of cells per well from each condition before starting the ELISA experiments). TNF-α (A,B) and IFN-γ (C,D) secretion in supernatants of NK cells isolated from blood of normal controls, DRA or NDRA patients, or from SFs of DRA and NDRA patients, incubated with either IL-2 (A,C), or IL-15 (B,D) was detected by ELISA and represented as pg/ml. Figure shows one representative experiment out of 4 performed. The TNF-α and IFN-γ dosage varies significantly among the groups (*p < 10−8) as determined by a One-Way ANOVA test. Various post hoc pairwise tests were highly significant after correcting for multiple comparisons. *p < 0.05, **p < 0.007, ****p < 10−5. The error bars are derived from triplicates. (E) Proposed model. CD56bright CD16−/dim NK cells migrate out of the peripheral blood to the joint of RA patients. In the peripheral blood, CD56bright CD16−/dim NK cells (green) mainly express CXCR3 and CCR1 and migrate towards their ligands present in the SFs of RA patients. In the SFs, the CD56bright CD16−/dim NK cells decrease the expression of CXCR3, acquire the expression of other chemokine receptors (mainly CXCR4, but also CCR5 and CCR7) and become activated. Around half of the sfNK cells in DRA patients differentiate into the CD56dimCD16+ NK cells. Upon interaction with IL-15 and IL-2 sfNK cells secrete TNFα and IFNγ.

References

    1. Shah, A. & Clair, E. W. St. Rheumatoid Arthritis. In Harrison’s Principles of Internal Medicine, 19e (eds Kasper, D. et al.) (McGraw-Hill Education, New York, NY, 2015).
    1. Cope AP, Schulze-Koops H, Aringer M. The central role of T cells in rheumatoid arthritis. Clin Exp Rheumatol. 2007;25:S4–11. - PubMed
    1. Gur C, et al. The activating receptor NKp46 is essential for the development of type 1 diabetes. Nat Immunol. 2010;11:121–128. doi: 10.1038/ni.1834. - DOI - PubMed
    1. Seidel E, Glasner A, Mandelboim O. Virus-mediated inhibition of natural cytotoxicity receptor recognition. Cell Mol Life Sci. 2012;69:3911–3920. doi: 10.1007/s00018-012-1001-x. - DOI - PMC - PubMed
    1. Koch J, Steinle A, Watzl C, Mandelboim O. Activating natural cytotoxicity receptors of natural killer cells in cancer and infection. Trends Immunol. 2013;34:182–191. doi: 10.1016/j.it.2013.01.003. - DOI - PubMed

Substances