. 2019 Aug;33(8):1978-1995.
doi: 10.1038/s41375-019-0379-y. Epub 2019 Feb 4.

Cytokine production in myelofibrosis exhibits differential responsiveness to JAK-STAT, MAP kinase, and NFκB signaling

Affiliations

Cytokine production in myelofibrosis exhibits differential responsiveness to JAK-STAT, MAP kinase, and NFκB signaling

Daniel A C Fisher et al. Leukemia. 2019 Aug.

Abstract

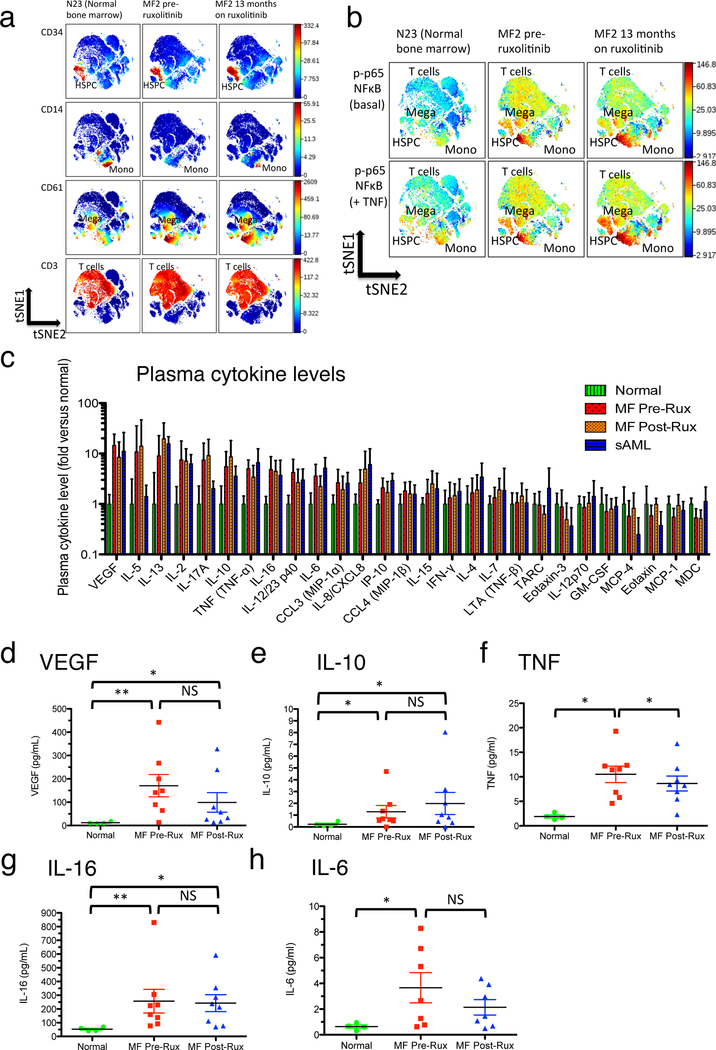
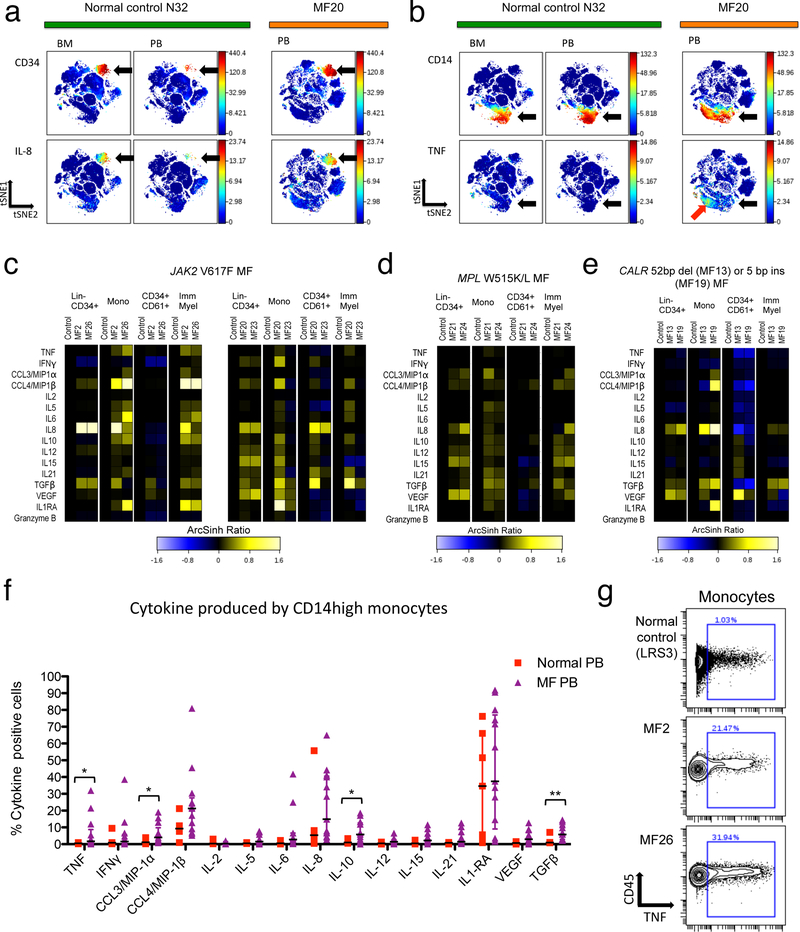
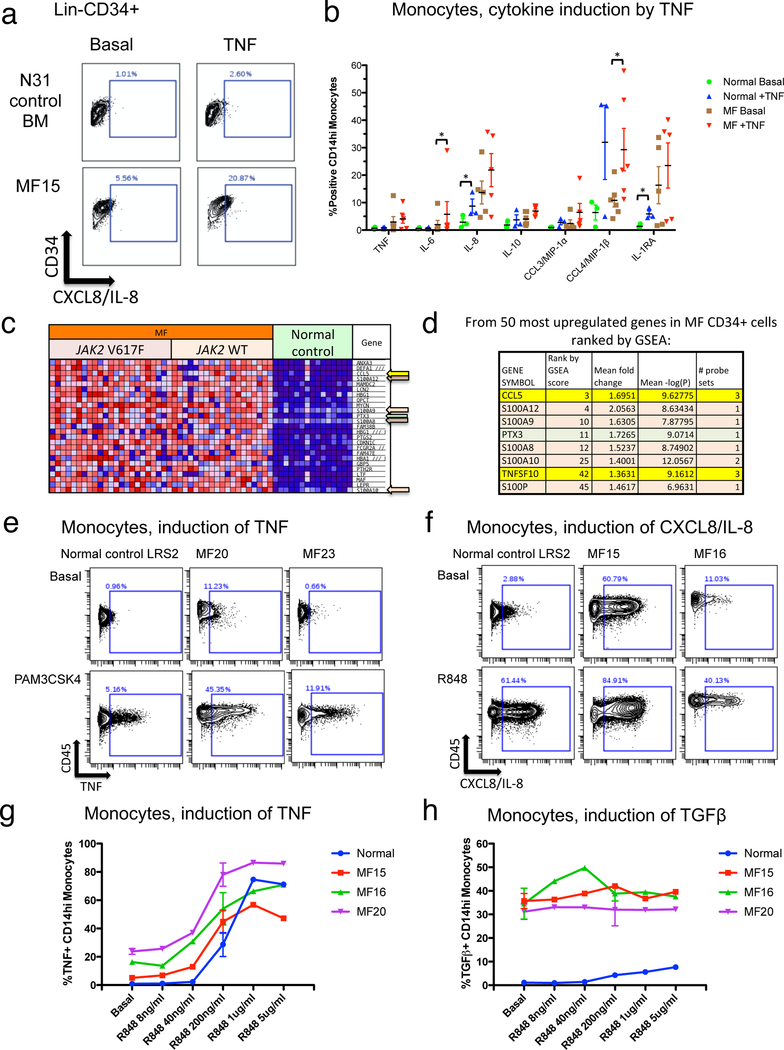
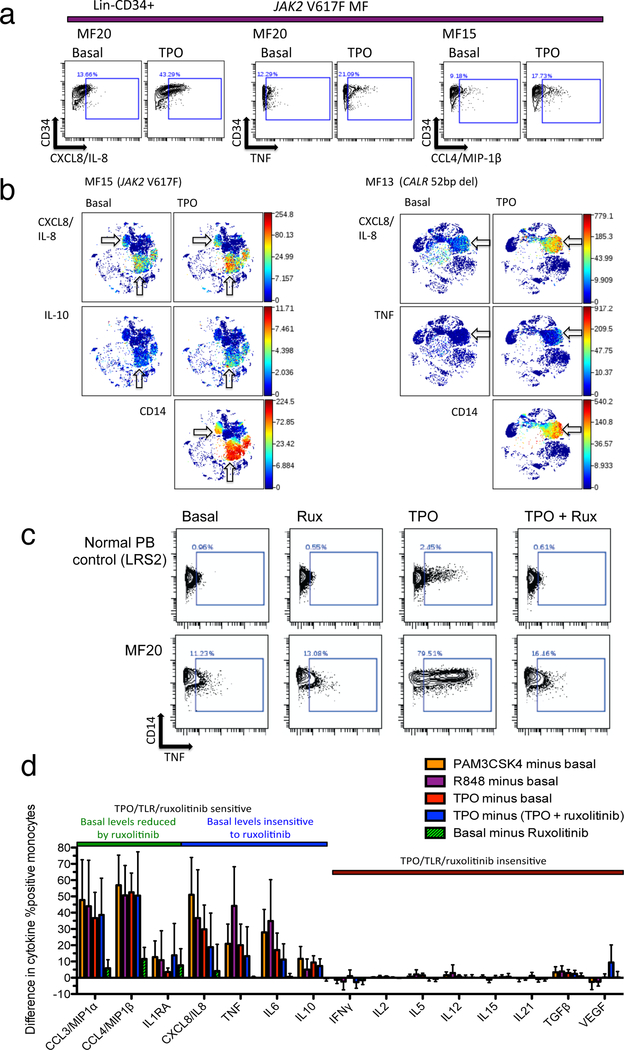
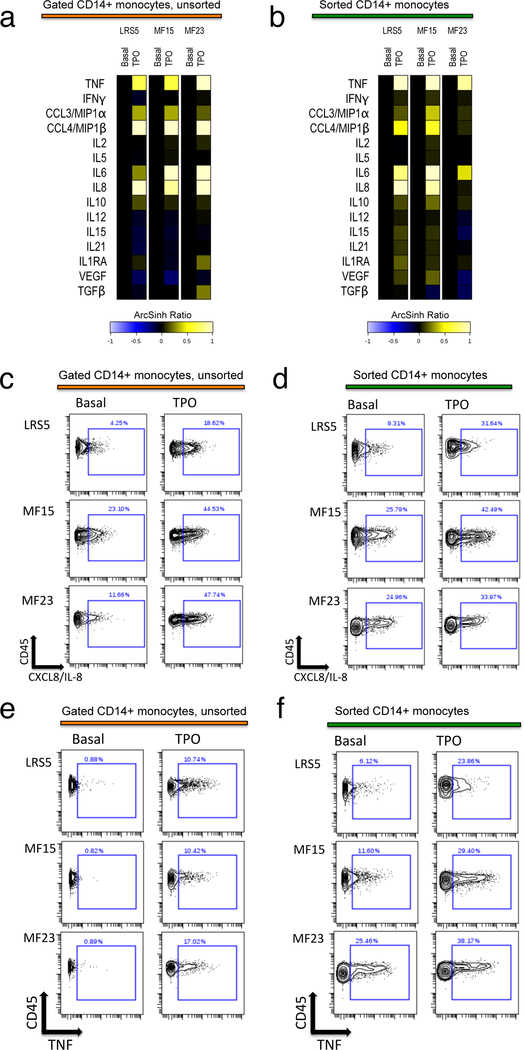
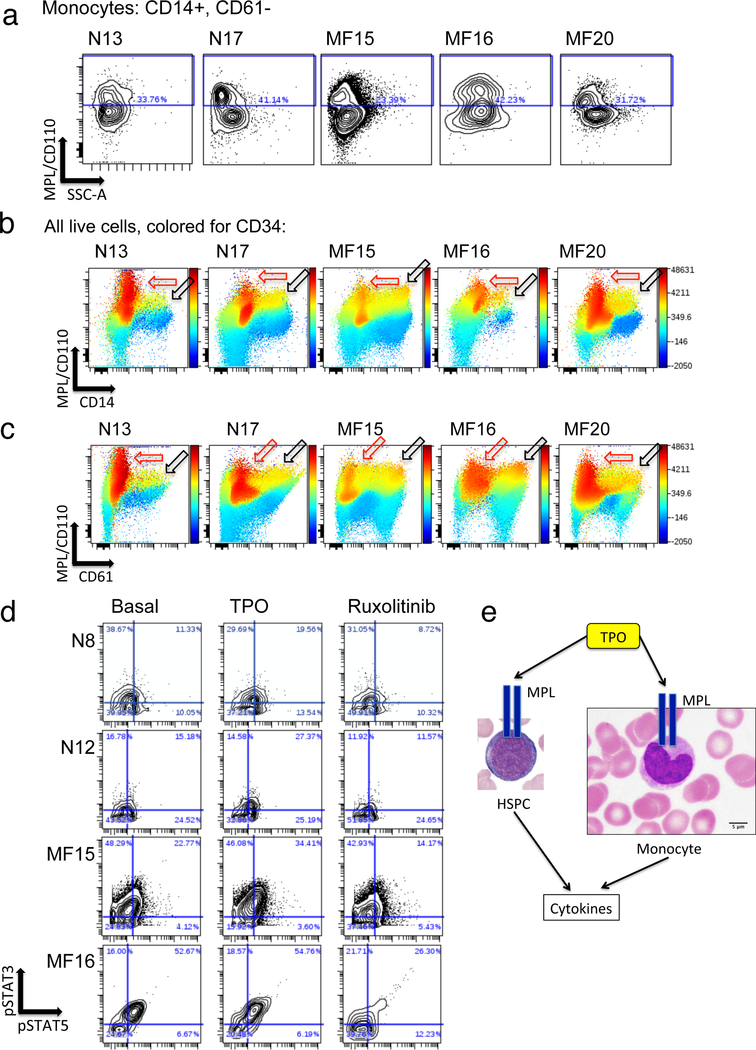
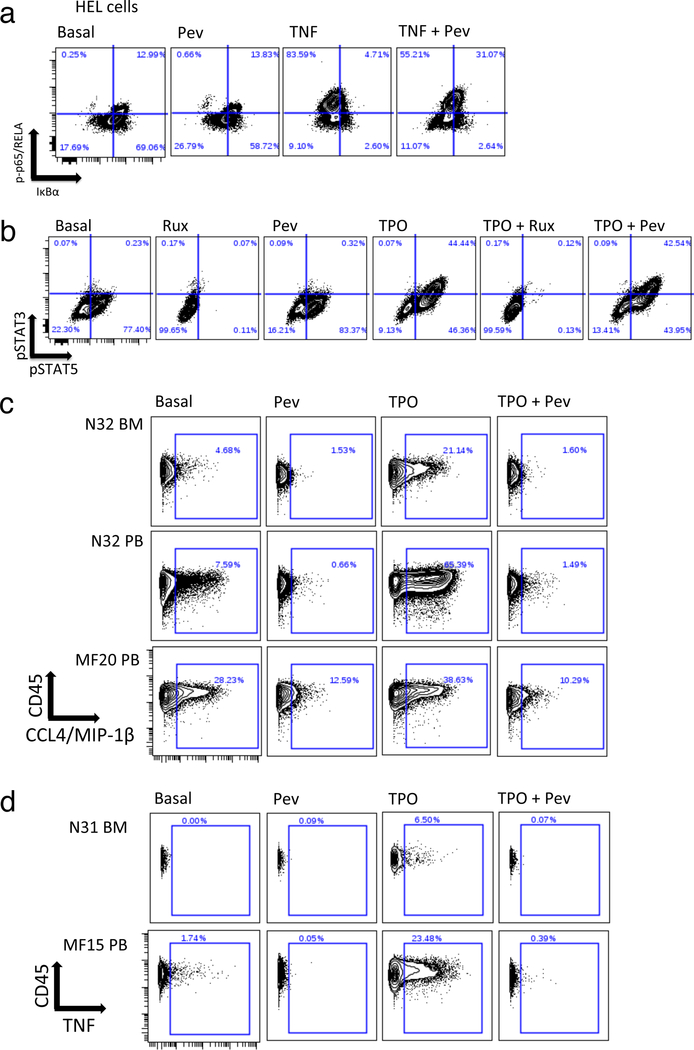
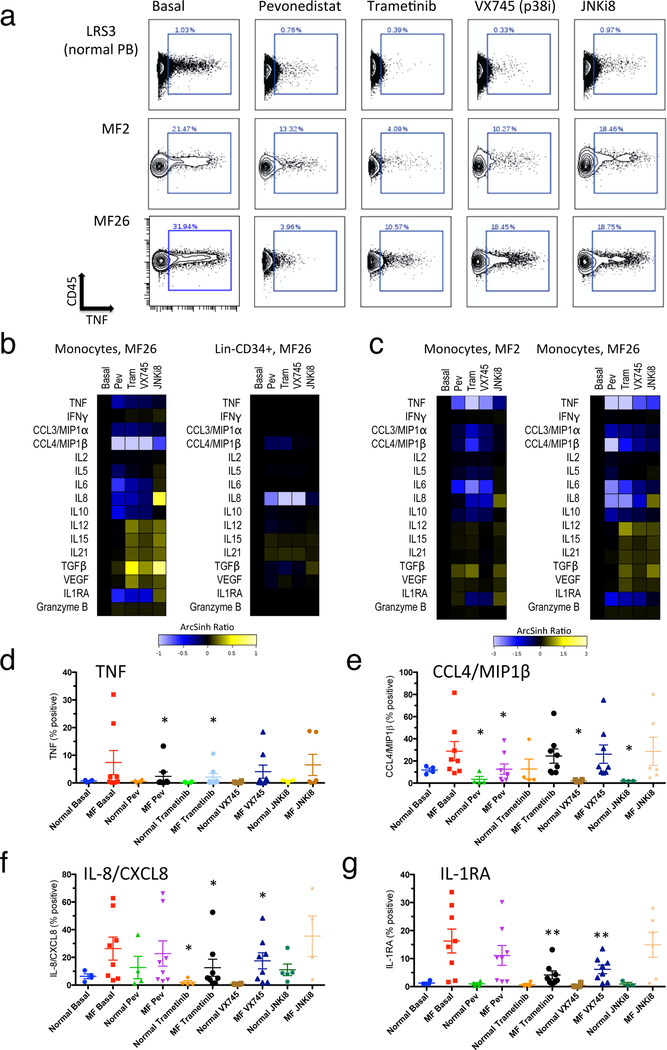
The distinct clinical features of myelofibrosis (MF) have been attributed in part to dysregulated inflammatory cytokine production. Circulating cytokine levels are elevated in MF patients; a subset of which have been shown to be poor prognostic indicators. In this study, cytokine overproduction was examined in MF patient plasma and in MF blood cells ex vivo using mass cytometry. Plasma cytokines measured following treatment with ruxolitinib remained markedly abnormal, indicating that aberrant cytokine production persists despite therapeutic JAK2 inhibition. In MF patient samples, 14/15 cytokines measured by mass cytometry were found to be constitutively overproduced, with the principal cellular source for most cytokines being monocytes, implicating a non-cell-autonomous role for monocyte-derived cytokines impacting disease-propagating stem/progenitor cells in MF. The majority of cytokines elevated in MF exhibited ex vivo hypersensitivity to thrombopoietin (TPO), toll-like receptor (TLR) ligands, and/or tumor necrosis factor (TNF). A subset of this group (including TNF, IL-6, IL-8, IL-10) was minimally sensitive to ruxolitinib. All TPO/TLR/TNF-sensitive cytokines, however, were sensitive to pharmacologic inhibition of NFκB and/or MAP kinase signaling. These results indicate that NFκB and MAP kinase signaling maintain cytokine overproduction in MF, and that inhibition of these pathways may provide optimal control of inflammatory pathophysiology in MF.


Conflict of interest statement

Disclosure of Conflicts of Interest

The authors report no conflicts of interest.

Figures

Figure 1.
Figure 1.. Persistence of NFκB activation and plasma cytokine elevations in myelofibrosis despite ruxolitinib.
a. Mass cytometry surface marker labeling to identify cell populations in viSNE. viSNE plots show (top to bottom) labeling for CD34+ (HSPC), CD14+ (monocytes), CD61+ (megakaryoblasts), and CD3+ (T cells) populations. Samples are (left to right) normal control bone marrow N23, MF2 (JAK2 V617F mutant MF post ET) blood immediately prior to commencing ruxolitinib therapy, and MF2 blood after 13 months of ruxolitinib therapy. b. Mass cytometry labeling of p-p65/RELA for samples illustrated in a. Upper panels are basal unstimulated p-p65/RELA. Lower panels are p-p65/RELA following 15 minute ex vivo incubation with 20ng/mL TNF. c. Plasma cytokine levels observed in patient samples, normalized to levels observed in healthy controls. Error bars indicate mean +/− 95% CI. Cytokines are positioned left to right by rank of highest to lowest fold elevation in pre-ruxolitinib MF plasma versus healthy control (measured values shown in Supplementary Table S5). Bars are normalized to mean of levels in healthy controls (N=4; Supplementary Table S1), including zero values, but cytokines undetected in normal plasmas are excluded (Supplementary Table S5). Patient sample sizes are MF Pre- and Post-ruxolitinib, N=8; sAML, N=6. d-h: Individual plasma cytokine measurements (mean of two replicates per individual from MSD array), comparing normal control (Normal), MF patients prior to commencing ruxolitinib therapy (MF Pre-Rux), and the same patients on ruxolitinib (MF Post, Rux; see Supplementary Table S2B for durations of ruxolitinib treatment). Error bars = mean +/− SEM. Significance was determined by Mann-Whitney U-test for disease versus normal comparisons, and by paired T-test for pre- versus post-ruxolitinib comparisons: *, P<0.05; **, P<0.01. d. VEGF. e. IL-10. f. TNF. g. IL-16. h. IL-6.
Figure 2.
Figure 2.. Cytokine overproduction in MF myeloid cell populations.
a-d: viSNE analysis comparing normal control N32 bone marrow, N32 blood, and blood from MF20 (JAK2 V617F mutant PMF). a. CD34 (upper panels) and CXCL8/IL-8 (lower panels) are shown, with arrows indicating HSPC. b. CD14 (upper panels) and TNF (lower panels) are shown, with black arrows indicating monocytes and red arrow indicating a subset of monocytes expressing TNF in MF20 blood. c-e. Heat maps showing median staining for 15 cytokines plus granzyme B, normalized to normal control blood levels (left column of each panel) on ArcSinh ratio scale. Heat map panels show (left to right) blood from two MF patients versus one healthy control (from an individual experiment) for the cell populations: Lin-CD34+ HSPC, CD14+ monocytes (Mono), CD34+CD61+ megakaryoblasts, and CD11b+CD11c+CD34- immature myeloid cells (Imm Myel). c. JAK2 V617F mutant MF patients MF2, MF26, MF20, and MF23 versus controls. d. MPL mutant patients MF21 and MF24 versus controls. e. CALR mutant patients MF13 and MF19 versus controls. f. Percent of monocytes manually gated as clearly positive for expression of each of the 15 cytokines. Plots show samples for normal peripheral blood (N=7) and MF blood (N=13: 7 JAK2 V617F mutant, 4 CALR mutant, 2 MPL W515L/K mutant). Error bars indicate median +/− interquartile range. Significance was determined by Mann-Whitney U-test: *, P<0.05; **, P<0.01. g. Biaxial plots illustrating positive versus negative gating (as used in f and Supplementary Figure S7) for TNF from a normal blood control sample and two JAK2 V617F mutant MF patients.
Figure 3.
Figure 3.. NFκB activating ligands induce a set of MF overproduced cytokines.
a. Biaxial graphs showing production of CXCL8/IL-8 in the Lin-CD34+ population basally (left) or following 4-hour incubation with 20ng/mL TNF (right). Bone marrow from healthy control N31 (above) is compared to blood from MF patient MF15 (JAK2 V617F mutant MF post ET, below). The positive gate shows cells with CXCL8/IL-8 levels above ~99% of the basal control population. b. Cytokine induction by TNF in monocytes. Column graph shows the percent of cells identified as expressing a given cytokine (from biaxial flow plots; Supplementary Figure S7), both basally and following 4-hour incubation with 20ng/mL TNF. Data are shown from both normal blood control samples (N=3) and MF patient samples (N=6; 4 JAK2 V617F mutant, 2 CALR mutant, Supplementary Table S2). Error bars = mean +/− SEM. Statistical significance is shown between basal and TNF-treated samples where identified (*, P<0.05) by Wilcoxon sign-rank test. c. Heat map of gene expression profiling (GEP) analysis, showing the top 25 most upregulated genes in MF versus normal bone marrow CD34+ cells, ranked by gene set enrichment analysis (GSEA) score (“Materials and Methods”). d. TLR and NFκB signaling related genes from among the 50 most upregulated genes in MF CD34+ cells ranked by GSEA., Genes denoted by arrows in c are listed (those in the ranking range of 1–25, plus two additional genes in the ranking range of 26–50), with corresponding GSEA rank, mean fold change (MF/control), and mean –log(P). These include S100 family endogenous TLR ligands (peach highlight), inflammatory cytokines that are targets of NFκB signaling (yellow highlight), and the inflammatory TLR/NFκB target PTX3 (green highlight). e. Biaxial plots showing production of TNF in monocytes basally (top) and after 4-hour incubation with 50ng/mL PAM3CSK4 (bottom). Monocytes from normal control blood are shown along with those from JAK2 V617F mutant MF patients MF20 and MF23. f. Biaxial plots showing production of CXCL8/IL-8 basally (top) and after 4-hour incubation with 5μg/mL R848 (bottom). Monocytes from normal control blood are shown along with those from JAK2 V617F mutant MF patients MF15 and MF16. g. Dose-response showing induction of TNF in response to R848. h. Dose-response showing induction of TGFβ in response to R848. Error bars in g-h = mean +/− SD.
Figure 4.
Figure 4.. Differential myeloid cytokine induction by TPO and inhibition by ruxolitinib.
a. Biaxial graphs show cytokine production in Lin-CD34+ cells from JAK2 V617F mutant MF patients basally and after 4-hour incubation with 10ng/mL TPO. The positive gate corresponds to cytokine levels above 99% of the healthy control basal population from the same experiment (Supplementary Figure S12). b. viSNE plots show cytokine levels basally and induced by TPO in JAK2 V617F mutant MF patient MF15 (left) and CALR mutant MF patient MF13 (right). Arrows indicate cell populations producing cytokines CXCL8/IL-8, IL-10, and TNF. Bottom panels show CD14 labeling of monocytes. c. Biaxial graphs show TNF in monocytes from healthy control LRS2 (above) and JAK2 V617F mutant MF patient MF20 (below) following 4-hour incubation conditions (left to right): basal, 5μM ruxolitinib, 10ng/mL TPO, TPO plus ruxolitinib. The positive gate corresponds to cytokine levels above 99% of the healthy control basal population. d. Sensitivity of MF overproduced cytokines to TPO, TLR ligands and ruxolitinib, shown as bar graph with differences in MF patient values (% positive, as in c) according to the following comparisons: PAM3CSK4, R848, or TPO minus basal, TPO minus (TPO + ruxolitinib), and basal minus ruxolitinib. The latter two comparisons illustrate inhibition of cytokine either TPO-induced or basal cytokine production by ruxolitinib. Error bars show mean +/− 95% CI. Colored bar above graph denotes separation of cytokines into groups based on reduction of basal cytokine levels by ruxolitinib (green versus blue) and sensitivity to TPO and TLR ligand stimulation and ruxolitinib inhibition (green/blue versus brown).
Figure 5.
Figure 5.. Direct induction of monocyte expressed cytokines by TPO.
A, B: Heat maps comparing induction of CD14+ monocyte expressed cytokines by TPO, in monocytes within cryopreserved and stimulated PBMC cultures (a) versus isolated flow-sorted CD14+ monocytes from the identical individuals (b). Original cryopreserved samples used for a, b were identical, and treatment with TPO was simultaneous (see Supplementary Methods). Heat maps illustrate the 90th percentile level of TPO-induced versus basal unstimulated cytokine expression, in ArcSinh ratio scale. PBMC from control LRS5 and JAK2 V617F mutant MF patients MF15 and MF23 were utilized. c-f: Biaxial contour plots show cytokine-positive gating in monocytes (Y axis = CD45, X axis = cytokine) for IL-8/CXCL8 (c, d) and TNF (e, f); comparing unsorted monocytes from PBMC cultures (c, e) versus isolated flow-sorted monocytes (d, f), from control LRS5 and JAK2 V617F mutant MF patients MF15 and MF23. Percent of monocytes gated as cytokine positive is denoted by rectangle gate.
Figure 6.
Figure 6.. Evidence for MPL expression on monocytic and megakaryocytic lineage cells.
a. Expression of CD110/MPL (Y axis) visualized by fluorescent flow cytometry versus side scatter (X axis) in CD14+ monocytes from two normal control bone marrow samples (N13 and N17) and blood from three JAK2 V617F mutant MF patients (MF15, MF16, MF20). CD14+ monocytes were also gated as negative for 7AAD (viability marker), CD3, CD19, CD16, and CD61 (see Supplementary Methods). b, c: Visualization of all live cells from the same same experiment as a, potted by CD110/MPL (Y axis) versus CD14 (b) or CD61 (c), and colored by intensity of labeling for CD34. Note highest levels of CD110/MPL expression in CD34+ high expressing cells (red outlined arrows) and high levels in CD34+/intermediate cells also expressing CD14 (black outlined arrows in b) or CD61 (black outlined arrows in c). d. Biaxial contour plots illustrate phosphorylation of STAT3 (Y axis) and STAT5 (X axis) in gated monocytes as assayed by mass cytometry. Plots are shown for normal bone marrow controls N8 and N12 and JAK2 V617F mutant MF patients MF15 and MF16. Conditions shown (left to right) are basal unstimulated, 15 min with 10ng/mL TPO, and 1h with 5μM ruxolitinib. The quadrant gate shows the percent of cells identified as positive for pSTAT3 and/or pSTAT5. Basal STAT3,5 phosphorylation (compare MF15 and MF16 versus N8 and N12) may be a consequence of constitutive JAK2 kinase activity. e. Schematic illustrating the hypothesis that cytokine expression is induced by TPO in monocytes as in HSPC, directly via the TPO receptor MPL.
Figure 7.
Figure 7.. Inhibition of TPO induced cytokine production by pevonedistat.
a, b: Responses to pevonedistat versus other stimuli in HEL cells. a. Biaxial plots showing p-p65/RELA (Y axis) versus total IκBα (X axis) in the following conditions (left to right): basal, 1h incubation with 1μM pevonedistat, 15 min incubation with 20ng/mL TNF, 1h incubation with 1μM pevonedistat followed by 15 min incubation with 20ng/mL TNF. Quadrant gate illustrates degradation of IκBα and phosphorylation of p65/RELA on S529. b. Biaxial plots showing phosphorylation of STAT3 (Y axis) and STAT5 (X axis) in the following conditions (left to right): basal, 1h incubation with 5 μM ruxolitinib, 1h incubation with 1μM pevonedistat, 15 min incubation with 10ng/mL TPO, 1h incubation with 5 μM ruxolitinib followed by 15 min incubation with 10ng/mL TPO, 1h incubation with 1μM pevonedistat followed by 15 min incubation with 10ng/mL TPO. c. Biaxial plots showing CCL4/MIP-1β (X axis) versus CD45 (Y axis) in control (N32 BM and PB) versus MF20 (JAK2 V617F mutant PMF) CD14+ blood monocytes. Conditions shown (left to right) correspond to the following 4-hour incubations: basal, 1μM pevonedistat, 10ng/mL TPO, 1μM pevonedistat plus 10ng/mL TPO. d. Biaxial plots showing TNF (X axis) versus CD45 (Y axis) in control (N31 BM) versus MF15 (JAK2 V617F mutant post ET, blood) CD14+ monocytes. The following 4-hour incubations are shown (left to right): basal, 10ng/mL TPO, 1μM pevonedistat, 1μM pevonedistat plus 10ng/mL TPO.
Figure 8.
Figure 8.. Reduction of basally elevated MF cytokine levels by signaling inhibitors.
a. Biaxial plots showing TNF (X axis) versus CD45 (Y axis) in CD14+ monocytes from healthy control (LRS3 PB, top row) and JAK2 V617F mutant MF patients MF2 and MF26 (lower rows). The following 4-hour incubations are shown (left to right): basal, 1μM pevonedistat, 10μM trametinib, 1μM VX-745, 1μM JNKi8. b-c: Heat maps showing staining for 15 cytokines plus granzyme B, in ArcSihn ratio scale with values from inhibitor-treated cells normalized to basal (left column of each heat map). Columns left to right in each heat map represent 4-hour incubations conditions as in a. Abbreviations Pev = pevonedistat, Tram = trametinib. b. Median cytokine levels in CD14+ monocytes (left) and Lin-CD34+ cells (right) from MF26 (JAK2 V617F mutant MF post PV). c. 90th percentile cytokine levels in CD14+ monocytes from JAK2 V617F mutant MF patients MF2 and MF26. d-g: Statistical representation of suppression of basal cytokine production by signaling inhibitors in monocytes. Percent of monocytes identified as expressing each cytokine shown (from biaxial plots, as in a) from healthy control (N=4) or MF patient (N=8; 6 JAK2 V617F mutant and 2 CALR mutant) blood samples. Results are shown for the cytokines TNF (d), CCL4/MIP1β (e), IL-8/CXCL8 (f) and IL-1RA (g). Error bars = mean +/− SEM. Statistical significance is shown between basal and inhibitor treated samples where identified by Wilcoxon sign-rank test (*, P<0.05; **, P<0.01).

References

    1. Elf S, Abdelfattah NS, Chen E, Perales-Paton J, Rosen EA, Ko A, et al. Mutant Calreticulin Requires Both Its Mutant C-terminus and the Thrombopoietin Receptor for Oncogenic Transformation. Cancer Discov 2016; 6(4): 368–81. - PMC - PubMed
    1. Oh ST, Simonds EF, Jones C, Hale MB, Goltsev Y, Gibbs KD Jr., , et al. Novel mutations in the inhibitory adaptor protein LNK drive JAK-STAT signaling in patients with myeloproliferative neoplasms. Blood 2010; 116(6): 988–92. - PMC - PubMed
    1. Vainchenker W, Kralovics R. Genetic basis and molecular pathophysiology of classical myeloproliferative neoplasms. Blood 2017; 129(6): 667–79. - PubMed
    1. Zhou A, Oh ST. Prognostication in MF: from CBC to cytogenetics to molecular markers. Best Pract Res Clin Haematol 2014; 27(2): 155–64. - PubMed
    1. Tefferi A, Lasho TL, Finke CM, Knudson RA, Ketterling R, Hanson CH, et al. CALR vs JAK2 vs MPL-mutated or triple-negative myelofibrosis: clinical, cytogenetic and molecular comparisons. Leukemia 2014; 28(7): 1472–7. - PubMed

Publication types

MeSH terms

LinkOut - more resources