. 2019 Jun;13(6):1391-1403.
doi: 10.1038/s41396-019-0359-2. Epub 2019 Feb 4.

Evolution of substrate-specific gene expression and RNA editing in brown rot wood-decaying fungi

Affiliations

Evolution of substrate-specific gene expression and RNA editing in brown rot wood-decaying fungi

Baojun Wu et al. ISME J. 2019 Jun.

Retraction in

Abstract

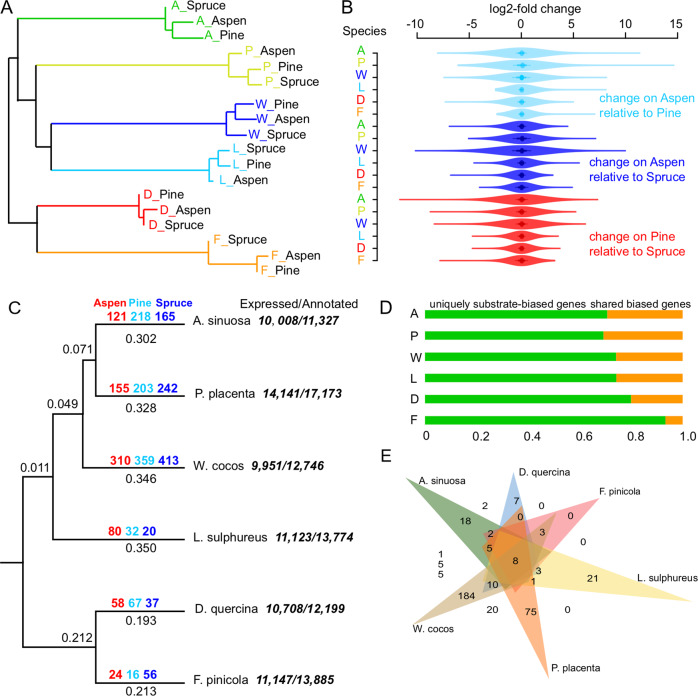
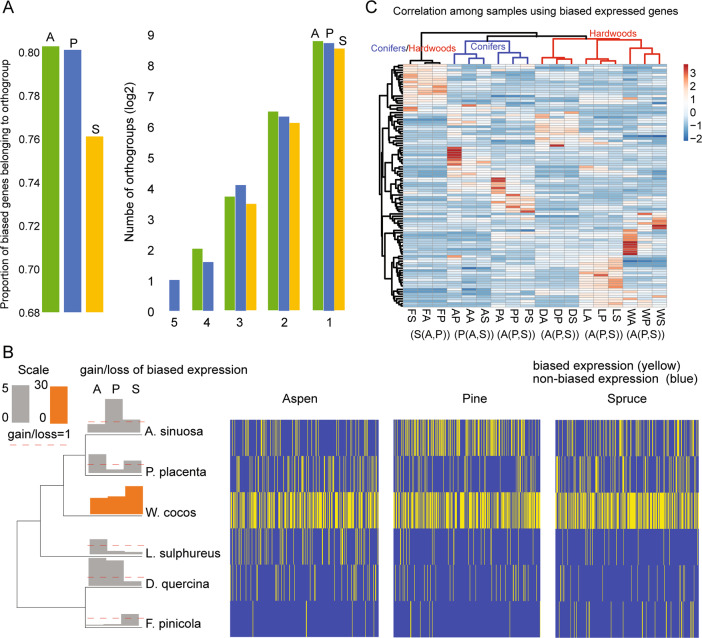
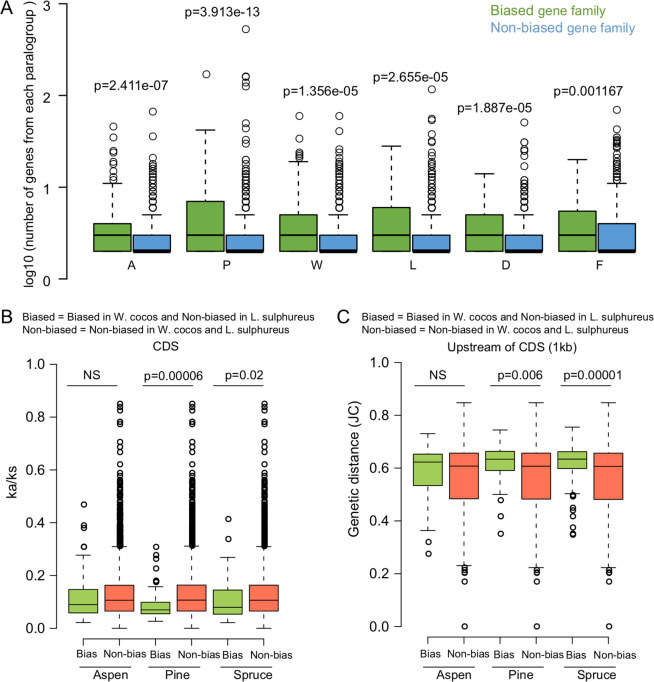
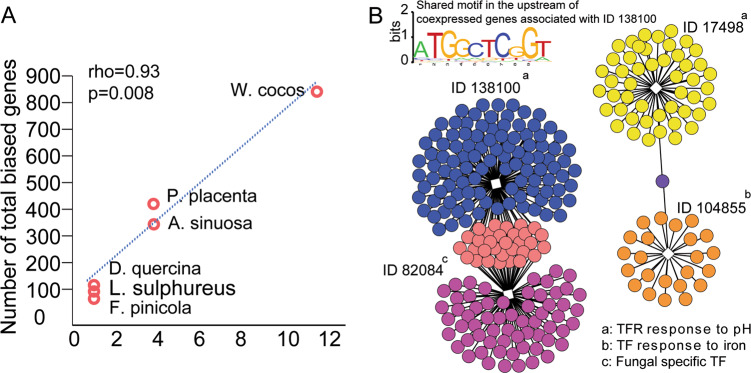
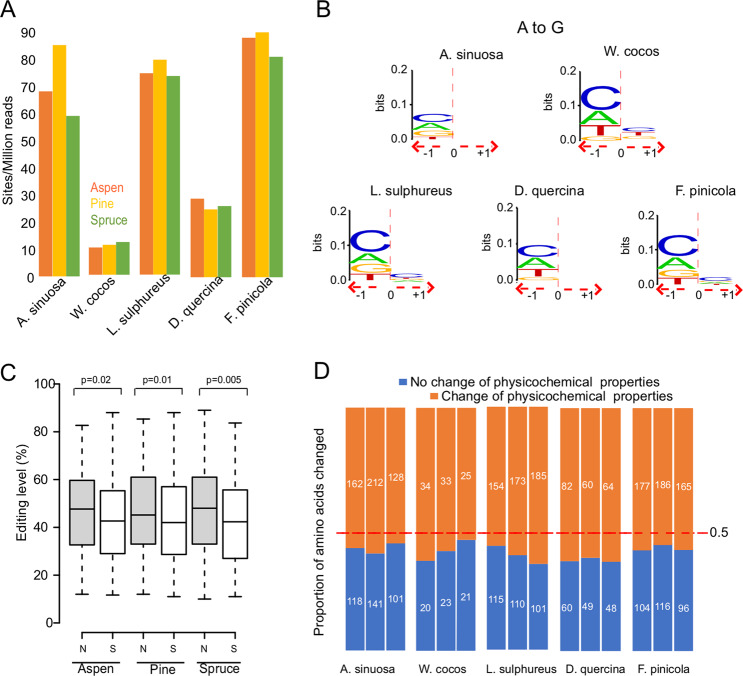
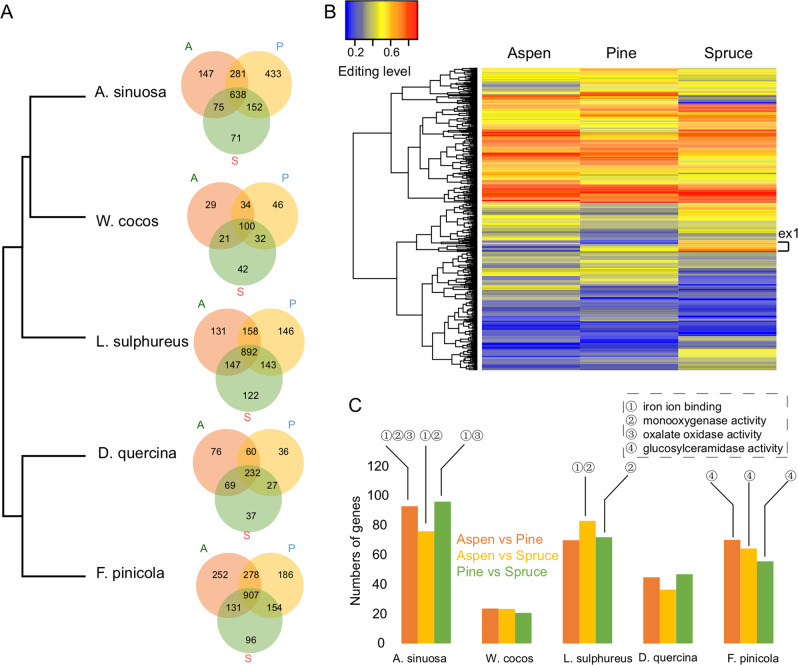
Fungi that decay wood have characteristic associations with certain tree species, but the mechanistic bases for these associations are poorly understood. We studied substrate-specific gene expression and RNA editing in six species of wood-decaying fungi from the 'Antrodia clade' (Polyporales, Agaricomycetes) on three different wood substrates (pine, spruce, and aspen) in submerged cultures. We identified dozens to hundreds of substrate-biased genes (i.e., genes that are significantly upregulated in one substrate relative to the other two substrates) in each species, and these biased genes are correlated with their host ranges. Evolution of substrate-biased genes is associated with gene family expansion, gain and loss of genes, and variation in cis- and trans- regulatory elements, rather than changes in protein coding sequences. We also demonstrated widespread RNA editing events in the Antrodia clade, which differ from those observed in the Ascomycota in their distribution, substitution types, and the genomic environment. Moreover, we found that substrates could affect editing positions and frequency, including editing events occurring in mRNA transcribed from wood-decay-related genes. This work shows the extent to which gene expression and RNA editing differ among species and substrates, and provides clues into mechanisms by which wood-decaying fungi may adapt to different hosts.


Conflict of interest statement

The authors declare that they have no conflict of interest.

Figures

Fig. 1
Fig. 1
Patterns of gene expression in response to three different substrates from the six brown rot fungi species. a Neighbor-joining tree with branch length inferred using expression distance (1- Spearman’s rho) for all pairs of species. b The fold change of all genes in response to one substrate relative to the other one. c Numbers of substrate-biased genes plotted on the branches of a simplified phylogenetic tree (branch lengths are labeled along the branches). d The proportion of uniquely substrate-biased and shared substrate-biased genes from each species. The two categories are illustrated in Figure S1. e Venn diagram showing overlap among GO terms for aspen-biased genes from six species. The eight GO terms shared among all six species are Molecular Function (MF): oxidoreductase activity, catalytic activity, monooxygenase activity, iron ion binding, heme binding; Biological Process (BP): metabolic process, regulation of nitrogen utilization; and Cellular Component (CC): mitochondrial intermembrane space. For a, b, d: A = A. sinuosa, P = P. placenta, W = W. cocos, L = L. sulphureus, D = D. quercina, and F = F. pinicola
Fig. 2
Fig. 2
Turnover of substrate-biased expression among six species. a Distributions of orthologs of substrate-biased genes. The left panel shows the proportion of substrate-biased genes having orthologs in all six fungal species (for example, over 80% of aspen-biased genes have orthologs in all six species). The right panel shows the number of species having biased genes for each orthogroup (horizontal axis; for example, most orthogroups show biased expression in only a single species). The number of orthogroups (vertical axis) was shown as log2 scale. b Distribution and evolution of substrate-biased expression. The heatmap shows the distribution of substrate-biased expression (yellow) vs. absence of biased expression (blue) among orthologs/orthogroups (arranged vertically) among the six species, which are organized according to phylogenetic relationships. Ratios of gains and losses of substrate-biased expression at each tip were modelled by Dollo parsimony implemented in Count. The red dashed lines indicate a 1/1 ratio of gains to losses. Bars: A = aspen. P = pine S = spruce. The scale for W. cocos differs from that of the other species, due to its higher proportion of gains of substrate-biased expression. (c) Heatmap showing hierarchical clustering of 18 samples using expression data (FPKM) of single-copy biased genes. Blue branches group the species that occur primarily on conifers, red branches group hardwood specialists
Fig. 3
Fig. 3
Factors contributing to turnover of biased expression. a The extent of gene expansion was compared between biased group and non-biased group. The y-axis represents the number of genes from each gene family. A = A. sinuosa, P = P. placenta, W = W. cocos, L = L. sulphureus, D = D. quercina, and F = F. pinicola. b Ratio of nonsynonymous substitutions (Ka) to synonymous substitutions (Ks) for ortholog pairs from non-biased and biased group between W. cocos and L. sulphureus. (c) Genetic distance for upstream region (1 kb) of CDSs from the non-biased and biased groups between W. cocos and L. sulphureus
Fig. 4
Fig. 4
Transcription factors orchestrating substrate-biased expression. a Correlation between numbers of total biased genes (y-axis) and TF/TF-related biased genes (x-axis) among six species. b Co-expression of TF-related biased genes with total biased genes in W. cocos. White squares represent four TF-related biased genes (TFR = TF regulator). The sequence logo shows a motif shared by all co-expressed genes associated with ID 138100. The other 24 shared motifs from the same cluster (138100) were listed in Table S1
Fig. 5
Fig. 5
RNA editing in the Antrodia clade. a The number of normalized RNA editing sites among five species spanning the Antrodia clade. b The nucleotides neighboring the detected editing site (A to G) showing relative conserved preference. The RNA editing site is referred to as 0. Upstream to the editing site is referred to −1, while downstream is referred to + 1. c Box plots showing the editing levels of RNA editing sites with different types of functional consequences in F. pinicola. d Physicochemical change of RNA-edited sites. The change between any properties of amino acids (non-polar, polar uncharged, acidic and basic) was regarded as change of physicochemical properties. Absolute numbers of editing sites are indicated on the bars
Fig. 6
Fig. 6
Condition-specific RNA editing events. a Venn diagrams showing the distribution of RNA editing sites on different substrates. A = aspen, P = pine, S = spruce. b Hierarchical clustering of the editing level of shared 892 editing sites from L. sulphureus. c GO enrichment analysis of differentially edited genes between any two substrates. Circled numbers correspond to the four enriched GO categories

References

    1. Gilbertson RL. Wood-rotting fungi of North-America. Mycologia. 1980;72:1–49.
    1. Nilsson T, Daniel G, Kirk TK, Obst JR. Chemistry and microscopy of wood decay by some higher ascomyceyes. Holzforschung. 1989;43:11–8.
    1. Wells K, Bandoni RJ. Heterobasidiomycetes. In: Mc Laughlin DJ, Mc Laughlin EG, Lemke PA, editors. The Mycota. Berlin: Springer Verlag; 2001. p. 85–120.
    1. Shary S., Ralph S. A., Hammel K. E. New Insights into the Ligninolytic Capability of a Wood Decay Ascomycete. Applied and Environmental Microbiology. 2007;73(20):6691–6694. - PMC - PubMed
    1. Thiers HD. The secotioid syndrome. Mycologia. 1984;76:1–8.

Publication types

Substances