. 2019 Mar;22(3):374-385.
doi: 10.1038/s41593-018-0334-7. Epub 2019 Feb 4.

Increased synapse elimination by microglia in schizophrenia patient-derived models of synaptic pruning

Affiliations

Increased synapse elimination by microglia in schizophrenia patient-derived models of synaptic pruning

Carl M Sellgren et al. Nat Neurosci. 2019 Mar.

Abstract

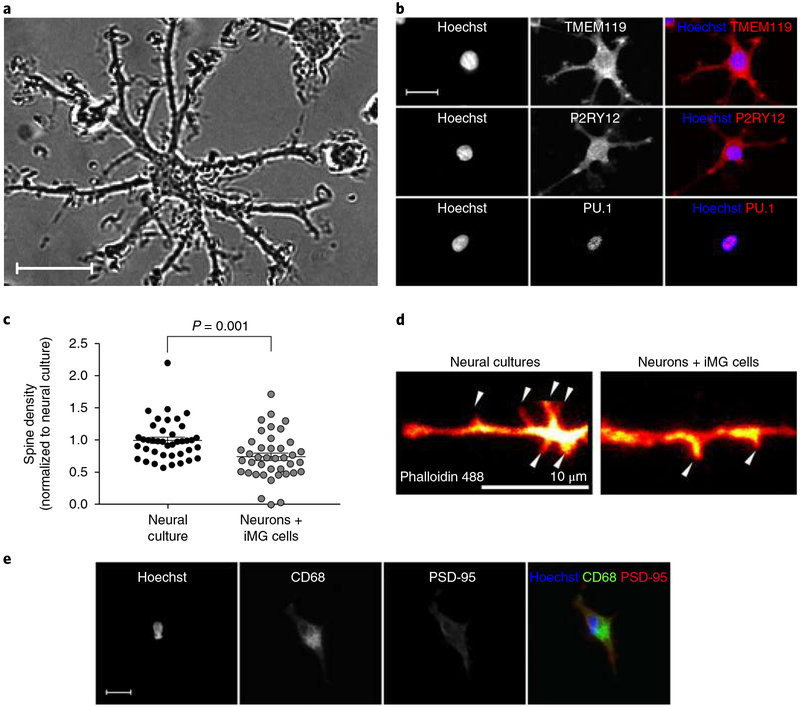
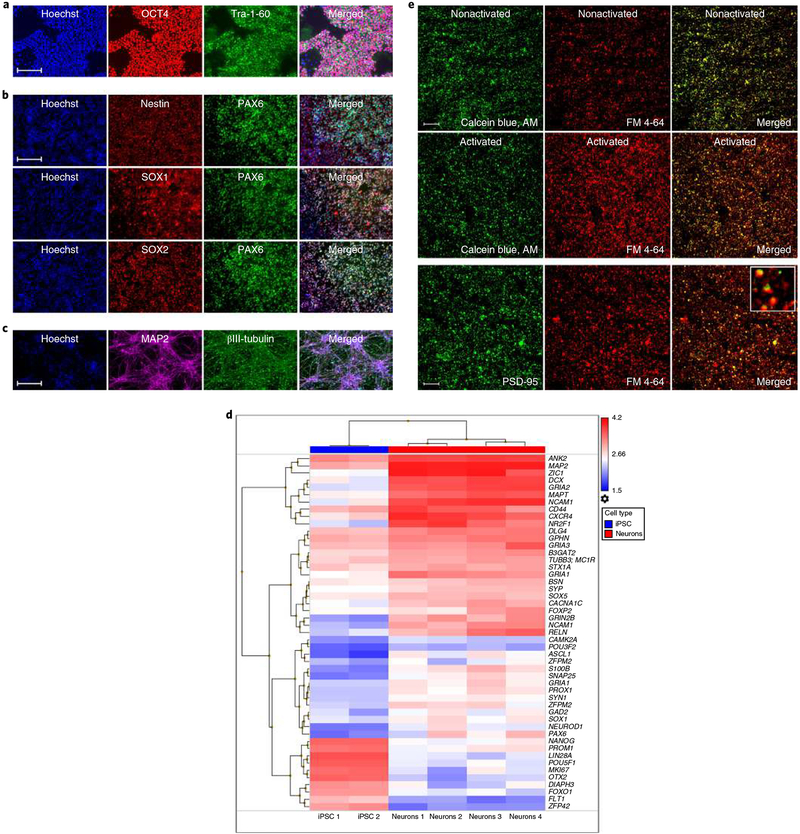
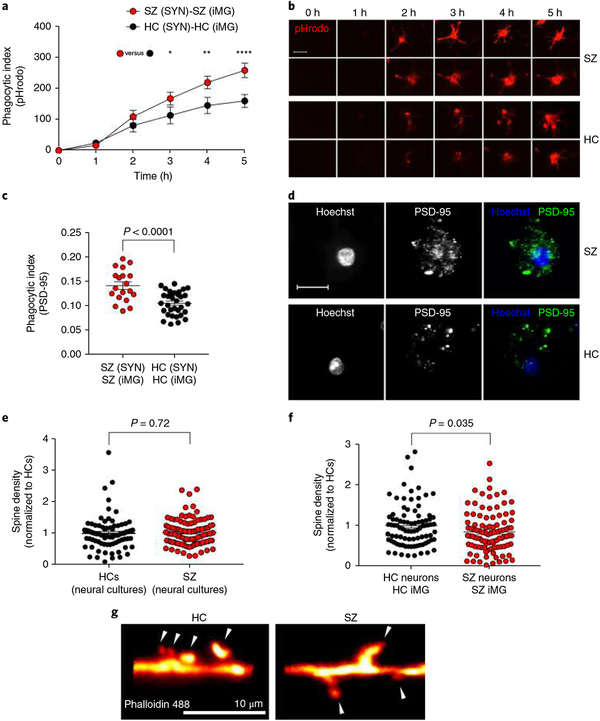
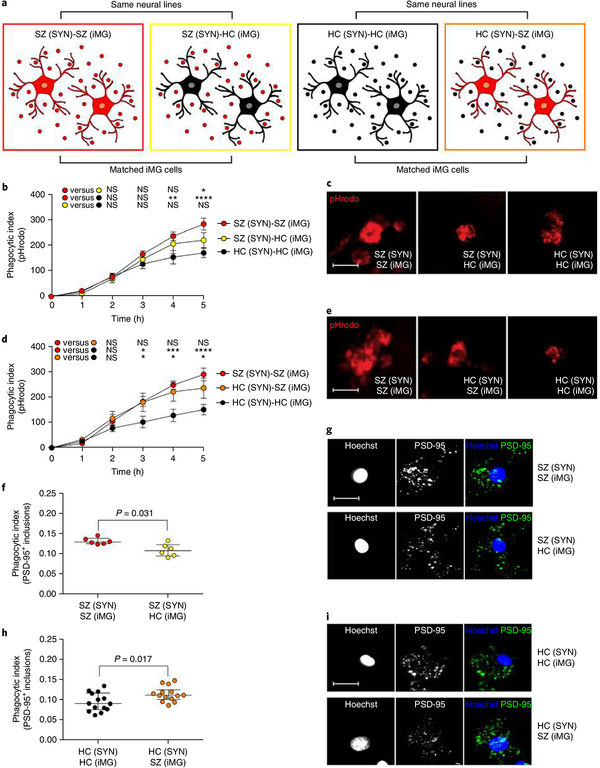
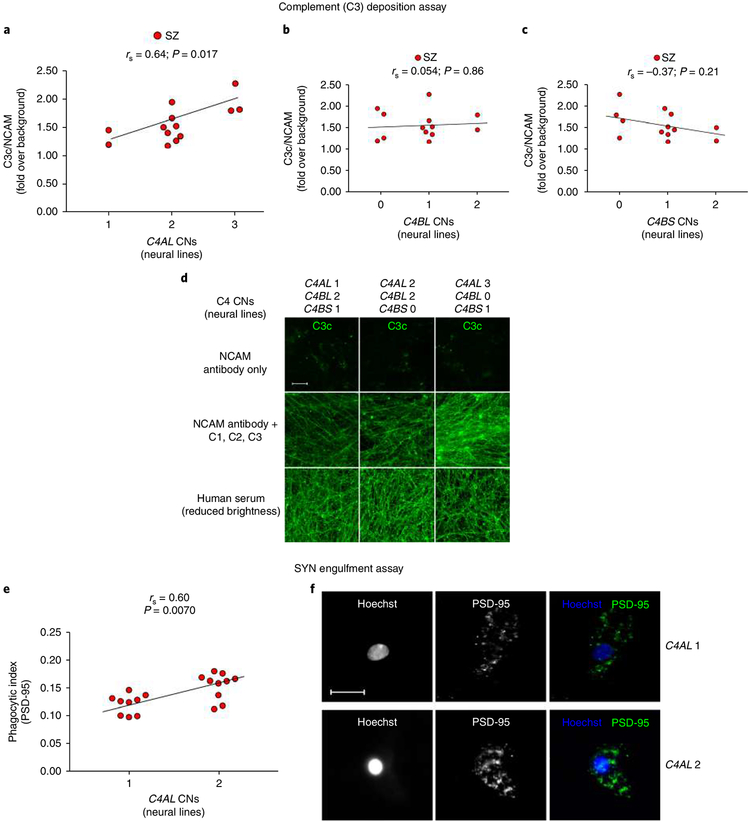
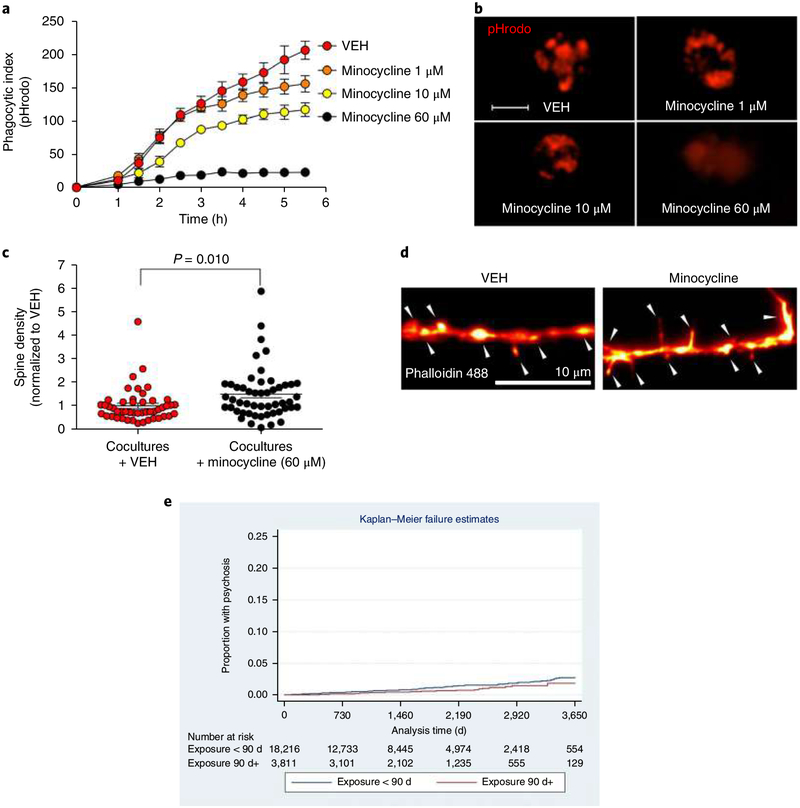
Synapse density is reduced in postmortem cortical tissue from schizophrenia patients, which is suggestive of increased synapse elimination. Using a reprogrammed in vitro model of microglia-mediated synapse engulfment, we demonstrate increased synapse elimination in patient-derived neural cultures and isolated synaptosomes. This excessive synaptic pruning reflects abnormalities in both microglia-like cells and synaptic structures. Further, we find that schizophrenia risk-associated variants within the human complement component 4 locus are associated with increased neuronal complement deposition and synapse uptake; however, they do not fully explain the observed increase in synapse uptake. Finally, we demonstrate that the antibiotic minocycline reduces microglia-mediated synapse uptake in vitro and its use is associated with a modest decrease in incident schizophrenia risk compared to other antibiotics in a cohort of young adults drawn from electronic health records. These findings point to excessive pruning as a potential target for delaying or preventing the onset of schizophrenia in high-risk individuals.


Conflict of interest statement

Competing interests

C.P.G., A.K., K.W., P.B.W., and J.D.B. are employees of Novartis. R.H.P. has served on the scientific advisory boards of Genomind and Psy Therapeutics, and was a consultant to RID Ventures and Takeda (none related to the present work). C.M.S. discloses lecture and consulting fees from Otsuka Pharmaceutical and H. Lundbeck A/S (none related to the present work). None of the other authors declare any competing interests.

Figures

Fig. 1 |
Fig. 1 |. Characterizations of iMG cells.
a, Representative phase-contrast image of iMG cells captured during a live imaging session (repeated in 3 independent experiments with 36 images collected per session and similar results). Scale bar, 20 μm. b, Confocal images of iMG cells stained for TMEM119, P2RY12, and PU.1. Images are representative of 3 independent experiments with 20 images collected per experiment. Scale bar, 20 μm. c, Spine density (spines per 10-μm dendrite) in an iPSC-derived neural line with and without coculture with iMG cells (derived from 2 individuals) for 48 h (n = 40 randomly selected dendrites examined per group). Data are normalized to neural culture only and were analyzed using a t test (equal variance); t(78) = 3.40, P = 0.001 (two-sided). Mean ± s.e.m. is indicated for each group. d, Phalloidin 488-stained dendrite of an iPSC-derived neuron in pure culture and cocultured with iMG cells for 48 h.; arrows indicate dendritic spines. Images are representative of the experiments described in c. Scale bar, 10 μm. e, Colocalization and engulfment of PSD-95 (red) by iMG cells (green, CD68) in coculture. Images are representative of 3 independent experiments with 20 images collected per experiment. Scale bar, 30 μm.
Fig. 2 |
Fig. 2 |. Isolation of active synaptic structures from iPSC-derived neural cultures.
a, iPSCs stained for octamer-binding transcription factor (OCT4; POU domain, class 5, transcription factor 1) or Tra-1–60 as indicated. b, iPSC-derived NPCs stained for nestin, paired box protein Pax-6 (PAX6), transcription factor SOX1, or transcription factor SOX2 as indicated. c, Neurons stained for the neuronal markers tubulin beta-3 chain (βIII-tubulin) and microtubule-associated protein 2 (MAP2). Images in ac are representative of 8 independent experiments with 20 images collected per well in each experiment. Scale bars, 100 μm. d, Heat map of mRNA expression values determined in iPSCs (n = 2 patients) and iPSC-derived neurons (n = 4 patients); for details see Supplementary Table 5. e, Confocal images of SYNs labeled with calcein blue, AM and FM 4–64 (first and second rows). SYNs were activated by the addition of 40 mM KCl as indicated. The last row displays SYNs labeled with FM 4–64 and the synaptic marker PSD-95. Images are representative of experiments performed in 8 independent patients with 40 images collected in cell culture triplicates per experiment. Scale bar, 60 μm.
Fig. 3 |
Fig. 3 |. Increased engulfment of synaptic structures in schizophrenia-derived models.
a, Quantification of pHrodo (red)-labeled SYN uptake in iMG cells during live imaging. The phagocytic index represents the mean pHrodo+ area per iMG cell. SZ-derived models were designed by using iMG cells derived from 13 patients and SYNs derived from 3 patients (combined to form n = 13 SZ (SYN)-SZ (iMG) models), while HC models were derived from 9 HCs and SYN from 3 HCs (both groups matched with correspondent SZ patients); n = 13 HC (SYN)-HC (iMG) models. Nine images (20×) per well were automatically acquired every hour and the means were then extracted and analyzed using a two-way repeated ANOVA. There was a significant interaction between the effects of time and group on phagocytic index (F(5,60) = 4.84; P = 0.0009). Šidák’s multiple comparison tests gave an adjusted P value of 0.035 at 3 h, 0.002 at 4 h, and < 0.0001 at 5 h. All other comparisons were non-significant. b, The first two rows display representative images from the SZ models in a; the last two rows represent images from the HC models in a. Scale bar, 25 μm. c, Quantification of phagocytic inclusions (PSD-95+ inclusions, 0.5–1.5 μm) using confocal microscopy in a sample containing SYNs derived from a total of 4 SZ patients and 4 matched HCs, combined in different combinations with iMG cells from 13 SZ patients and 18 matched HCs (n = 19 SZ (SYN)-SZ (iMG) models and n = 33 HC (SYN)-HC(iMG) models). The phagocytic index represents the number of PSD-95+ particles (0.5–1.5 μm) per iMG cytoplasm area. Twenty randomly selected confocal images were taken per well and the means were analyzed using a t test (equal variance); t(50) = 4.55, P < 0.0001 (two-sided). d, Representative confocal images for the two groups in c. Scale bar, 30 μm. e, Quantification of spine density (spines per 10-μm dendrite) in neural lines derived from 3 SZ patients versus 2 HCs (n = 80 randomly selected dendrites examined in the SZ group and n = 100 randomly selected dendrites examined in the HC group); Welch-corrected t test; t(148) = 0.35, P = 0.72 (two-sided). f, Quantification of spine density in the same neural lines but cocultured with iMG cells (derived from 3 SZ patients or 2 HCs; n = 88 randomly selected dendrites examined in HC group and n = 99 randomly selected dendrites examined in the SZ group) as indicated; t test (equal variance); t(185) = 2.1, P = 0.035 (two-sided). Data in both graphs are normalized to the HC group. g, Representative images of phalloidin 488-stained high-magnification confocal images of dendritic spines (indicated by the arrowheads) in HC and SZ neural cultures described in f. The mean number of spines per 10-μm dendrite was 4.5 (s.e.m. = 0.25) for HC cultures and 3.8 (s.e.m. = 0.23) in SZ cultures. All reported P values are two-sided; the mean ± s.e.m. is indicated for each group in all graphs. *P < 0.05, **P < 0.01, ****P < 0.0001.
Fig. 4 |
Fig. 4 |. Microglial factors influence synapse engulfment.
a, ‘Pure’ disease models, derived from patients with SZ, were compared to ‘mixed’ models in which the same synaptic structures from SZ patients were added to iMG cells derived from matched HCs, as well as ‘pure’ HC models compared to ‘mixed’ models in which the same synaptic structures from HC patients were added to iMG cells derived from matched SZ patients. For both experimental designs, as a reference, we included matched ‘pure’ HC and SZ models, respectively. b, Quantification of pHrodo (red)-labeled SY) uptake in iMG cells during live imaging sessions of 5 h. SZ-SZ models were based on SYN from 2 SZ patients and iMG cells from 8 SZ patients (n = 8 models), while SZ-HC models were based on the same SYN from SZ patients and 8 models based on iMG cells derived from 7 matched HCs (n = 8 matched models). HC-HC models were based on iMG cells from 8 HCs and SYN from 3 HCs (n = 8 matched models). Nine images (20×) per well were automatically acquired every hour and the means were then extracted and analyzed using a two-way repeated ANOVA. There was a significant interaction between the effects of time and group on the phagocytic index (F(10,105) = 3.07; P = 0.0018). Šidák’s multiple comparison tests (across the three groups at every time point) gave an adjusted significant P value of 0.005 at 4 h for the SZ-SZ group versus the HC-HC group, and at 5 h for comparison of the SZ-SZ group versus the HC-HC group (P < 0.0001), as well as the comparison of the SZ-SZ group and the SZ-HC group (P = 0.042). All other comparisons were non-significant. c, Representative live images (5 h) from SZ-SZ, SZ-HC, and HC-HC models in the experiments described in b. d, Identical live imaging design as in b but in this experiment comparing HC-HC models (based on SYNs from 3 HCs and iMG cells from 5 HC patients; n = 7 models), with HC-SZ models based on the same SYN from HCs but iMG cells derived from 3 matched SZ patients (n = 7 matched models). SZ-SZ models were based on iMG cells from 7 SZ patients and SYNs from 3 SZ patients (n = 7 matched models). Data were analyzed using a two-way repeated ANOVA. There was a significant interaction between the effects of time and group on the phagocytic index (F(10,90) = 3.89; P = 0.0002). Šidák’s multiple comparison tests (across the three groups at every time point) revealed a significant different in phagocytic indexes at 3 h between the SZ-SZ group and the HC-HC group (adjusted P value = 0.031) as well as between the HC-HC group and the HC-SZ group (adjusted P value = 0.041). The mean difference was also stable for these comparisons at 4 h (SZ-SZ versus HC-HC: P = 0.0008; HC-HC group versus HC-SZ: P = 0.011) and at 5 h (SZ-SZ versus HC-HC: P < 0.0001; HC-HC group versus HC-SZ: P = 0.023). All other group comparisons were non-significant. e, Representative live images from the different combinations in d. Scale bar, 25 μ m. f, Quantification of phagocytic inclusions (PSD-95+ inclusions, 0.5–1.5 μ m) using confocal microscopy and SYNs derived from 2 neural SZ lines matched with iMG cells from 6 SZ patients or 6 matched HCs (n = 6 models per group) with representative confocal images in g; scale bar, 30 μ m. Wilcoxon signed-rank test: P = 0.031. h, Quantification of PSD-95+ inclusions using confocal microscopy and SYNs derived from 3 neural HC lines matched with iMG cells from 6 HCs or 6 matched SZ patients (n = 14 models per group), with representative confocal images in i; Scale bar, 30 μ m. Wilcoxon signed-rank test: P = 0.017. *P < 0.05, **P < 0.01, ***P < 0.001, ****P < 0.0001. All reported P values are two-sided. Mean ± s.e.m. is indicated in b and d; the median with the interquartile range is shown in f and h.
Fig. 5 |
Fig. 5 |. C4 SZ risk variants increase complement deposition on neurons and increase synapse engulfment in in vitro models derived from SZ patients.
a, Significant correlation between neural C4AL CNs and neuronal C3 complement deposition; no effect of C4BL (b) or C4BS (c) CN on C3 deposition was observed. n = 13 SZ patients (means from 36 fields per well and 8 wells per line for each experimental condition. d, Representative confocal images froma,b of C3 deposition after IgM anti-NCAM antibody alone (negative control, top row), with the addition of C1, C2, and C3 (second row) across lines with increasing C4AL CNs and decreasing C4B CNs, and with the addition of C5-depleted serum (positive control, bottom row). Scale bar, 100 μ m. e, Similar correlation as in a but between C4AL CNs (SZ patients also described in Fig. 3c; n = 19 patients) and SYN uptake as measured by PSD-95+ phagocytic inclusions. f, Representative confocal images for the two groups. Scale bar, 30 μ m. All reported P values are two-sided; correlation coefficients are Spearman’s.
Fig. 6 |
Fig. 6 |. Minocycline inhibits synapse engulfment in vitro and decreases SZ risk in EHRs.
a, Quantification of pHrodo (red)-labeled SYN uptake in iMG cells during live imaging sessions of 5.5 h. iMG cultures (n = 8 models with iMG derived from 8 patients and SYNs from 2 patients) were pretreated for 30 min with VEH or minocycline at a concentration of 1 μ M, 10 μ M, or 60 μ M. Nine images (20×) per well were automatically acquired every hour; the means were then extracted and analyzed using a two-way repeated ANOVA. There was a significant interaction between the effects of time and group on the phagocytic index (F(30, 270) = 17.0; P < 0.0001). Šidák’s multiple comparison tests gave significant adjusted P values for all comparisons at the last time point (5.5 h); P values ranged from < 0.0001 to 0.008. b, Representative images from a displaying pHrodo+ uptake at 5.5 h in different conditions. Scale bar, 25 μ m. c, Quantification of spine density (spines per 10-μm dendrite) in a neural line derived from an HC and treated with 60 μm minocycline as indicated (n = 80 randomly selected dendrites examined in the SZ group and n = 100 randomly selected dendrites examined in the HC group). Welch-corrected t test: t(148) = 0.35, P = 0.72 (two-sided). Quantification of spine density in co-cultures (neurons and iMG cells) derived from an HC line and treated with 60 μm minocycline or VEH as indicated (n = 48 randomly selected dendrites examines in the VEH group and n = 51 in the minocycline group). Welch-corrected t test): t(87.2) = 2.66, P = 0.010. Data are normalized to the VEH group in the graph; the mean number of spines per 10 μm was 3.2 (s.e.m. = 0.34) among untreated cultures and 4.7 (s.e.m. = 0.48) in minocycline-treated cultures. d, Representative images of phalloidin-stained high-magnification confocal images of dendritic spines (indicated by the arrowheads) in VEH- and minocycline-treated cocultures in the experiments described in c. e, Time to diagnosis in individuals exposed to monocycline or doxycycline for at least 90 d or exposed for fewer than 90 d (log-rank χ2(1 d.f.) = 5.66; P = 0.017). Cumulative hazard at 10 years was 0.0185 (95% CI 0.0110–0.0312) in the exposed group, and 0.0279 (95% CI 0.0225–0.0346) in the unexposed group. Likewise, in a Cox (proportional hazards) regression model, monocycline or doxycycline exposure for at least 90 d was associated with decreased risk of incident psychosis (HR 0.58, 95% CI 0.39–0.88). Results were unchanged after excluding 672 individuals exposed to isotretinoin. The error bars in panels a and c represent s.e.m. All P values are two-sided; mean ±s.e.m. values are indicated in a and c.

Comment in

References

    1. Ripke S et al. Biological insights from 108 schizophrenia-associated genetic loci. Nature 511, 421–427 (2014). - PMC - PubMed
    1. Cannon TD et al. Progressive reduction in cortical thickness as psychosis develops: a multisite longitudinal neuroimaging study of youth at elevated clinical risk. Biol. Psychiatry 77, 147–157 (2015). - PMC - PubMed
    1. Pantelis C et al. Neuroanatomical abnormalities before and after onset of psychosis: a cross-sectional and longitudinal MRI comparison. Lancet 361, 281–288 (2003). - PubMed
    1. Ziermans TB et al. Progressive structural brain changes during development of psychosis. Schizophr. Bull 38, 519–530 (2012). - PMC - PubMed
    1. Sun D et al. Progressive brain structural changes mapped as psychosis develops in ‘at risk’ individuals. Schizophr. Res 108, 85–92 (2009). - PMC - PubMed

Publication types