. 2019 Feb 4;9(1):1255.
doi: 10.1038/s41598-018-38180-4.

Hydrogen gas distribution in organs after inhalation: Real-time monitoring of tissue hydrogen concentration in rat

Affiliations

Hydrogen gas distribution in organs after inhalation: Real-time monitoring of tissue hydrogen concentration in rat

Ryo Yamamoto et al. Sci Rep. .

Abstract

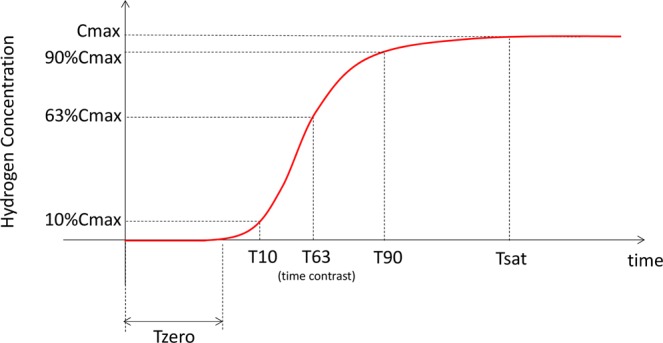
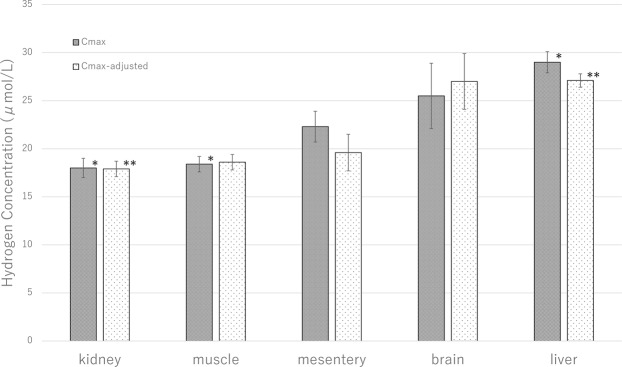
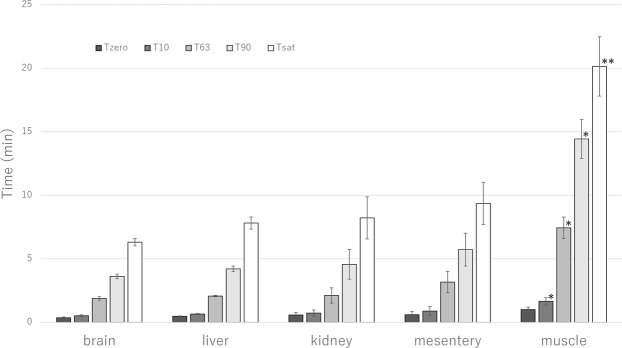
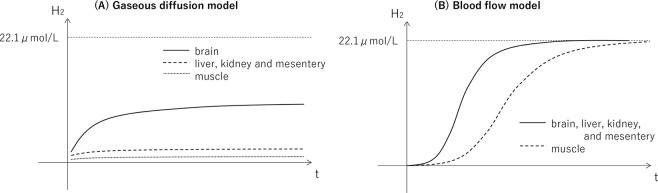
Hydrogen has therapeutic and preventive effects against various diseases. Although animal and clinical studies have reported promising results, hydrogen distribution in organs after administration remains unclear. Herein, the sequential changes in hydrogen concentration in tissues over time were monitored using a highly sensitive glass microsensor and continuous inhalation of 3% hydrogen gas. The hydrogen concentration was measured in the brain, liver, kidney, mesentery fat and thigh muscle of rats. The maximum concentration, time to saturation, and other measurements representing the dynamics of distribution were obtained from the concentration curves, and the results obtained for different organs were compared. The time to saturation was significantly longer (20.2 vs 6.3-9.4 min. P = 0.004 in all cases) and increased more gradually in muscle than in the other organs. The maximum concentration was the highest in liver and the lowest in the kidney (29.0 ± 2.6 vs 18.0 ± 2.2 μmol/L; P = 0.03 in all cases). The concentration varied significantly depending on the organ (P = 0.03). These results provide the fundamentals for elucidating the mechanisms underlying the in vivo favourable effects of hydrogen gas in mammalian systems.


Conflict of interest statement

The authors declare no competing interests.

Figures

Figure 1
Figure 1
Definition of hydrogen concentration curve measurements. Important concentration curve measurements were as follows. Cmax - the maximum plateau concentration where the concentration changes were less than 1% of the difference between baseline and maximum concentrations (i.e., saturation) over 1 min. Cmax-adjusted - Cmax values adjusted by microsensor signals obtained before staring the inhalation and used as an in vivo calibration. Tsat - the time between initiation of inhalation and beginning of saturation. T10, T63, and T90 - the time taken to reach 10, 63, and 90% of Cmax-adjusted, respectively. Tzero - the time required for the hydrogen concentration to reach 3% of Cmax-adjusted.
Figure 2
Figure 2
Maximum hydrogen concentration (Cmax). The liver had the highest mean Cmax while the kidney had the lowest. Although the Cmax varied significantly depending on the organ (P = 0.02 by analysis of variance), the inter-organ comparisons only revealed significant differences between the liver and kidney (*P < 0.05 by unpaired t-test) and liver and muscle (*P < 0.05 by unpaired t-test). Cmax-adjusted was also the highest in the liver and the lowest in the kidney. Cmax-adjusted was significantly different between the liver and kidney (**P = 0.04 by unpaired t-test).
Figure 3
Figure 3
Hydrogen distribution curve until saturation. The hydrogen concentration increased more gradually in thigh muscle compared to the other organs. The liver had the highest Cmax while the kidney had the lowest. Liver, n = 6, brain, n = 8, mesentery fat, n = 4, kidney, n = 5, thigh muscle, n = 5.
Figure 4
Figure 4
Hydrogen saturation dynamics. Time to saturation (Tsat) and the time taken to reach 10% (T10), 63% (T63), and 90% (T90) of adjusted Cmax-adjusted were all significantly longer in the thigh muscle than in the other organs (Tsat, **P = 0.004 by Kruskal–Wallis test, T10, T63, and T90, *P < 0.05 by Kruskal–Wallis test). The T10, T63, T90 and Tsat were not significantly different between brain, liver, kidney and mesentery fat. The duration of the initial plateau (Tzero) was comparable for all organs.
Figure 5
Figure 5
Theoretical models of hydrogen distribution. (A) In gaseous diffusion model, hydrogen concentration would increase more rapidly and would saturate at higher value in the brain than the muscle and other organs based on the distance between the gas supply hood (the face and head) and each organ, although maximum concentration would be lower than the administered level (22.1 μmol/L) due to high diffusion coefficient of hydrogen gas. (B) In blood flow model, hydrogen concentration would increase more gradually in the muscle than other organs due to lower blood flow of muscle, while maximum concentrations would be similar across organs because arterial blood would be saturated at the administered level.

References

    1. Ohsawa. I, et al. Hydrogen acts as a therapeutic antioxidant by selectively reducing cytotoxic oxygen radicals. Nat Med. 2007;13:688–694. doi: 10.1038/nm1577. - DOI - PubMed
    1. Nakao A, Toyoda Y, Sharma P, Evans M, Guthrie N. Effectiveness of hydrogen rich water on antioxidant status of subjects with potential metabolic syndrome-an open label pilot study. J Clin Biochem Nutr. 2010;46:140–149. doi: 10.3164/jcbn.09-100. - DOI - PMC - PubMed
    1. Xie K, et al. Protective effects of hydrogen gas on murine polymicrobial sepsis via reducing oxidative stress and HMGB1 release. Shock. 2010;34:90–97. doi: 10.1097/SHK.0b013e3181cdc4ae. - DOI - PubMed
    1. Katsumata Y, et al. The effects of hydrogen gas inhalation on adverse left ventricular remodeling after percutaneous coronary intervention for ST-elevated myocardial infarction - first pilot study in humans. Circ J. 2017;81:940–947. doi: 10.1253/circj.CJ-17-0105. - DOI - PubMed
    1. Hayashida K, et al. Hydrogen inhalation during normoxic resuscitation improves neurological outcome in a rat model of cardiac arrest independently of targeted temperature management. Circulation. 2014;130:2173–2180. doi: 10.1161/CIRCULATIONAHA.114.011848. - DOI - PubMed

Publication types