. 2019 Mar;20(3):350-361.
doi: 10.1038/s41590-018-0295-8. Epub 2019 Feb 4.

An essential role for the Zn2+ transporter ZIP7 in B cell development

Affiliations

An essential role for the Zn2+ transporter ZIP7 in B cell development

Consuelo Anzilotti et al. Nat Immunol. 2019 Mar.

Abstract

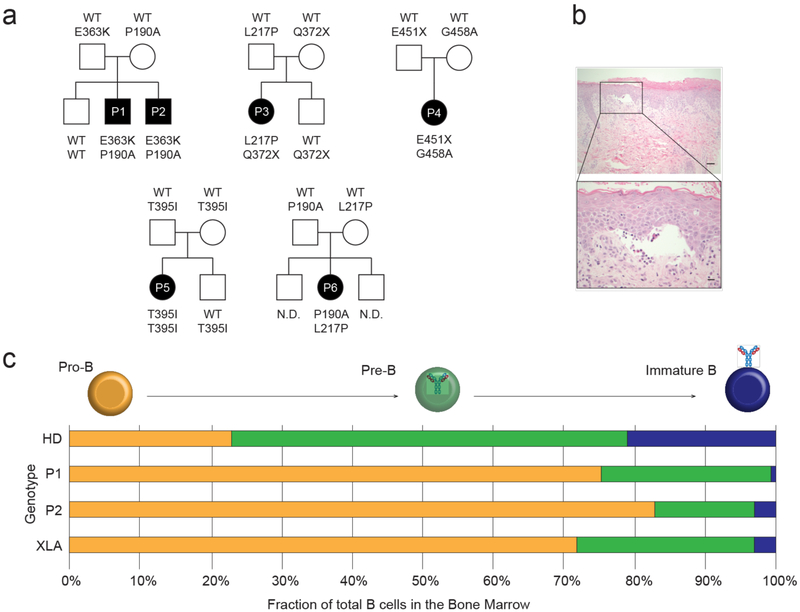
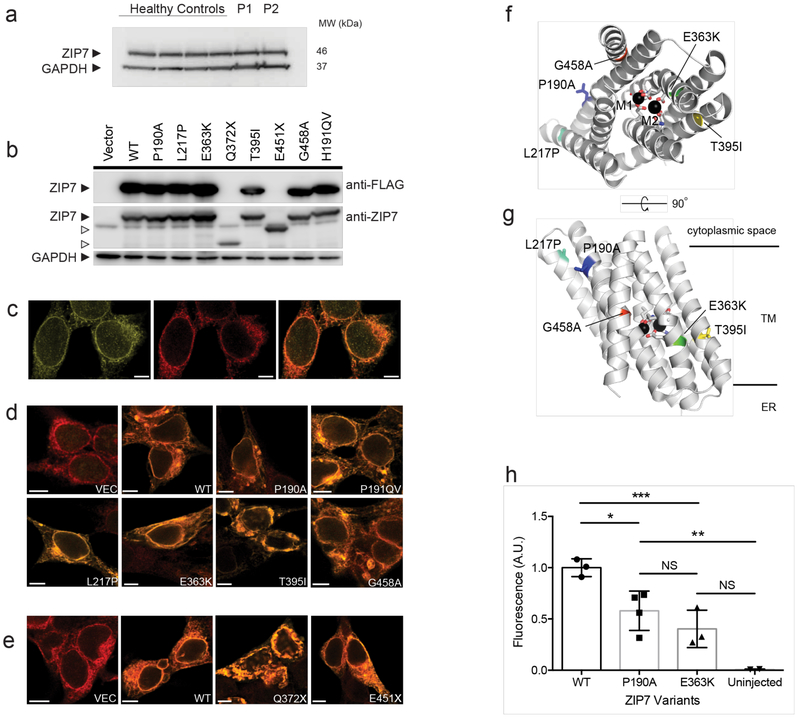
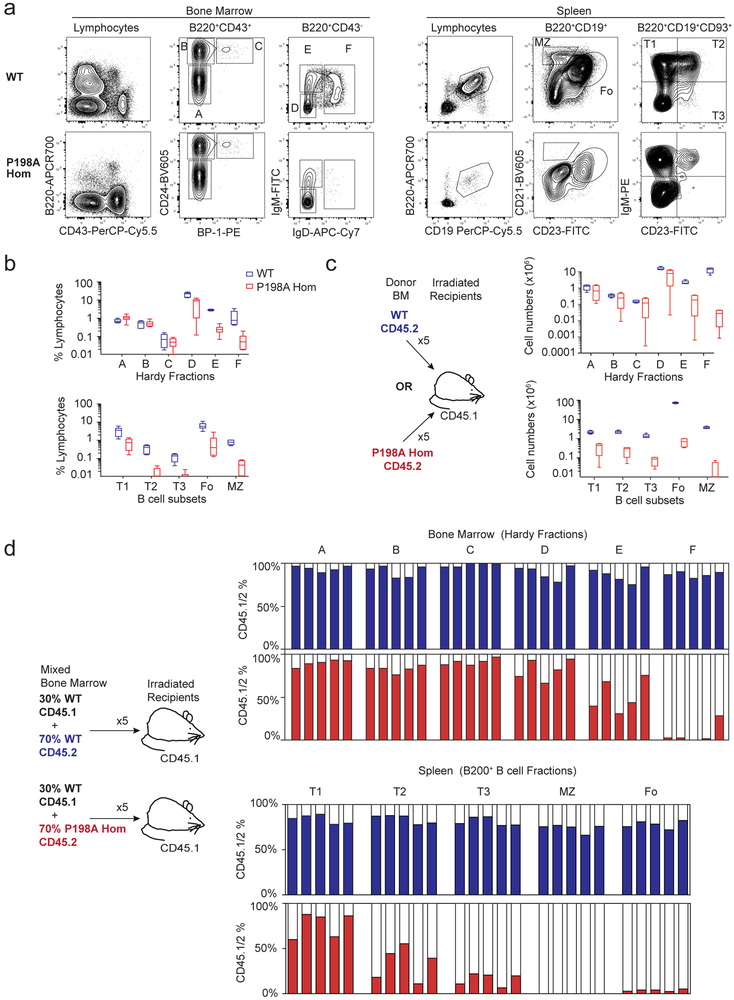
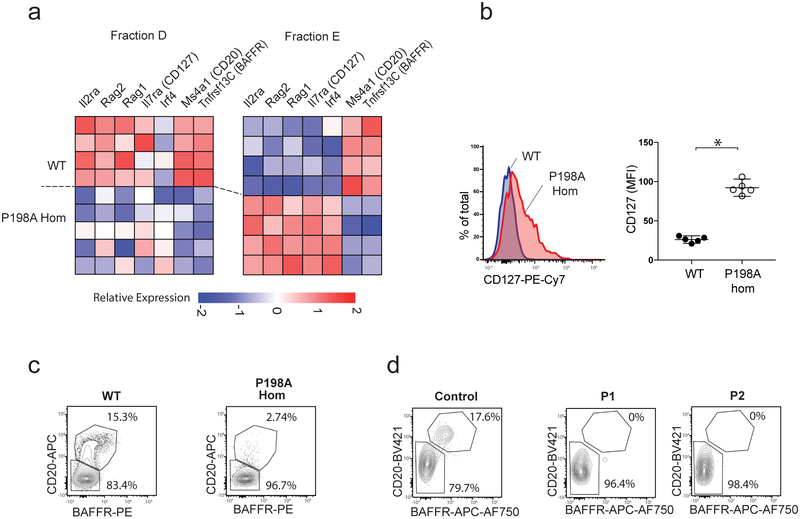
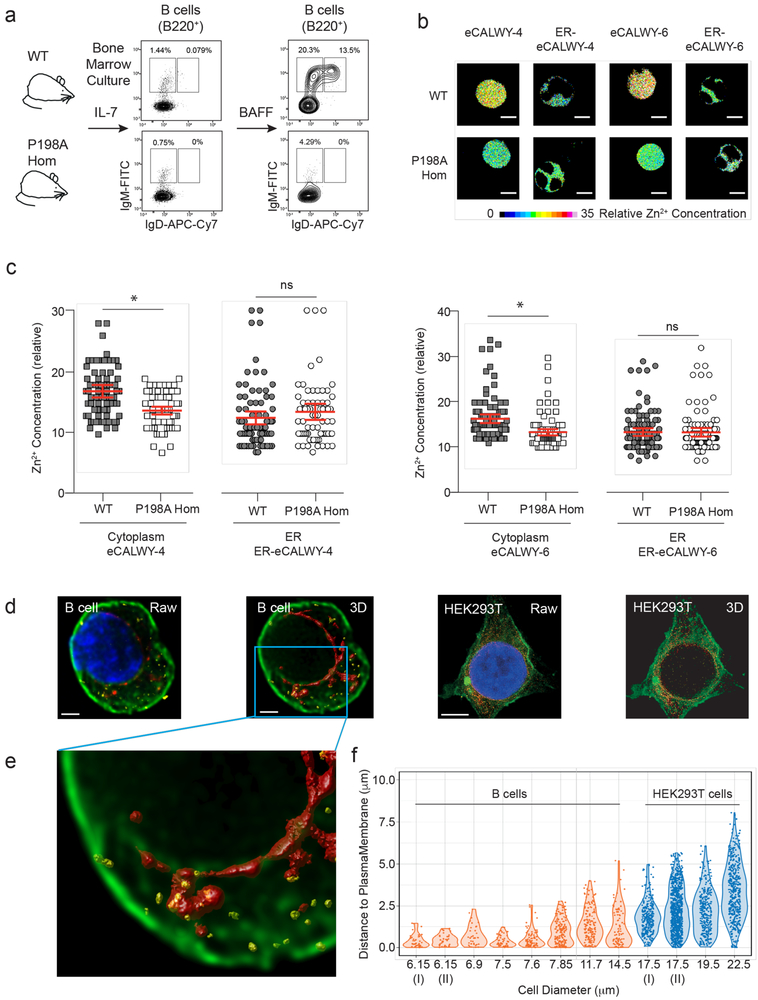
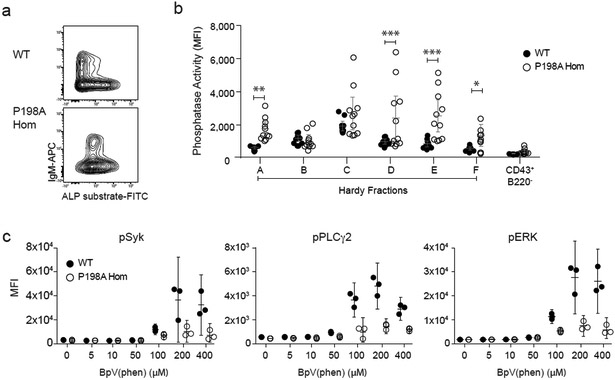
Despite the known importance of zinc for human immunity, molecular insights into its roles have remained limited. Here we report a novel autosomal recessive disease characterized by absent B cells, agammaglobulinemia and early onset infections in five unrelated families. The immunodeficiency results from hypomorphic mutations of SLC39A7, which encodes the endoplasmic reticulum-to-cytoplasm zinc transporter ZIP7. Using CRISPR-Cas9 mutagenesis we have precisely modeled ZIP7 deficiency in mice. Homozygosity for a null allele caused embryonic death, but hypomorphic alleles reproduced the block in B cell development seen in patients. B cells from mutant mice exhibited a diminished concentration of cytoplasmic free zinc, increased phosphatase activity and decreased phosphorylation of signaling molecules downstream of the pre-B cell and B cell receptors. Our findings highlight a specific role for cytosolic Zn2+ in modulating B cell receptor signal strength and positive selection.


Figures

Figure 1.
Figure 1.. A novel autosomal recessive agammaglobulinemia caused by mutations in ZIP7.
(a) Pedigrees of five unrelated kindreds in which subjects with agammaglobulinemia and absent B cells (P1-P6) carry the indicated SLC39A7 (ZIP7) alleles. (b) Representative low (scale bar 40 μm) and high-power (scale bar 10 μm) images of skin biopsy from patient P1 stained with hematoxylin and eosin, highlighting blister formation at the dermo-epidermal junction (n=2). (c) Schematic representation of the B cell precursor compartments within the BM of 9 age-matched healthy donors (HD), patients P1 and P2 (mutated ZIP7), and 12 disease controls with X-linked agammaglobulinemia (XLA), assessed by flow cytometry. Pro-B cells are defined as CD22+CyCD79a+CyIgM; pre-B cells are CD22+CyCD79a+CD10 CyIgM+sIgM and immature B cells are CD22+CD19+CyCD79a+sIgM+sIgD.
Figure 2.
Figure 2.. Multiple loss-of-function mutations in ZIP7.
(a) immunoblot (IB) of crude lysates from dermal fibroblasts of four healthy controls and two patients, P1 and P2, probed for ZIP7 protein and GAPDH. (b) IB of crude lysates from HEK-293T cells transfected individually with FLAG-tagged WT (WT) or mutant SLC39A7 alleles, probed for ZIP7 or DDK epitopes, or GAPDH. H191ins corresponds to H199QV in mouse. Images in a and b are representative of 3 and 4 independent experiments, respectively. (c) Immunofluorescence images of HEK293T cells showing endogenous ZIP7 (left, green), ER marker calnexin (middle, red) and both ZIP7 and calnexin together (right, colocalization shows as orange signal). (d) The distribution of recombinant FLAG-tagged WT (WT) or indicated missense ZIP7 proteins in HEK293T cells, transfected individually and probed with primary antibodies against FLAG (green) and calnexin (red; orange signal thus indicates colocalization in the ER). Scale bar, 10μm. (e) As in d, but recombinant truncation mutants were not FLAG-tagged so were probed with primary anti-ZIP7 antibody. Images (c-e) are representative of 3 independent experiments and Pearson coefficients were uniformly >0.6. (f and g) The location of missense mutations within the predicted protein structure of ZIP7, modelled on the structure of Bordetella pertussis ZIP using PyMOL; (f) en face and (g) side view of ZIP7. M1 and M2 represent Zn2+ ions bound within the channel, TM indicates transmembrane region. (h) Hypomorphic human SLC39A7 alleles were expressed in Xenopus oocytes and ZIP7-mediated Zn2+ flux revealed following exposure of Zinquin-loaded oocytes to extracellular zinc (see Methods). Normalized mean fluorescence signal intensity is shown with SD for one experiment, (WT, n=3 oocytes; P190A, n=4; E363K, n=3, uninjected, n=2), representative of 4 independent experiments. Statistical comparison was by one-way ANOVA with Tukey’s post-hoc test (DF=8); *p=0.0309; **p=0.0120; ***p=0.0066; NS, non-significant.
Figure 3.
Figure 3.. Generation of an allelic series of ZIP7 mutant mice.
(a) Site-directed mutagenesis of SLC39A7 (ZIP7) in mouse zygotes using CRISPR/Cas9 to insert the P198A mutation and coincidentally generate an allelic series by homologous recombination (HR) and non-homologous end joining (NHEJ), here showing the WT, Zip7P198A (P198A), Zip7H199QV (H199QV) and Zip (null) alleles. (b) Total B220+ cell population as percentage of lymphocytes in the BM of 25-day-old mice, where circles represent individual mice (n=27 WT, 6 H199QV Hom; 13 P198A/H199QV and 18 P198A Hom); data are pooled from 6 independent experiments; bars are mean and 95% confidence intervals (CI) and comparison is by one-way ANOVA (F=51.71; DF=63) *= p<0.0001. (c-d) The appearance (c) and weight (d) of 3-4-week-old mice of different genotypes, where circles in (d) represent individual mice (n=74 WT, 14 H199QV Hom; 30 P198A/H199QV and 31 P198A Hom); weights were collected over time; bars are mean and 95% CI, and comparison is by one-way ANOVA (F=50.23; DF=148)*=p<0.0001. (e) Phenotypes associated with combinations of ZIP7 alleles.
Figure 4.
Figure 4.. ZIP7 deficiency leads to a B cell-intrinsic failure in development.
(a) Representative flow cytometry of B cell development in BM and spleen of WT and P198A-Hom mice, gating on Hardy Fractions (Fr) A-F in the BM and total B220+CD19+ B cells in the spleen. (b) B cell subsets as a percentage of lymphocytes in the BM (two femurs and two tibias, upper panel) and in the spleen (lower panel), gating on CD19+B220+CD93+IgM+CD23 T1, CD19+B220+CD93+gM+CD23+ T2 and CD19+B220+CD93+IgMdimCD23+ T3 transitional B cells, B220+CD19+CD23+CD21dim follicular B cells) and B220+CD19+CD23+CD21hi marginal zone (MZ) B cells. n= 6 mice per genotype, bars show means and 95% CI, representative of 5 independent experiments. (c) Absolute numbers of B cell subsets in the BM (upper panel) and spleen (lower panel) from lethally irradiated CD45.1 mice reconstituted for 8 weeks with CD45.2 WT or P198A-Hom BM (gated as in a). n= 5 mice per genotype, bars show means and 95% CI, are representative of 3 independent experiments. (d) The relative proportion of B cell subsets in BM (above) and spleens (below) of lethally irradiated mice reconstituted for 8 weeks with 70:30 mixtures of WT or P198A-Hom CD45.2+ and WT CD45.1+ BM (gated as in a). Each bar represents one mouse; filled columns show percentage CD45.2+ cells; data are representative of 3 experiments.
Figure 5.
Figure 5.. ZIP7 deficiency leads to developmental arrest at the late pre-B to immature B cell transition.
(a) Heatmap showing relative abundance of selected differentially expressed transcripts in sorted B cells from Fr D and E in WT and P198A-Hom mice, where rows represent individual mice. (b) Median CD127 expression on WT and P198A-Hom B cells from FrE, with representative histogram (left); graph (right) shows median expression in individual mice (n=5 per genotype), bars are means and 95% CI; comparison by unpaired t test, *=p<0.0001 (representative of 3 independent experiments). (c-d) BAFFR and CD20 staining in murine B cells from FrD (c) and human pre-B cells (d) comparing P198A-Hom and WT mice (representative of 3 independent experiments, with n=5 mice per genotype), affected humans (P1 and P2) and a control.
Figure 6.
Figure 6.. Reduced cytoplasmic zinc in the presence of ZIP7 mutation.
(a) WT and P198A-Hom IL-7 dependent B cell lines, showing representative flow cytometry before and after stimulation with BAFF. (b) FLIM fluorescent decays images of Zn2+ in IL-7-dependent WT and P198A-Hom B cells transduced with the cytoplasmic eCALWY-4 and eCALWY-6 and ER ER-eCALWY-4 and ER-eCALWY-6 Zn2+ reporters. Samples are representative of cells with the mean Zn2+ concentrations in (c), and scale bar 5 μm. Relative Zn2+ concentration proportional to a color scale showing theoretical reporter occupancy. (c) Relative Zn2+ concentration in cytoplasm and ER of IL-7 dependent WT and P198A-Hom cells expressing eCALWY-4 and eCALWY-6 reporters. Dots represent the FLIM fluorescent decay in individual B cells, with data pooled from three independent experiments (*=p<0.0001); bars are means with 95% CI and comparison by t Test. (d-e) Super-resolution micrographs of activated primary human B cells or HEK293T cells, stained for endogenous ZIP7 (yellow), calnexin (red) and surface membrane (green). (d) Paired raw and deconvolved, 3D-rendered images are shown for B cells (left, scale bar 1 μm) and HEK293T cells (right, scale bar 5 μm). (e) Detailed view of indicated area in (d). (f) Violin plot depicting minimum distance from the centre of each ZIP7+ve “particle” to the plasma membrane of individual B (n=8) or HEK293T (n=4) cells, visualized as in (d-e); representative of 2 independent experiments.
Figure 7.
Figure 7.. Impaired ZIP7 function results in reduced BCR signalling.
(a) Representative flow cytometry analysis of BM from WT (upper) and P198A-Hom (lower) mice, with (right) and without (left) co-expression of the SWHEL heavy and light chain transgenes. (b) Total numbers and (c) Mean fluorescence intensity (MFI) of surface IgM, BAFFR and CD20 on HEL binding cells from FrE in the BM of lethally irradiated CD45.1 mice reconstituted for 8 weeks with whole BM from CD45.2 WT (open circles) or P198A-Hom (closed circles) SWHEL mice, gated on B220+CD24+CD21HEL+IgD cells; n=3 mice per genotype; representative of 6 independent experiments. (d) Mean phospho-specific antibody binding to indicated intracellular signalling molecules downstream of the BCR, 5 min after stimulation of whole BM from WT/ SWHEL (closed circles) and P198A-Hom/ SWHEL (open circles) mice with media alone or 10μg/ml anti-IgM (two experiments) or 1,000ng/ml soluble Hen Egg Lysozyme (sHEL) and gated for Fr E as in a. In this figure, circles represent values from individual mice (n=3 per genotype), bars are means of groups and 95% CI; representative of 4 individual experiments.
Figure 8.
Figure 8.. ZIP7-dependent inhibition of B cell phosphatase activity
(a) Representative flow cytometric staining of B220+CD43IgD B cells from WT (upper) and P198A-Hom (lower) BM, showing phosphatase activity in the pre- (IgM) to immature (IgM+) B cell transition; plots representative of 3 separate experiments, with n=4 mice per genotype in each experiment. (b) Mean phosphatase activity in B cell Hardy Fractions A-F and myeloid cells (B220CD43+), from WT (closed circles) and P198A-Hom (open circles) BM. Results are pooled from 3 independent experiments, for a total of 11 mice per group, with comparison by two-way ANOVA (F 5.158; DF 6); *p=0.0438; **p=0.0010; ***p<0.0001. (c) Mean phospho-specific antibody binding to indicated intracellular signalling molecules downstream of the BCR, 30 min after treatment of WT (closed circles) and P198A-Hom (open circles) BM cells with the PTEN specific inhibitor BpV(phen), in the absence of BCR stimulation; gated on B220+CD24+CD21HEL+IgD SWHEL transgenic B cells. In this figure, circles represent values from individual mice (n=3 per genotype), bars are means of groups and 95% CI. Data are representative of 4 independent experiments.

Comment in

References

    1. Vetrie D, et al., The gene involved in X-linked agammaglobulinaemia is a member of the src family of protein-tyrosine kinases. Nature, 1993. 361(6409): p. 226–33. - PubMed
    1. Tsukada S, et al., Deficient expression of a B cell cytoplasmic tyrosine kinase in human X-linked agammaglobulinemia. Cell, 1993. 72(2): p. 279–90. - PubMed
    1. Aw A and Brown JR, Current Status of Bruton's Tyrosine Kinase Inhibitor Development and Use in B-Cell Malignancies. Drugs Aging, 2017. 34(7): p. 509–527. - PubMed
    1. Conley ME, Genetics of hypogammaglobulinemia: what do we really know? Curr Opin Immunol, 2009. 21(5): p. 466–71. - PMC - PubMed
    1. Durandy A, Kracker S, and Fischer A, Primary antibody deficiencies. Nat Rev Immunol, 2013. 13(7): p. 519–33. - PubMed

References for Online Methods

    1. Geiser J, et al., Clioquinol synergistically augments rescue by zinc supplementation in a mouse model of acrodermatitis enteropathica. PLoS One, 2013. 8(8): p. e72543. - PMC - PubMed
    1. Li H and Durbin R, Fast and accurate long-read alignment with Burrows-Wheeler transform. Bioinformatics, 2010. 26(5): p. 589–95. - PMC - PubMed
    1. McKenna A, et al., The Genome Analysis Toolkit: a MapReduce framework for analyzing next-generation DNA sequencing data. Genome Res, 2010. 20(9): p. 1297–303. - PMC - PubMed
    1. Li H, et al., The Sequence Alignment/Map format and SAMtools. Bioinformatics, 2009. 25(16): p. 2078–9. - PMC - PubMed
    1. Picelli S, et al., Full-length RNA-seq from single cells using Smart-seq2. Nat Protoc, 2014. 9(1): p. 171–81. - PubMed

Publication types

MeSH terms