. 2019 Mar;51(3):506-516.
doi: 10.1038/s41588-018-0331-5. Epub 2019 Feb 4.

The landscape of selection in 551 esophageal adenocarcinomas defines genomic biomarkers for the clinic

Collaborators, Affiliations

The landscape of selection in 551 esophageal adenocarcinomas defines genomic biomarkers for the clinic

Alexander M Frankell et al. Nat Genet. 2019 Mar.

Abstract

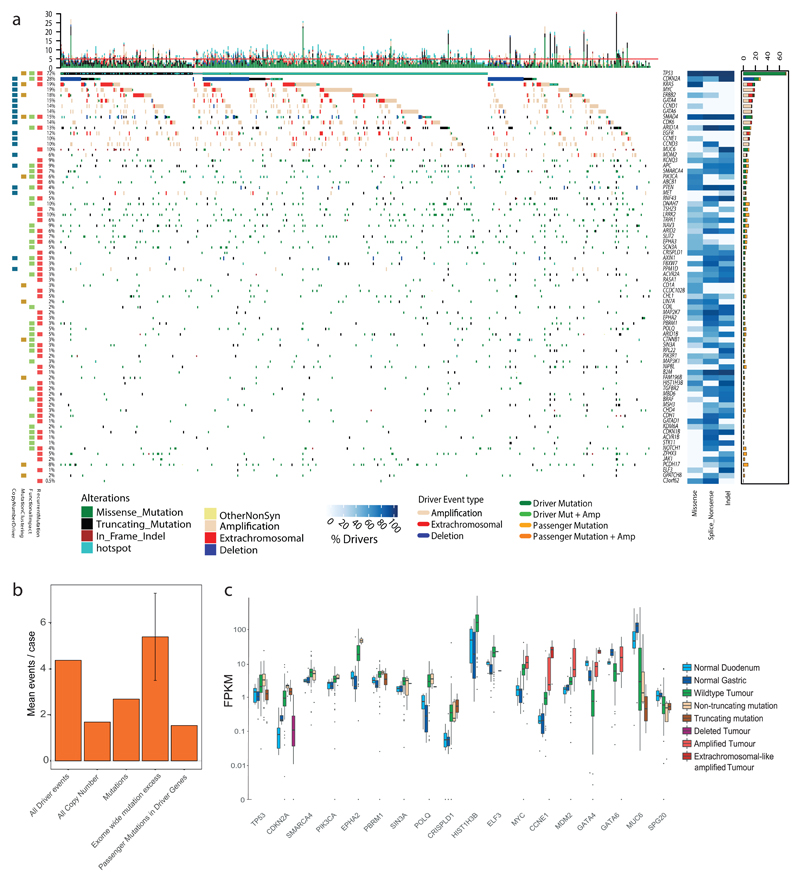
Esophageal adenocarcinoma (EAC) is a poor-prognosis cancer type with rapidly rising incidence. Understanding of the genetic events driving EAC development is limited, and there are few molecular biomarkers for prognostication or therapeutics. Using a cohort of 551 genomically characterized EACs with matched RNA sequencing data, we discovered 77 EAC driver genes and 21 noncoding driver elements. We identified a mean of 4.4 driver events per tumor, which were derived more commonly from mutations than copy number alterations, and compared the prevelence of these mutations to the exome-wide mutational excess calculated using non-synonymous to synonymous mutation ratios (dN/dS). We observed mutual exclusivity or co-occurrence of events within and between several dysregulated EAC pathways, a result suggestive of strong functional relationships. Indicators of poor prognosis (SMAD4 and GATA4) were verified in independent cohorts with significant predictive value. Over 50% of EACs contained sensitizing events for CDK4 and CDK6 inhibitors, which were highly correlated with clinically relevant sensitivity in a panel of EAC cell lines and organoids.


Conflict of interest statement

Competing interests

The authors declare no competing interests.

Figures

Figure 1
Figure 1. Detection of EAC driver genes.
a, Types of driver-associated features used to detect positive selection in mutations and copy number events with examples of genes containing such features. b, Coding driver genes identified and their driver-associated features. c, Non-coding driver elements detected and their element types.
Figure 2
Figure 2. Copy number variation under positive selection.
a, Recurrent copy number changes across the genome identified by GISTIC in 551 EACs. Frequency of different CNV types are indicated (dark blue, homozygous deletion; light blue, heterozygous deletion; dark red, extrachromosomal-like amplification; light red, amplification) as well as the position of CNV high confidence driver genes and candidate driver genes. The q value for expression correlation with amplification and homozygous deletion is shown for each gene within each amplification (wilcox test, one sided, expression compared above and below 90th percentile of pliody-adjusted CN) and deletion peak (wilcox test, one sided, expression compared between homozygous deleted and all other cases) respectively and occasions of significant association between LOH and mutation are indicated in green (fisher’s exact test, one sided). Benjamini & Hochberg false discovery correction was applied in each of these cases. Purple deletion peaks indicate fragile sites. b, Examples of extrachromosomal-like amplifications suggested by very high read support SVs at the boundaries of highly amplified regions produced from a single copy number step. In the first example two populations of extrachromosomal DNA are apparent, one amplifying only MYC and the second also incorporating ERBB2 from a different chromosome. In the second example an inversion has occurred before circularization and amplification around KRAS. c, Relationship between copy number and expression in copy number driver genes in RNA matched sub-cohort (n=116). A 2D kernel density estimation and a leoss regression curve with 95% CIs (grey) are shown to describe the data.
Figure 3
Figure 3. The driver gene landscape of EAC.
a, Driver mutations or CNVs are shown for each patient of 551 EACs. Amplification is defined as >2 copy number adjusted ploidy (2x ploidy of that case) and extrachromosomal amplification as >10 copy number adjusted ploidy (10x ploidy for that case). Driver associated features for each driver gene are displayed to the left. On the right, the percentages of different mutation and copy number changes are displayed, differentiating between driver and passenger mutations using dNdScv, and the % of predicted drivers by mutation type is shown. Above the plot are the number of driver mutations per sample with an indication of the mean (red line = 5). b, Mean driver events per case in 551 EACsand comparison to exome-wide excess of mutations generated by dNdScv. c, Expression changes in EAC driver genes in comparison to normal intestinal tissues in RNA matched samples (n=116). Only genes with expression changes of note are shown.
Figure 4
Figure 4. Biological pathways undergoing selective dysregulation in EAC.
a, Biological pathways dysregulated by driver gene mutation and/or CNVs in 551 cases. Wild-type cases for a pathway are not shown. Inter and intra-pathway interactions are described, and mutual exclusivities and/or associations between genes in a pathway are annotated. GATA4 and GATA6 amplifications have a mutually exclusive relationship, although this does not reach statistical significance (Fisher’s exact test, two-sided, P = 0.07, OR = 0.52). b, Pairwise assessment of mutual exclusivity and association in EAC driver genes and pathways. Two sided Fisher’s exact test were used and hyper-mutated (>500 exonic mutations) cases were removed to avoid bias towards co-occurrence, hence n = 510. RTK; Receptor Tyrosine Kinase pathway.
Figure 5
Figure 5. Clinical significance of driver events in 379 clinically annotated EACs.
a, Hazard ratios and 95% confidence intervals for Cox regression analysis across all driver genes with at least a 5% frequency of driver alterations. *q < 0.05 after BH adjustment. b, Kaplan-Meier curves for EACs with different status of significant prognostic indicators (GATA4 and SMAD4). c, Kaplan-Meier curves for different alterations in the TGF-β pathway. d, Kaplan-Meier curves showing verification GATA4 prognostic value in GI cancers using a pancreatic TCGA cohort. e, Kaplan-Meier curves showing verification SMAD4 prognostic value in gastroesophageal cancers using a gastroesophageal TCGA cohort. f, Differentiation bias in tumors containing events in Wnt pathway driver genes. g, Relative frequency of KRAS mutations and TP53 mutations driver gene events in females vs. males (Fisher’s exact test, two sided).
Figure 6
Figure 6. CDK4/6 inhibitors in EAC.
a, Drug classes for which sensitivity is indicated by EAC driver genes with data from the Cancer Biomarkers database. b, Area under the curve (AUC) of sensitivity is shown in a panel of 13 EAC and Barrett’s esophagus high grade dysplasia cell lines with associated WGS and their corresponding driver events, based on primary tumor analysis. AUC is also shown for two control lines: T47D, an ER-positive breast cancer line (positive control), and MDA-MB-468, an Rb negative breast cancer (negative control). *CCNE1 is a known marker of resistance to CDK4/6 inhibitors due to its regulation of Rb downstream of CDK4/6, hence bypassing the need for CDK4/6 activity (see Fig. 4). c, Response of organoid cultures to three FDA approved CDK4/6 inhibitors and corresponding driver events. RTK; Receptor tyrosine kinase pathway, BC; Breast Cancer.

References

    1. Ferlay J, Soerjomataram I, Dikshit R, et al. Cancer incidence and mortality worldwide: sources, methods and major patterns in GLOBOCAN 2012. Int J Cancer. 2015 Mar 1;136(5):E359–386. - PubMed
    1. Coleman HG, Xie SH, Lagergren J. The Epidemiology of Esophageal Adenocarcinoma. Gastroenterology. 2018 Jan;154(2):390–405. - PubMed
    1. Smyth EC, Lagergren J, Fitzgerald RC, et al. Oesophageal cancer. Nat Rev Dis Primers. 2017 Jul 27;3:17048. - PMC - PubMed
    1. Campbell PJ, Getz G, Stuart JM, Korbel JO, Stein LD. Pan-cancer analysis of whole genomes. bioRxiv. 2017
    1. Ciriello G, Miller ML, Aksoy BA, Senbabaoglu Y, Schultz N, Sander C. Emerging landscape of oncogenic signatures across human cancers. Nat Genet. 2013 Oct;45(10):1127–1133. - PMC - PubMed

Publication types

Substances

Supplementary concepts