. 2019 Aug 15;145(4):1111-1124.
doi: 10.1002/ijc.32181. Epub 2019 Feb 27.

GITR ligation enhances functionality of tumor-infiltrating T cells in hepatocellular carcinoma

Affiliations

GITR ligation enhances functionality of tumor-infiltrating T cells in hepatocellular carcinoma

Adriaan A van Beek et al. Int J Cancer. .

Abstract

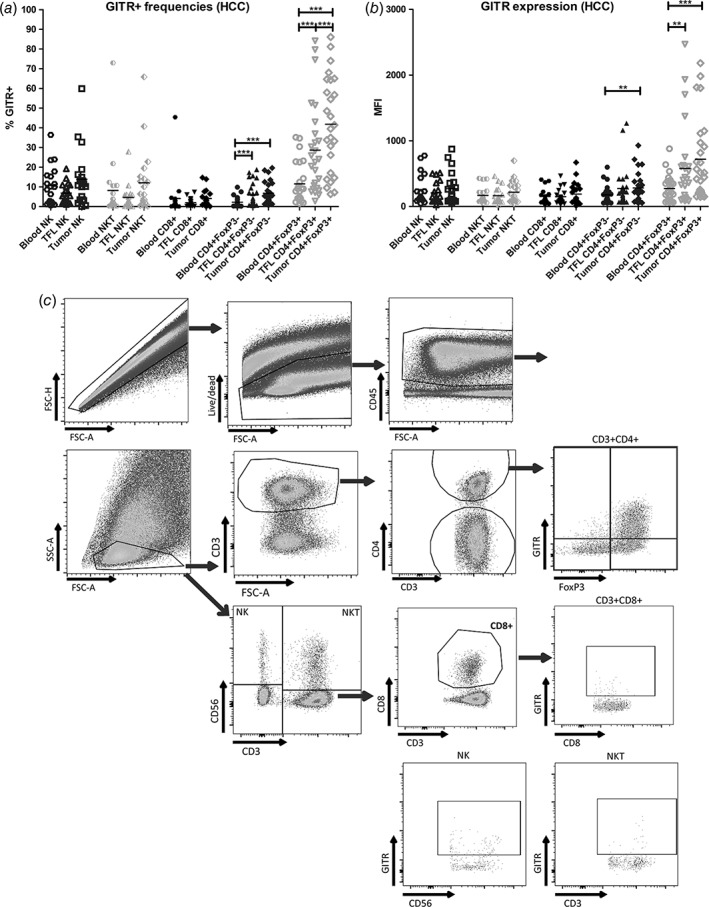
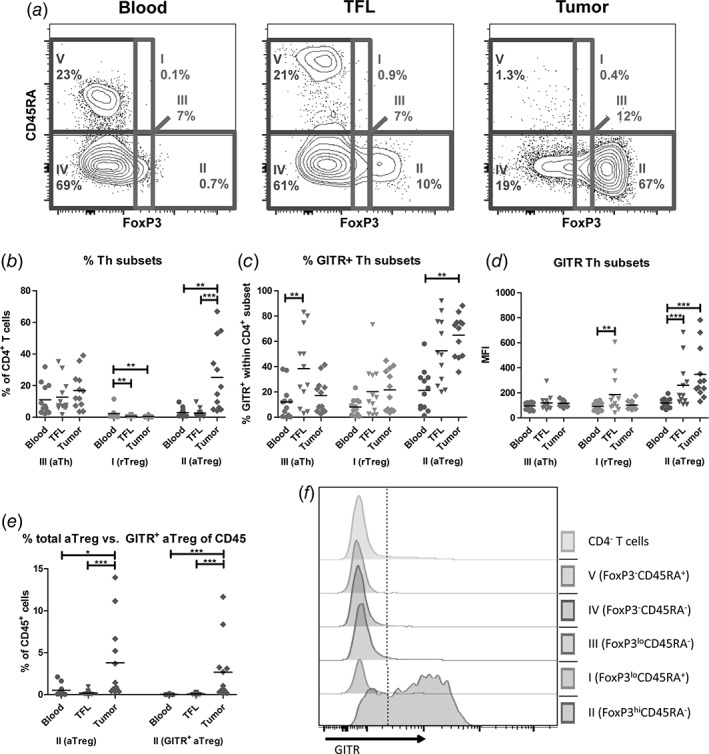
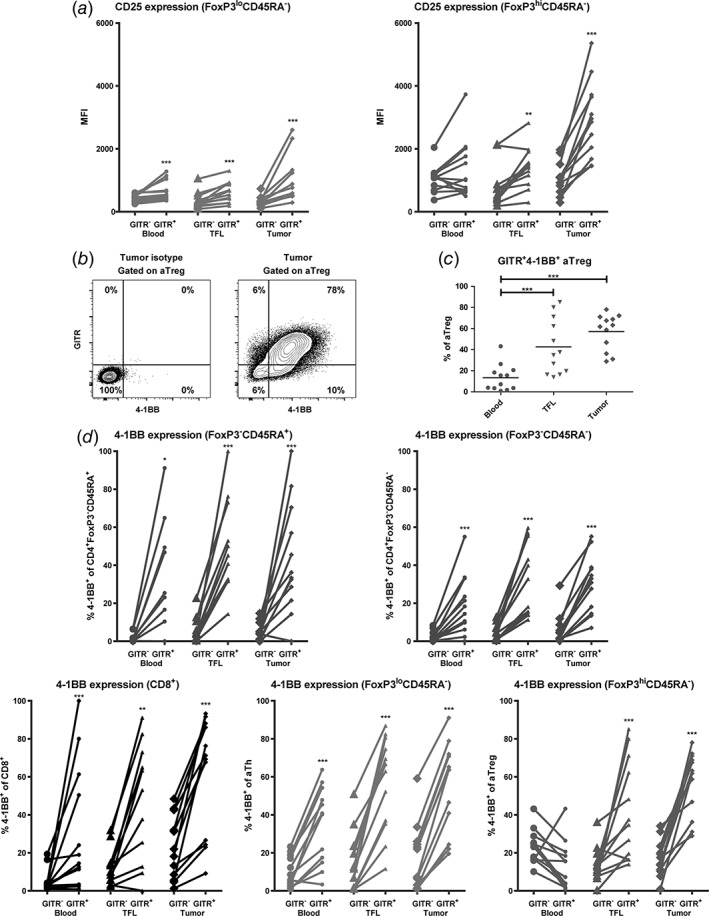
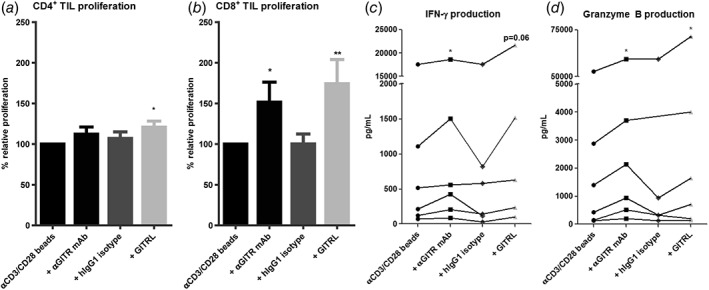
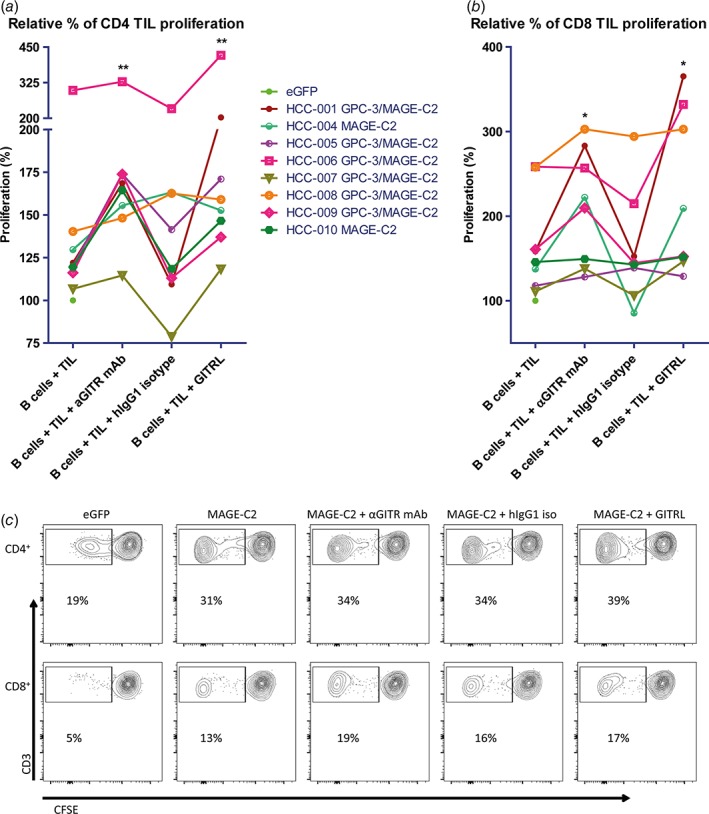
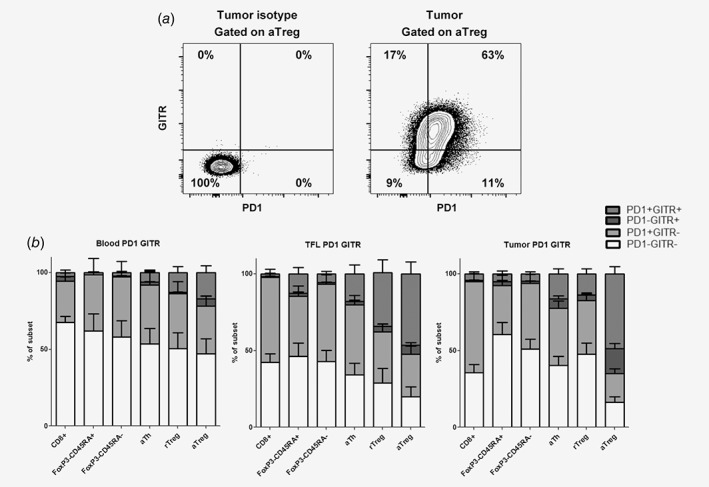
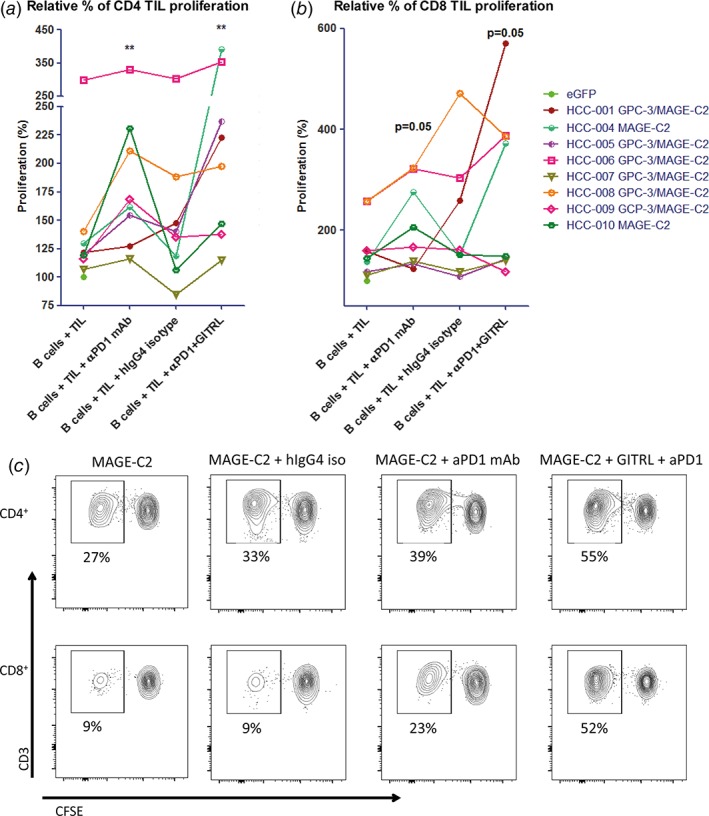
No curative treatment options are available for advanced hepatocellular carcinoma (HCC). Anti-PD1 antibody therapy can induce tumor regression in 20% of advanced HCC patients, demonstrating that co-inhibitory immune checkpoint blockade has therapeutic potential for this type of cancer. However, whether agonistic targeting of co-stimulatory receptors might be able to stimulate anti-tumor immunity in HCC is as yet unknown. We investigated whether agonistic targeting of the co-stimulatory receptor GITR could reinvigorate ex vivo functional responses of tumor-infiltrating lymphocytes (TIL) freshly isolated from resected tumors of HCC patients. In addition, we compared GITR expression between TIL and paired samples of leukocytes isolated from blood and tumor-free liver tissues, and studied the effects of combined GITR and PD1 targeting on ex vivo TIL responses. In all three tissue compartments, CD4+ FoxP3+ regulatory T cells (Treg) showed higher GITR- expression than effector T-cell subsets. The highest expression of GITR was found on CD4+ FoxP3hi CD45RA- activated Treg in tumors. Recombinant GITR-ligand as well as a humanized agonistic anti-GITR antibody enhanced ex vivo proliferative responses of CD4+ and CD8+ TIL to tumor antigens presented by mRNA-transfected autologous B-cell blasts, and also reinforced proliferation, IFN-γ secretion and granzyme B production in stimulations of TIL with CD3/CD28 antibodies. Combining GITR ligation with anti-PD1 antibody nivolumab further enhanced tumor antigen-specific responses of TIL in some, but not all, HCC patients, compared to either single treatment. In conclusion, agonistic targeting of GITR can enhance functionality of HCC TIL, and may therefore be a promising strategy for single or combinatorial immunotherapy in HCC.

Keywords: CD357; GITR; HCC; PD1; TNFRSF18; Treg; cancer immunotherapy.


Figures

Figure 1
Figure 1
CD4+FoxP3+ TIL from HCC patients show highest GITR expression. (a) GITR+ cell frequencies within NK cells, NKT cells, CD8+, CD4+FoxP3 and CD4+FoxP3+ T cell subsets in mononuclear leukocytes isolated from blood, tumor‐free liver (TFL), and tumor tissues from HCC patients. (b) As in (a), showing median fluorescence intensities (MFI) of GITR expression on the indicated immune cell subsets. Dots represent individual patients and lines present means. N = 19–26 patients. ** = p < 0.01; *** = p < 0.001. (c) Representative FACS dot plots of one patient display the gating strategies.
Figure 2
Figure 2
Activated Treg are highly enriched in HCC tumors and express the highest levels of GITR. (a) Representative example of flow cytometric analysis of CD4+ T cell subsets by FoxP3 and CD45RA, identifying five fractions: FoxP3loCD45RA+ resting Treg (fraction I), FoxP3hiCD45RA activated Treg (fraction II), FoxP3loCD45RA activated Th (fraction III), FoxP3CD45RA memory Th (fraction IV), and FoxP3CD45RA+ naïve Th (fraction V). (b) Percentages of fractions I‐III within CD4+ T cells. (c) GITR+ frequencies within fractions I‐III. (d) Median fluorescence intensities (MFI) of GITR expression on cells within fractions I‐III. (e) Percentages of total activated Treg (left) and GITR+ activated Treg (right) within CD45+ mononuclear leukocytes. Dots represent individual patients and lines present means. N = 12 patients. * = p < 0.025; ** = p < 0.01; *** = p < 0.001. (f) Representative FACS histograms of one patient display the expression of GITR in CD4+ T cell subsets.
Figure 3
Figure 3
GITR expression on activated T cell subsets is accompanied by increased CD25 and 4‐1BB expression. (a) GITR+ activated T helper (CD4+FoxP3loCD45RA) and activated regulatory T cell (CD4+FoxP3hiCD45RA) subsets express higher levels of CD25 than their GITR counterparts. (b) Representative example of flow cytometric analysis, showing co‐expression of GITR and 4‐1BB on intra‐tumoral activated Treg (aTreg) (fraction II). (c) Percentages of GITR+4‐1BB+ activated Treg in blood, TFL, and tumor. Dots represent individual patients and lines present means. (d) 4‐1BB+ frequencies within GITR versus GITR+ cells of CD8+ T cells and four different CD4+ T cell subsets in blood, TFL, and tumor. N = 12 patients. * = p < 0.05; ** = p < 0.01; *** = p < 0.001.
Figure 4
Figure 4
GITR ligation enhances ex vivo proliferation and effector molecule production of CD4+ and CD8+ TIL. Effects of soluble GITRL (1 μg/mL crosslinked with anti‐HA antibody) or 10 μg/mL humanized agonistic anti‐GITR antibody on proliferation of (a) CD4+ TIL, and (b) CD8+ TIL upon 4 to 5 days’ culture of tumor‐derived mononuclear cells with a suboptimal amount of anti‐CD3/CD28 beads. Proliferation was measured by determination of percentages of CD4+ or CD8+ T cells expressing Ki‐67 at the end of the culture. Baseline proliferation (= % of Ki‐67+ T cells in the absence of GITRL or antibodies) was normalized to 100% for each tested patient. Bars show mean percentages of Ki‐67+ CD4+ or CD8+ T cells in cultures relative to baseline proliferation in cultures derived from n = 9 patients with SEM. An irrelevant human IgG1 antibody served as an isotype‐matched control antibody for the anti‐GITR antibody. (c) Production of IFN‐γ and d) granzyme B in culture supernatant was quantified. Data of patients with detectable amounts of IFN‐γ or granzyme B are shown, each line represents one patient. * = p < 0.05; ** = p < 0.01.
Figure 5
Figure 5
GITR ligation increases ex vivo proliferation of CD4+ and CD8+ TIL in response to tumor antigens presented by mRNA‐transfected autologous B cells. Effects of soluble GITRL (1 μg/mL crosslinked with anti‐HA antibody) or 10 μg/mL humanized agonistic anti‐GITR antibody on proliferation of (a) CD4+ TIL, and (b) CD8+ TIL upon 6 days’ culture of CFSE‐labeled tumor‐derived mononuclear cells with B cell blasts electroporated with mRNA encoding tumor antigens GPC3 or MAGEC2 (or eGFP as a negative control). Proliferation was measured by determination of percentages of CFSElow CD4+ or CD8+ T cells at the end of the culture. Baseline proliferation (= % of CFSElow T cells in the presence of eGFP‐electroporated B cells) was normalized to 100% for each tested patient, and is indicated by a closed green circle. The data depicted as ‘B cells + TIL’ demonstrate that TIL from all patients showed enhanced responses to MAGEC2 as compared to eGFP, while TIL of 6 patients also responded to GPC3. For those patients whose TIL responded to both tumor antigens, the average response to GPC3‐ and MAGEC2‐electroporated B cells was depicted. Each line represents one patient. An irrelevant human IgG1 antibody served as an isotype‐matched control antibody for the anti‐GITR antibody. Data show responses in TIL cultures of n = 8 patients. * = p < 0.05; ** = p < 0.01 compared to baseline (B cells + TIL). (c) Representative FACS contour plots of one patient display the proliferation of CD4+ and CD8+ TIL in response to autologous eGFP or MAGEC2‐electroporated B cells.
Figure 6
Figure 6
Co‐expression of GITR and PD1. (a) Representative example of flow cytometric analysis of GITR and PD1 expression on tumor‐derived activated Treg. (b) Mean frequencies of GITRPD1, GITRPD1+, GITR+PD1 and GITR+PD1+ within CD8+ T cells, FoxP3CD45RA+ Th, FoxP3CD45RA Th, activated Th, resting Treg and activated Treg in blood, TFL, and tumor with SEM. N = 12 patients.
Figure 7
Figure 7
Combined targeting of GITR and PD1 increases ex vivo proliferation of CD4+ and CD8+ TIL in response to tumor antigens presented by mRNA‐transfected autologous B cells in some patients. Effects of 10 μg/mL antagonistic anti‐PD1 antibody (nivolumab) or anti‐PD1 antibody combined with soluble GITRL (1 μg/mL crosslinked with anti‐HA antibody) on proliferation of (a) CD4+ TIL, and (b) CD8+ TIL upon 6 days’ culture of CFSE‐labeled tumor‐derived mononuclear cells with B cell blasts electroporated with mRNA encoding tumor antigens GPC3 or MAGEC2 (or eGFP as a negative control). Proliferation was measured by determination of percentages of CFSElow CD4+ or CD8+ T cells at the end of the culture. Baseline proliferation (= % of CFSElow T cells in the presence of eGFP‐electroporated B cells) was normalized to 100% for each tested patient, and is indicated by a closed green circle. For those patients whose TIL responded to both tumor antigens, the average response to GPC3‐ and MAGEC2‐electroporated B cells was depicted. Each line represents one patient. An irrelevant human IgG4 antibody served as an isotype‐matched control antibody for the anti‐PD1 antibody. Data show responses in cultures of n = 8 patients. * = p < 0.05; ** = p < 0.01 compared to baseline (B cells + TIL). (c) Representative FACS contour plots of one patient display the proliferation of CD4+ and CD8+ TIL in response to autologous MAGEC2‐electroporated B cells.

References

    1. Torre LA, Bray F, Siegel RL, et al. Global cancer statistics, 2012. CA Cancer J Clin 2015;65:87–108. - PubMed
    1. Mazzanti R, Gramantieri L, Bolondi L. Hepatocellular carcinoma: epidemiology and clinical aspects. Mol Aspects Med 2008;29:130–43. - PubMed
    1. El‐Serag HB, Marrero JA, Rudolph L, et al. Diagnosis and treatment of hepatocellular carcinoma. Gastroenterology 2008;134:1752–63. - PubMed
    1. European Association for the Study of the Liver . EASL clinical practice guidelines: management of hepatocellular carcinoma. J Hepatol 2018;69:182–236. - PubMed
    1. Schachter J, Ribas A, Long GV, et al. Pembrolizumab versus ipilimumab for advanced melanoma: final overall survival results of a multicentre, randomised, open‐label phase 3 study (KEYNOTE‐006). Lancet 2017;390:1853–62. - PubMed

Publication types

MeSH terms

Substances