. 2019 Feb 5:8:e40032.
doi: 10.7554/eLife.40032.

Listeria monocytogenes cell-to-cell spread in epithelia is heterogeneous and dominated by rare pioneer bacteria

Affiliations

Listeria monocytogenes cell-to-cell spread in epithelia is heterogeneous and dominated by rare pioneer bacteria

Fabian E Ortega et al. Elife. .

Abstract

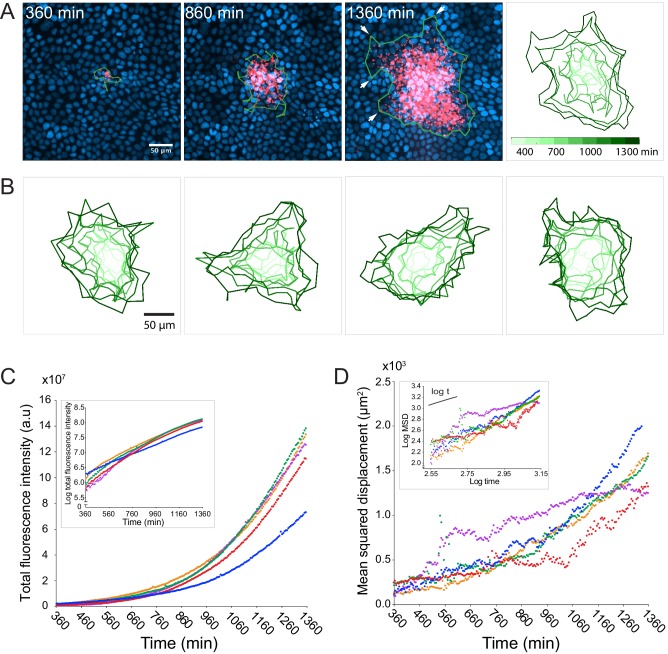
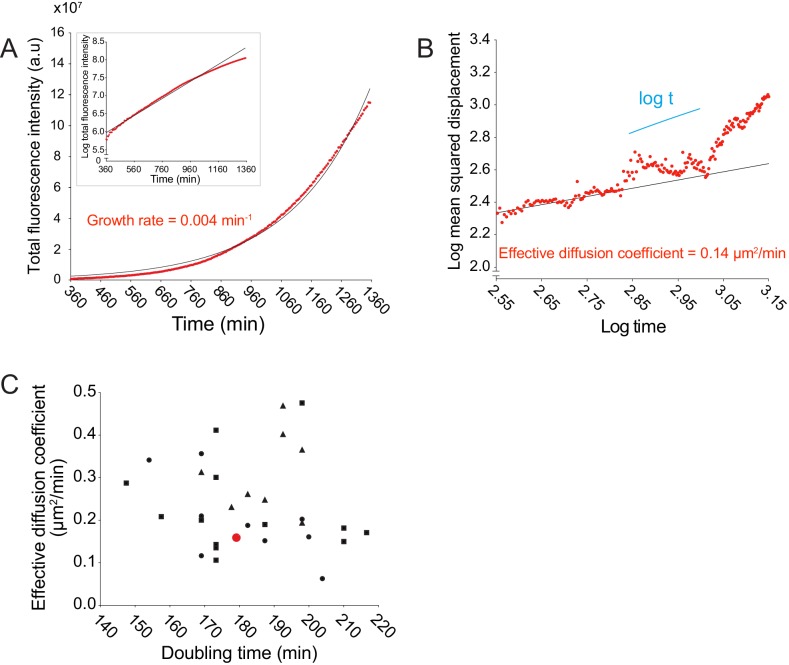
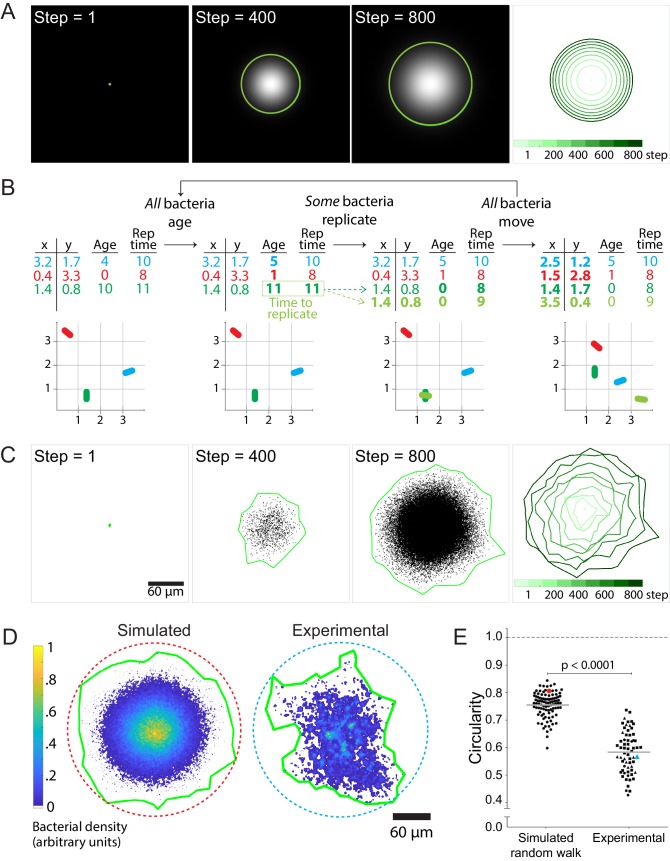
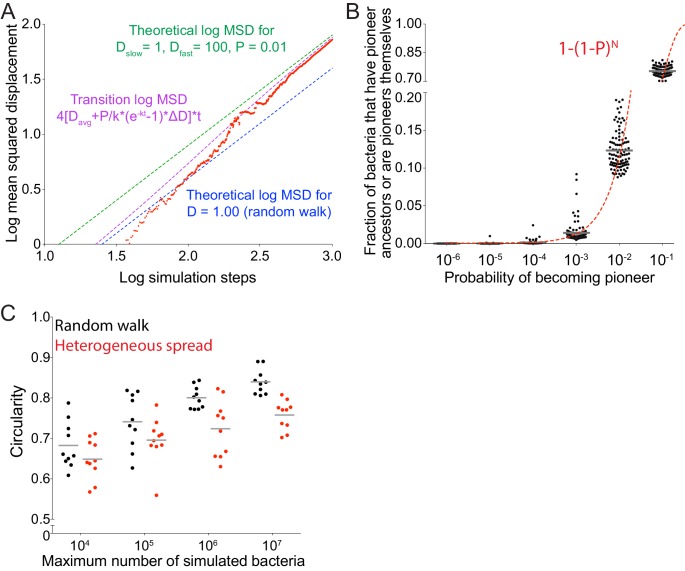
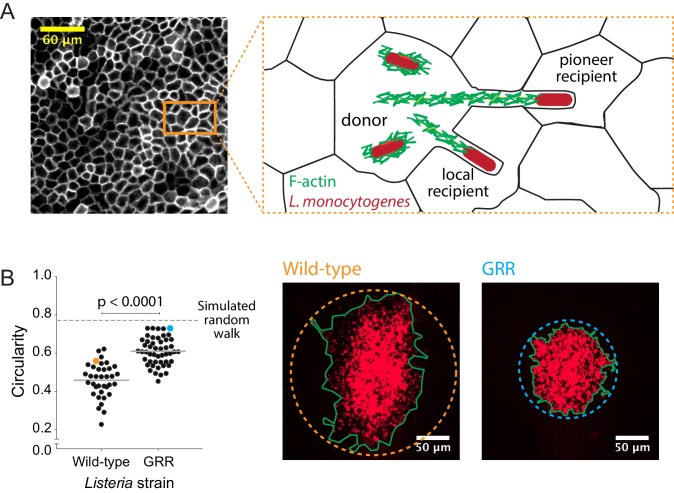
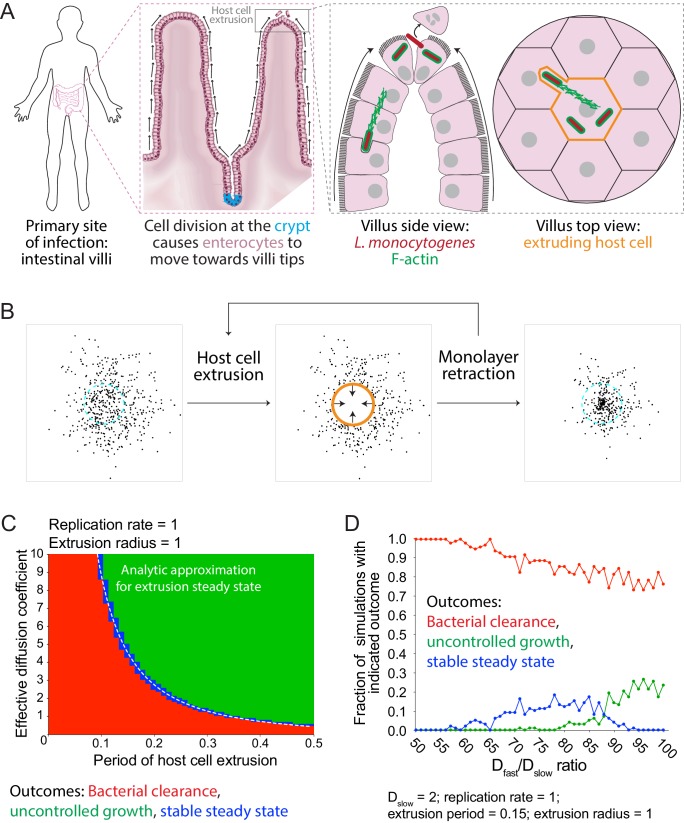
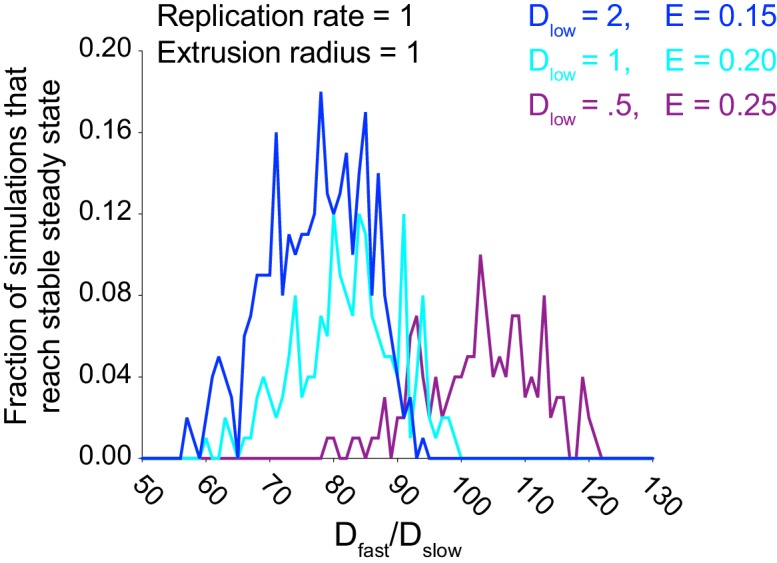
Listeria monocytogenes hijacks host actin to promote its intracellular motility and intercellular spread. While L. monocytogenes virulence hinges on cell-to-cell spread, little is known about the dynamics of bacterial spread in epithelia at a population level. Here, we use live microscopy and statistical modeling to demonstrate that L. monocytogenes cell-to-cell spread proceeds anisotropically in an epithelial monolayer in culture. We show that boundaries of infection foci are irregular and dominated by rare pioneer bacteria that spread farther than the rest. We extend our quantitative model for bacterial spread to show that heterogeneous spreading behavior can improve the chances of creating a persistent L. monocytogenes infection in an actively extruding epithelium. Thus, our results indicate that L. monocytogenes cell-to-cell spread is heterogeneous, and that rare pioneer bacteria determine the frontier of infection foci and may promote bacterial infection persistence in dynamic epithelia.

Editorial note: This article has been through an editorial process in which the authors decide how to respond to the issues raised during peer review. The Reviewing Editor's assessment is that all the issues have been addressed (see decision letter).

Keywords: Listeria monocytogenes; actin-based motility; cell biology; cell-to-cell spread; epithelial monolayer; infectious disease; microbiology.


Conflict of interest statement

FO, EK, JT No competing interests declared

Figures

Figure 1.
Figure 1.. L. monocytogenes spreads anisotropically through a polarized, confluent MDCK cell monolayer.
(A) On the left three panels, micrographs show nuclei (Hoechst, blue) and intracellular bacteria (mTagRFP, red) at three different time points post-infection. Green boundaries fully enclose all bacteria. On the fourth panel, boundaries (shades of green) depict the progression of the infection focus boundaries at nine evenly-spaced time points (see colorbar). (B) Examples of four different foci boundaries through time. (C) Quantification of total bacterial fluorescence intensity as a function of time for five different foci. Semi-log plot in inset. (D) Quantification of mean squared displacement (MSD) as a function of time for five different foci. Log-log plot in inset where short solid line indicates linear scaling. For C and D, each focus is represented by a different color.
Figure 1—figure supplement 1.
Figure 1—figure supplement 1.. Doubling times (min) and effective diffusion coefficients (µm2/min) for live microscopy data are uncorrelated.
(A) Data quantifying the total bacterial fluorescence intensity as a function of time. Data points were fit to an exponential function (solid black line). Growth rate was estimated from the exponential fit. Semi-log plot in inset: log-transformed data in red and linear fit in black. (B) Data quantifying the log of MSD as a function of the log of time. Log-transformed data points, from start to ~2.95 log time, were fit to a linear function (solid black line). Effective diffusion coefficient was calculated by dividing the slope of the linear fit by 4. Short solid line indicates linear scaling. (C) Data plotting effective diffusion coefficients versus doubling times, which were calculated by dividing the natural log of 2 by the growth rate. Each data point represents an independent time-lapse movie. Each shape represents an independent experiment. Red data point corresponds to the data shown in panels A and B.
Figure 2.
Figure 2.. Stochastic simulations of cell-to-cell spread via random walks are inconsistent with observed shape of infection foci.
(A) On the left three panels, images depict the solution of the reaction-diffusion equation at three different time steps. Green boundaries enclose the brightest 90% of pixels. On the fourth panel, boundaries (shades of green) depict the progression of the shape of the differential equation solution at nine evenly-spaced time steps (see colorbar). (B) Schematic of stochastic simulation. Each bacterium, depicted by a different color, is represented by a location in Cartesian coordinates, age, and replication time. A bacterium replicates when its age catches up with its replication time. Bacteria take steps that are normally distributed and scaled by an effective diffusion coefficient D, and they replicate according to a replication rate k. (C) The left three panels depict three time steps of a random walk stochastic simulation where D = 1 and k = 1. Each simulated bacterium is depicted by a data point. Green boundaries fully enclose all data points. On the fourth panel, boundaries (shades of green) depict the progression of a simulated focus boundaries at nine evenly-spaced time steps. (D) Representative simulated focus convolved with the L. monocytogenes point spread function (left). Representative experimental focus (right). Green boundaries fully enclose all bacteria. Circular dashed lines represent the smallest circles that fully enclose green boundaries. Colorbar indicates bacterial density. (E) Data quantifying infection foci circularity of simulated data versus experimental data. For experimental data, each shape depicts an independent experiment. Horizontal bars indicate the mean. p-Value was calculated with the non-parametric Wilcoxon rank sum test. The red and cyan data points correspond to the simulated and experimental foci, respectively, from panel D.
Figure 2—figure supplement 1.
Figure 2—figure supplement 1.. Stochastic model accurately simulates a random walk.
(A) Data quantifying the number of bacteria as a function of simulation steps. Data points were fit to an exponential function plotted as a solid black line. The value of ktrue refers to the exponential growth rate used as an input for the simulation. The value of kestimated was calculated from the exponential fit. (B) Data quantifying the mean squared displacement as a function of simulation steps. Data points were fit to a linear function plotted as a solid black line. The value of Dtrue refers to the value of the effective diffusion coefficient used as an input for the simulation. The value of Destimated was calculated by dividing the slope of the mean squared displacement by 4. (C) Data plotting kestimated versus ktrue. (D) Data plotting Destimated versus Dtrue. For C and D, each data point represents the average estimated value for 1000 independent simulations. Vertical error bars represent the standard deviation. Horizontal axes show the true diffusion coefficient or growth rate value used as an input for the simulations. All simulations from panels A-D were run until 105 bacteria had been accumulated.
Figure 2—figure supplement 2.
Figure 2—figure supplement 2.. Radial speed of the frontier of infection foci approaches the square root of 2Dk as time increases.
Quantification of the radial speed of the leading edge of simulated infection foci. Speed was calculated from the slope of the square root of the focus area as a function of time. Each data point represents an independent simulation. For these simulations, D = 1 and k = 1. Simulations were run for an indicated number of steps. Horizontal bars indicate the mean. Dashed line shows the speed expected from analytical calculations, that is 2 times the square root of Dk.
Figure 2—figure supplement 3.
Figure 2—figure supplement 3.. Circularity does not depend on the size of the simulated infection focus.
(A) Schematic of three simulated foci. Each color represents a different infection focus simulated with an effective diffusion coefficient set to 1 (blue), 10 (red), and 100 (green). (B) Quantification of the circularity of simulated infection foci with three diffusion coefficients used in panel A. Fifty independent simulations were run for each effective diffusion coefficient, and each data point represents an independent simulation. For these simulations, k = 1. Horizontal bars indicate the mean. p-value comparing all three groups was calculated with the non-parametric Kruskal-Wallis test.
Figure 2—figure supplement 4.
Figure 2—figure supplement 4.. Host cell boundaries and motility persistence do not affect simulated infection focus circularity.
(A) Data quantifying the circularity of simulated infection foci generated by a random walk and a random walk including host cell boundaries and motility persistence. Each data point refers to an independent simulation where D equals 1, k equals 1, the side length of the square host cells equals 1. A total of 100 simulations were run per condition. Each simulation was run until 105 bacteria had been accumulated. Dashed line around 0.58 refers to the mean of the experimental circularity. Solid horizontal bars refer to the mean. p-value was calculated with the non-parametric Wilcoxon rank sum test. (B) Data quantifying circularity of infection foci as a function of probability of crossing host boundaries. Each data point represents the average of 1000 independent simulations each of which was run as described for panel A. Vertical bars, too short to be seen, indicate the standard deviation. Each simulation was run until 104 (black) or 105 (red) bacteria had been accumulated. Dashed line represents the mean circularity of experimental foci.
Figure 3.
Figure 3.. Allowing simulated bacteria to interconvert between pioneer and non-pioneer behavior recapitulates the non-circular phenotype of experimental foci.
(A) On the left nine panels, micrographs show nuclei (Hoechst, blue) and intracellular bacteria (mTagRFP, red). Green lines, which serve as an approximation of host cell boundaries, depict the Voronoi tessellation of the centroids of the host nuclei. White arrows track a single pioneer and its two daughters through time. Start time (leftmost panel) refers to 1255 min post-infection. The right panel shows nuclei (Hoechst, blue) and the pioneer path throughout 180 min. Dots indicate the position of the pioneer at a given time point. Shades of red depict progression of time. Black arrow indicates start position. Orange arrows indicate the location and time of two bacterial replication events. (B) The left three panels depict three time steps of a stochastic simulation where Dslow = 1, Dfast = 100, P = 0.10, and k = 1. Each simulated bacterium is depicted by a data point. Green boundaries fully enclose all data points. On the fourth panel, boundaries (shades of green) depict the progression of a simulated focus boundaries at nine evenly-spaced time steps. (C) Images depicting 105 simulated bacteria at step 800 of stochastic simulations where Dslow = 1, Dfast = 100, k = 1, and probability of becoming a pioneer is depicted in cyan. Green boundaries fully enclose all data points. Circular dashed lines represent the smallest circles that fully enclose the green boundaries. (D) Data quantifying the circularity of experimental (red) and simulated (black) foci at step 800, which, normalized by the replication rate (0.006 min−1), is equivalent to approximately 1360 min of experimental time. For experimental data, each shape depicts an independent experiment. Dashed line at circularity of 0.58 refers to the mean of the experimental circularity. Horizontal bars indicate the mean for each condition. (E) Data quantifying circularity of simulated infection foci as a function of probability of becoming a pioneer. Each data point represents the average of 100 independent simulations. Vertical bars represent the standard deviation. Each color represents a different value of Dfast/Dslow ratio. Dashed line around 0.58 refers to the mean of the experimental circularity. For all simulations, replication rate k equals 1.
Figure 3—figure supplement 1.
Figure 3—figure supplement 1.. Allowing simulated bacteria to interconvert between pioneer and non-pioneer behavior significantly affects the circularity of the infection focus.
(A) Simulated data (red) quantifying the log mean squared displacement as a function of the log of simulation steps where Dslow = 1, Dfast = 100, and P = 0.01. Dashed magenta line indicates the analytical solution for a population initially composed of non-pioneers, with probability P of becoming a pioneer at each replication event set by the growth rate k. For this expression, Davg equals the average of Dfast and Dslow weighed by P, and ∆D equals Dfast – DSlow. Blue and green dashed lines show the short time asymptotic limit (diffusive spreading with D = 1) and the long time asymptotic limit (diffusive spreading with D = Dslow*(1–P) + Dfast*P = 1.96), respectively. (B) Data quantifying the number of bacteria that either have a fast ancestor or are fast themselves as a function of probability of becoming a pioneer. Each data point represents an independent simulation. A total of 100 simulations were run per condition. Each simulation started with 25 bacteria and was run until 105 bacteria had been accumulated. Dashed line gives analytic solution: 1–(1–P)N where N is the typical number of generations in the simulation (N equals approximately 12). (C) Data quantifying the infection foci circularity as a function of number of bacteria simulated for a random walk (black) or heterogeneous spread where Dfast/Dslow = 100 and probability of becoming a pioneer is 0.10 (red). Each data point represents an independent simulation. For B and C, horizontal bars indicate the mean. For all simulations, replication rate k equals 1.
Figure 3—figure supplement 2.
Figure 3—figure supplement 2.. As time increases, focus circularity increases in both simulated and experimental data.
(A) Data quantifying the circularity of simulated infection foci as a function of time. Different colors represent independent simulations with distinct values of P, the probability of the becoming a pioneer. For all simulations, replication rate k equals 1. (B) Data quantifying the circularity of experimental infection foci as a function of time. Each color represents a different focus. The effective time scales for parts A and B are comparable.
Figure 4.
Figure 4.. Decreasing the rate of bacterial protrusion formation leads to more circular infection foci.
(A) Micrograph showing phalloidin staining of MDCK cell monolayer (left), and a cartoon representation of host cell boundaries based on phalloidin staining and L. monocytogenes spreading from cell to cell. (B) Data quantifying the circularity of foci generated by wild-type and GRR L. monocytogenes. Horizontal bars indicate the mean. p-value was calculated using the non-parametric Wilcoxon rank sum test. The orange and cyan data points correspond to the foci on the right. Green boundaries fully enclose all bacteria. Circular dashed lines represent the smallest circles that fully enclose green boundaries.
Figure 4—figure supplement 1.
Figure 4—figure supplement 1.. Changing the value of Dfast/Dslow significantly affects the circularity of simulated foci; changing directional persistence does not.
Data quantifying the circularity of simulated infection foci as a function persistence. Each data point represents the average of 100 independent simulations. Vertical bars represent the standard deviation. Each color represents a different value of Dfast/Dslow ratio. For all simulations, replication rate k equals 1.
Figure 5.
Figure 5.. Simulations predict that heterogeneous spread increases the chance of a persistent L. monocytogenes infection in the intestinal epithelium.
(A) Schematic of the topology of the intestinal epithelium and L. monocytogenes cell-to-cell spread originating at the tip of intestinal villi. Image of intestinal villi was adapted from ‘Structure of villi and microvilli present on the epithelial cells of the small intestine.’ https://commons.wikimedia.org/wiki/File:Esquema_del_epitelio_del_intestino_delgado.png. License: CC BY-SA 4.0. Villus side view image was adapted from Figure 3 of Pizarro-Cerdá et al. (2012). (B) Schematic of the steps of the host cell extrusion simulation. Host cell boundary of next cell to be extruded is depicted as a cyan dashed line. Extruding host cell is depicted as an orange boundary. Black arrows inside host cell in the second panel indicate monolayer retraction after extrusion. (C) Phase diagram of simulated data depicting the outcomes of host cell extrusion random walk simulations with only a single effective diffusion coefficient (no pioneers) for different combinations of host cell extrusion periods and effective diffusion coefficients. A total of 100 simulations were run for each combination. For these simulated data, the radius of extrusion equals 1, and the bacterial replication rate equals 1. Units are normalized by the replication rate, 0.006 min−1, and radius of an extruded cell, 7 µm (Ho et al., 2017). The white dashed line represents the analytic approximation for extrusion steady state. (D) Simulated data showing the outcomes of host cell extrusion simulations where extrusion period equals 0.15, extrusion radius equals 1, Dslow equals 2, and Dfast varies. Vertical axis depicts the fraction of simulations with indicated outcome for 100 simulations per value of Dfast/Dslow ratio.
Figure 5—figure supplement 1.
Figure 5—figure supplement 1.. Random walk host cell extrusion simulations predominantly lead to all-or-nothing outcomes.
Data quantifying the fraction of simulations with indicated outcome (bacterial clearance in red, uncontrolled growth in green, stable steady state in blue) as a function of effective diffusion coefficient. A total of 100 simulations were run for each effective diffusion coefficient. For these simulated data, the radius of extrusion equals 1, the extrusion period equals 0.15, and the bacterial replication rare equals 1 Uncontrolled growth occurs when the number of simulated bacteria in the monolayer reaches 105, stable steady state occurs when the number of simulated extruded bacteria reaches 2 × 10⁵, and bacterial clearance occurs if the number of simulated bacteria in the monolayer reaches zero.
Figure 5—figure supplement 2.
Figure 5—figure supplement 2.. Simulations predict that heterogeneous spread increases the chance of a persistent L. monocytogenes infection in the intestinal epithelium for several combinations of Dslow and host cell extrusion periods.
Data quantifying the fraction of simulations that reached a stable steady state for three combinations of Dslow and host cell extrusion period E as a function of Dfast/Dslow ratio. The bacterial replication rate equals 1. A total of 100 simulations were run for each Dfast/Dslow ratio for each curve. Uncontrolled growth occurs when the number of simulated bacteria in the monolayer reaches 105, stable steady state occurs when the number of simulated extruded bacteria reaches 2 × 10⁵, and bacterial clearance occurs if the number of simulated bacteria in the monolayer reaches zero.

Comment in

  • Listeria pioneers.
    Hofer U. Hofer U. Nat Rev Microbiol. 2019 Apr;17(4):196-197. doi: 10.1038/s41579-019-0161-1. Nat Rev Microbiol. 2019. PMID: 30765849 No abstract available.

References

    1. Andow DA, Kareiva PM, Levin SA, Okubo A. Spread of invading organisms. Landscape Ecology. 1990;4:177–188. doi: 10.1007/BF00132860. - DOI
    1. Auerbuch V, Loureiro JJ, Gertler FB, Theriot JA, Portnoy DA. Ena/VASP proteins contribute to listeria monocytogenes pathogenesis by controlling temporal and spatial persistence of bacterial actin-based motility. Molecular Microbiology. 2003;49:1361–1375. doi: 10.1046/j.1365-2958.2003.03639.x. - DOI - PubMed
    1. Begley M, Sleator RD, Gahan CG, Hill C. Contribution of three bile-associated loci, bsh, pva, and btlB, to gastrointestinal persistence and bile tolerance of listeria monocytogenes. Infection and Immunity. 2005;73:894–904. doi: 10.1128/IAI.73.2.894-904.2005. - DOI - PMC - PubMed
    1. Berg H. Random Walks in Biology (Expanded E) Princeton: Princeton University Press; 1993.
    1. Bishop DK, Hinrichs DJ. Adoptive transfer of immunity to listeria monocytogenes. the influence of in vitro stimulation on lymphocyte subset requirements. Journal of Immunology. 1987;139:2005–2009. - PubMed

Publication types