. 2019 Feb 5:8:e41855.
doi: 10.7554/eLife.41855.

The cuticular hydrocarbon profiles of honey bee workers develop via a socially-modulated innate process

Affiliations

The cuticular hydrocarbon profiles of honey bee workers develop via a socially-modulated innate process

Cassondra L Vernier et al. Elife. .

Abstract

Large social insect colonies exhibit a remarkable ability for recognizing group members via colony-specific cuticular pheromonal signatures. Previous work suggested that in some ant species, colony-specific pheromonal profiles are generated through a mechanism involving the transfer and homogenization of cuticular hydrocarbons (CHCs) across members of the colony. However, how colony-specific chemical profiles are generated in other social insect clades remains mostly unknown. Here we show that in the honey bee (Apis mellifera), the colony-specific CHC profile completes its maturation in foragers via a sequence of stereotypic age-dependent quantitative and qualitative chemical transitions, which are driven by environmentally-sensitive intrinsic biosynthetic pathways. Therefore, the CHC profiles of individual honey bees are not likely produced through homogenization and transfer mechanisms, but instead mature in association with age-dependent division of labor. Furthermore, non-nestmate rejection behaviors seem to be contextually restricted to behavioral interactions between entering foragers and guards at the hive entrance.

Keywords: Apis melifera; ecology; honey bee; social insects.


Conflict of interest statement

CV, JK, KM, AH, JL, YB No competing interests declared

Figures

Figure 1.
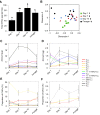
Figure 1.. CHC profiles of bees exhibit quantitative and qualitative changes in association with age.
(A) Total CHC amounts (μg) extracted from sister bees of different ages. (B) CHC profiles of sister bees of different ages. (C) Statistically significantly changing amounts (μg) of individual CHCs across sister bees of different ages. (D) A subset of C with low amounts. (E) Statistically significantly changing proportions of individual CHCs across sister bees of different ages. (F) A subset of C with low proportions. Statistics in A using ANOVA followed by Tukey’s HSD post-hoc. Statistics in B using Permutation MANOVA followed by FDR pairwise contrasts shown as a non-metric multidimensional scaling plot depicting Bray-Curtis dissimilarity between samples. Statistics for C and D are listed in Table 1, statistics for E and F are listed in Table 3. Lowercase letters above bars in A and legend in B denote posthoc significance (p<0.05). Sample size per group, N = 8.
Figure 1—figure supplement 1.
Figure 1—figure supplement 1.. CHC profiles of bees exhibit quantitative and qualitative changes in association with age.
Data shown here and in Figure 1 were collected from two independent colonies. (A) Total CHC amounts (μg) extracted from sister bees of different ages. (B) CHC profiles of sister bees of different ages. (C) Statistically significantly changing amounts (μg) of individual CHCs across sister bees of different ages. (D) A subset of C with low amounts. (E) Statistically significantly changing proportions of individual CHCs across sister bees of different ages. (F) A subset of C with low proportions. Statistics in A using ANOVA followed by Tukey’s HSD post-hoc. Statistics in B using Permutation MANOVA followed by FDR pairwise contrasts, shown as a non-metric multidimensional scaling plot depicting Bray-Curtis dissimilarity between samples. Statistics for C and D are listed in Table 2, statistics for E and F are listed in Table 4. Letters in graph and legend denote posthoc statistical significance (p<0.05). Sample size per group, N = 8.
Figure 2.
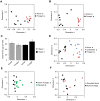
Figure 2.. Effect of task on the CHC profile of bees is independent of age.
Single cohort colony bees differ in CHC profile by behavioral task at one week of age (typical nurse age, (A)) and three weeks of age (typical forager age, (B)). (C) SCC bees do not differ in total CHC amount due to age and/or task. (D) Undertakers and nurses differ from foragers in CHC profile. (E) ‘Big-back’ bees differ from same-aged actively foraging sisters in CHC profile. Total CHC statistics (C) using ANOVA followed by Tukey’s HSD with FDR correction. CHC profile statistics (A, B, D, E) using Permutation MANOVA followed by FDR pairwise contrasts, shown as non-metric multidimensional scaling plots depicting Bray-Curtis dissimilarity between samples. Letters in graphs and legends denote posthoc statistical significance (p<0.05). Sample size per group, N = 8.
Figure 2—figure supplement 1.
Figure 2—figure supplement 1.. CHC profiles differ between unknown-aged foragers from two different colonies at a single location.
Statistics using Permutation MANOVA followed by FDR pairwise contrasts shown as a non-metric multidimensional scaling plot depicting Bray-Curtis dissimilarity between samples. Lowercase letters in legend denote posthoc significance (p<0.05). Sample size per group, N = 8.
Figure 3.
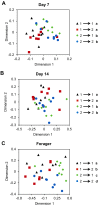
Figure 3.. Cross-fostering indicates colony environment drives the signature CHC profiles of foragers.
Age-matched cross-fostered bees differ in CHC profile by source colony at Day 7 (A) and Day 14 (B), and by both source colony and foster colony when they are foragers (C). Number to left of arrow in legend represents the bee’s source colony, and the number to the right represents the bee’s foster colony. All statistics using Permutation MANOVA followed by FDR pairwise contrasts, shown as non-metric multidimensional scaling plots depicting Bray-Curtis dissimilarity between samples. Letters in legends denote posthoc statistical significance (p<0.05). Sample size per group, N = 8.
Figure 3—figure supplement 1.
Figure 3—figure supplement 1.. Sample size assessment of cross-fostered bees indicates sample size of 8 is adequate.
Pseudo multivariate dissimilarity-based standard error ‘levels off’ around a sample size of 7 for all cross-fostered groups at Day 7 (A), Day 14 (B), and when they are foragers (C).
Figure 4.
Figure 4.. Age and social environment affect the expression level of CHC biosynthesis genes.
(A) Elongase gene. (B–C) Desaturase genes. Only genes with different expression levels between at least two groups are shown (See Table 7 for results for all studied genes). Black bars represent bees raised in their own colony. Grey bars represent sister forager bees that were raised in an unrelated colony (‘Fostered’). (D) Heat map of relative expression levels of all genes tested. Aging bee statistics using ANOVA followed by Tukey HSD post-hoc, or Kruskal-Wallis followed by Dunn’s Test with FDR adjustment post-hoc, with letters denoting posthoc statistical significance (p<0.05). Between colony statistics using Mann-Whitney U test, with asterisks above grey bars denoting statistical significance from foraging bees raised in their own colony (*, p<0.05). Sample size per group, N = 4.
Figure 5.
Figure 5.. Nestmate recognition cues are forager-specific.
(A) Bees are accepted at a similar rate as Colony one foragers at the entrance to their source colony (Colony 1) at all ages. (B) Bees are rejected at a similar rate as Colony one foragers at an unrelated colony (Colony 2) on Day one and Day 21. However, bees are accepted at a similar rate as Colony two foragers at an unrelated colony (Colony 2) on Day seven and Day 14. All statistics using Pearson’s Chi-Square. Asterisks or letters denote posthoc statistical significance (p<0.05), ns denotes non-significant comparisons. Sample size per group, N = 18–29.

References

    1. Akino T, Yamamura K, Wakamura S, Yamaoka R. Direct behavioral evidence for hydrocarbons as nestmate recognition cues in Formica japonica (Hymenoptera: Formicidae) Applied Entomology and Zoology. 2004;39:381–387. doi: 10.1303/aez.2004.381. - DOI
    1. Alaux C, Sinha S, Hasadsri L, Hunt GJ, Guzmán-Novoa E, DeGrandi-Hoffman G, Uribe-Rubio JL, Southey BR, Rodriguez-Zas S, Robinson GE. Honey bee aggression supports a link between gene regulation and behavioral evolution. PNAS. 2009;106:15400–15405. doi: 10.1073/pnas.0907043106. - DOI - PMC - PubMed
    1. Anderson MJ, Santana-Garcon J. Measures of precision for dissimilarity-based multivariate analysis of ecological communities. Ecology Letters. 2015;18:66–73. doi: 10.1111/ele.12385. - DOI - PMC - PubMed
    1. Baracchi D, Petrocelli I, Chittka L, Ricciardi G, Turillazzi S. Speed and accuracy in nest-mate recognition: a hover wasp prioritizes face recognition over colony odour cues to minimize intrusion by outsiders. Proceedings of the Royal Society B: Biological Sciences. 2015;282:20142750. doi: 10.1098/rspb.2014.2750. - DOI - PMC - PubMed
    1. Ben-Shahar Y, Thompson CK, Hartz SM, Smith BH, Robinson GE. Differences in performance on a reversal learning test and division of labor in honey bee colonies. Animal Cognition. 2000;3:119–125. doi: 10.1007/s100710000068. - DOI

Publication types

LinkOut - more resources