. 2019 Feb 5:8:e43584.
doi: 10.7554/eLife.43584.

Heparin-induced tau filaments are polymorphic and differ from those in Alzheimer's and Pick's diseases

Affiliations

Heparin-induced tau filaments are polymorphic and differ from those in Alzheimer's and Pick's diseases

Wenjuan Zhang et al. Elife. .

Abstract

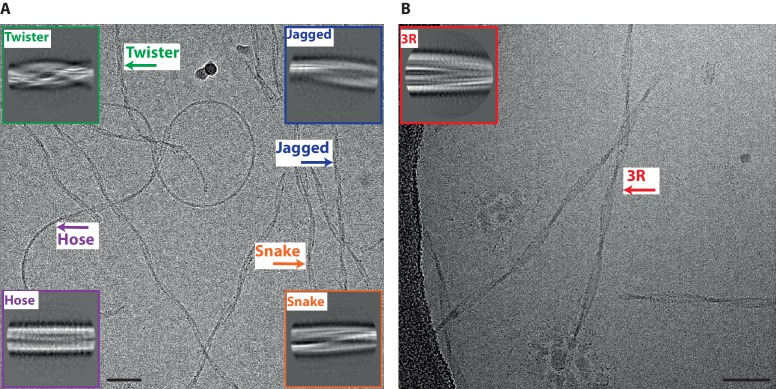
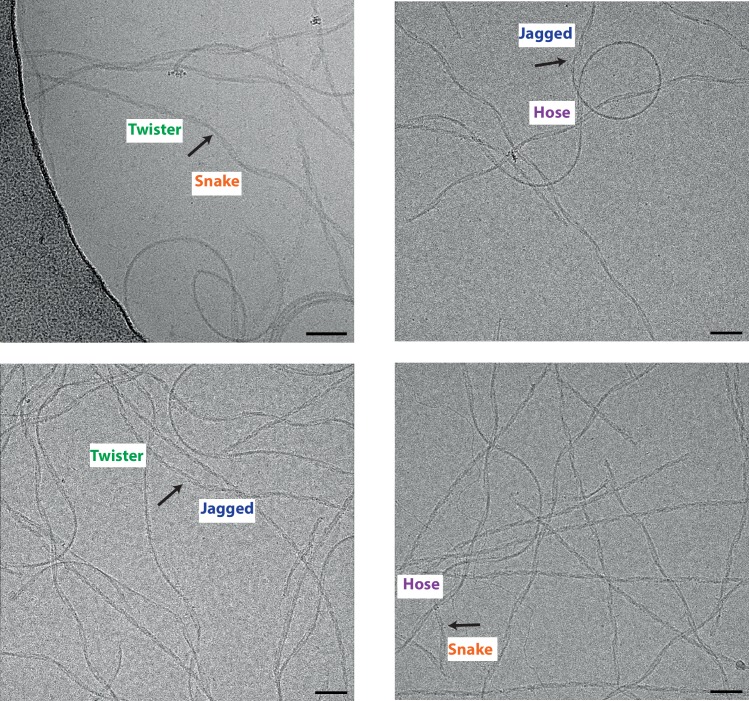
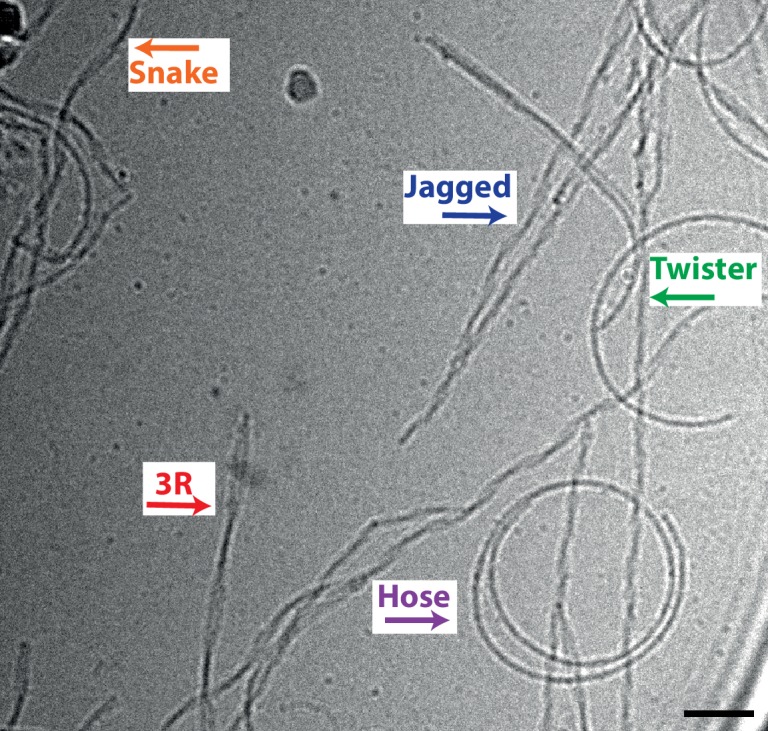
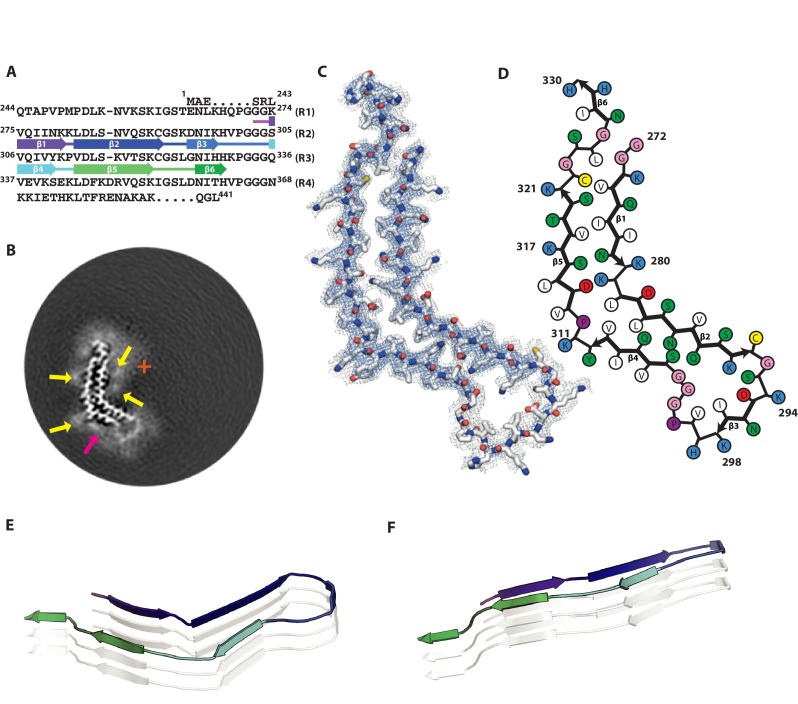
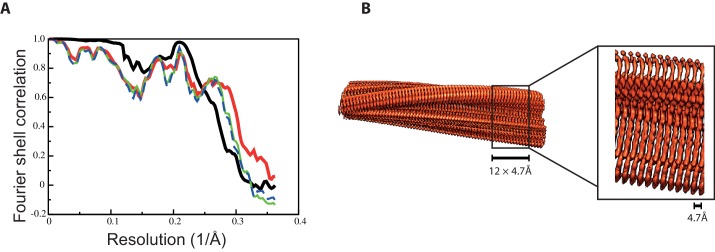
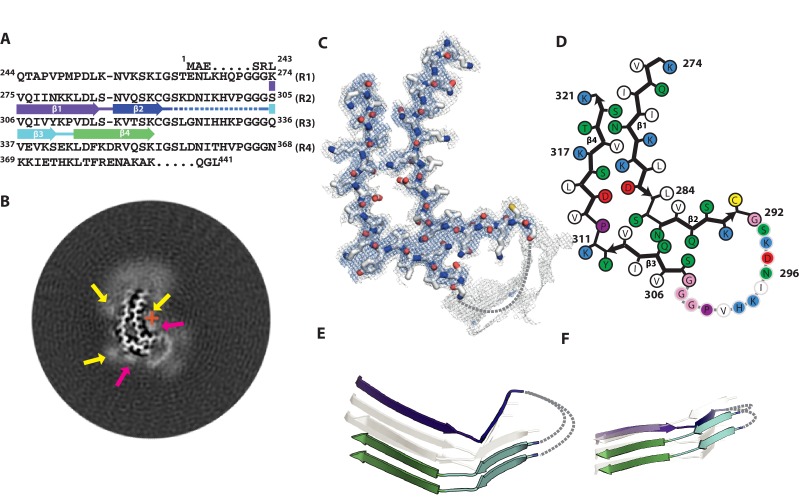
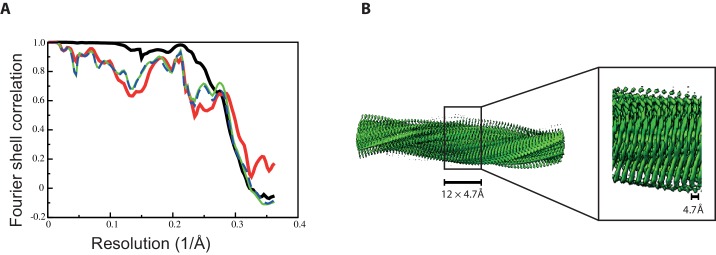
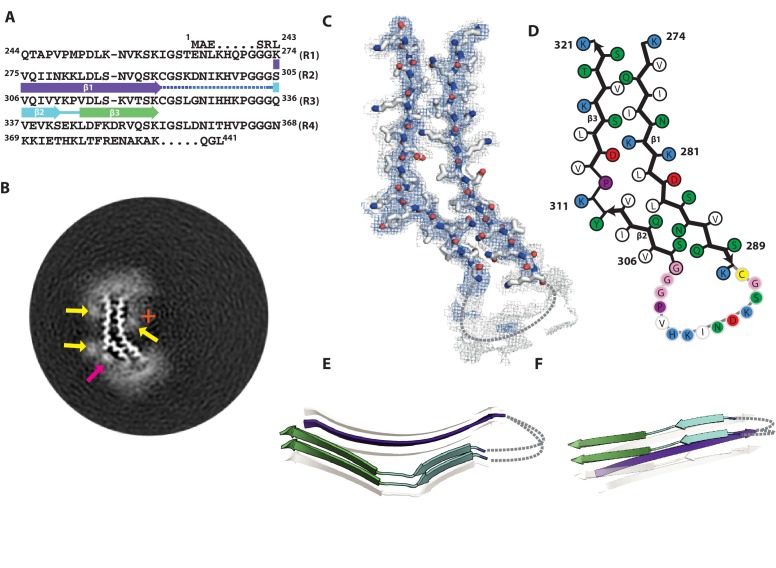
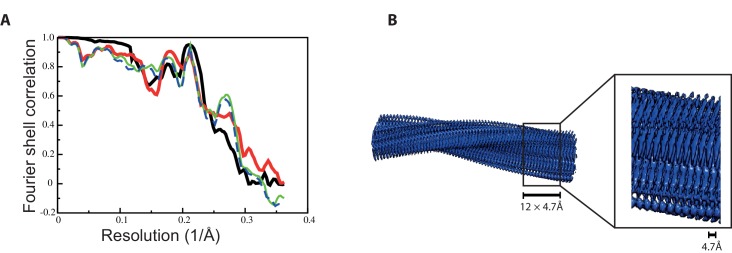
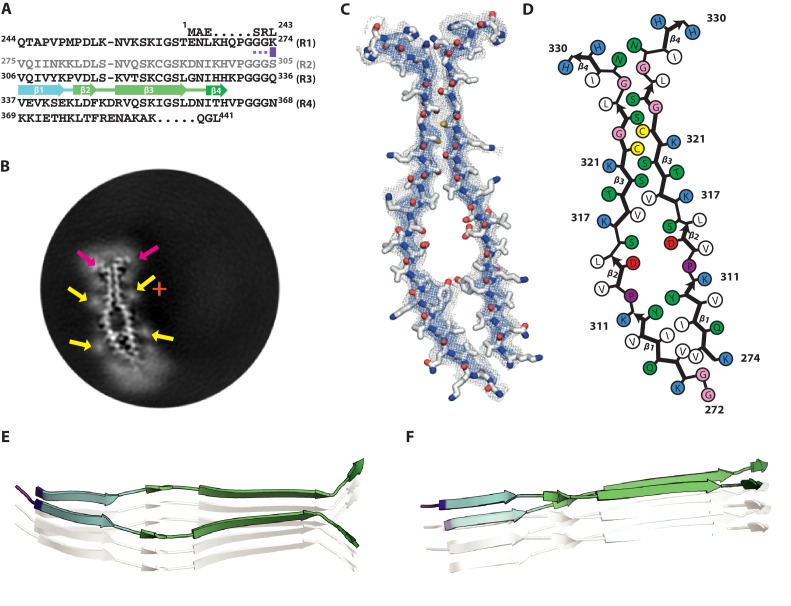
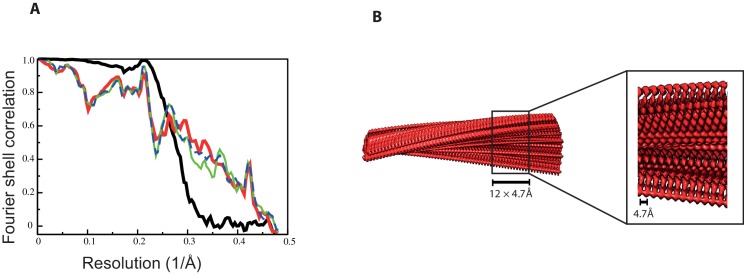
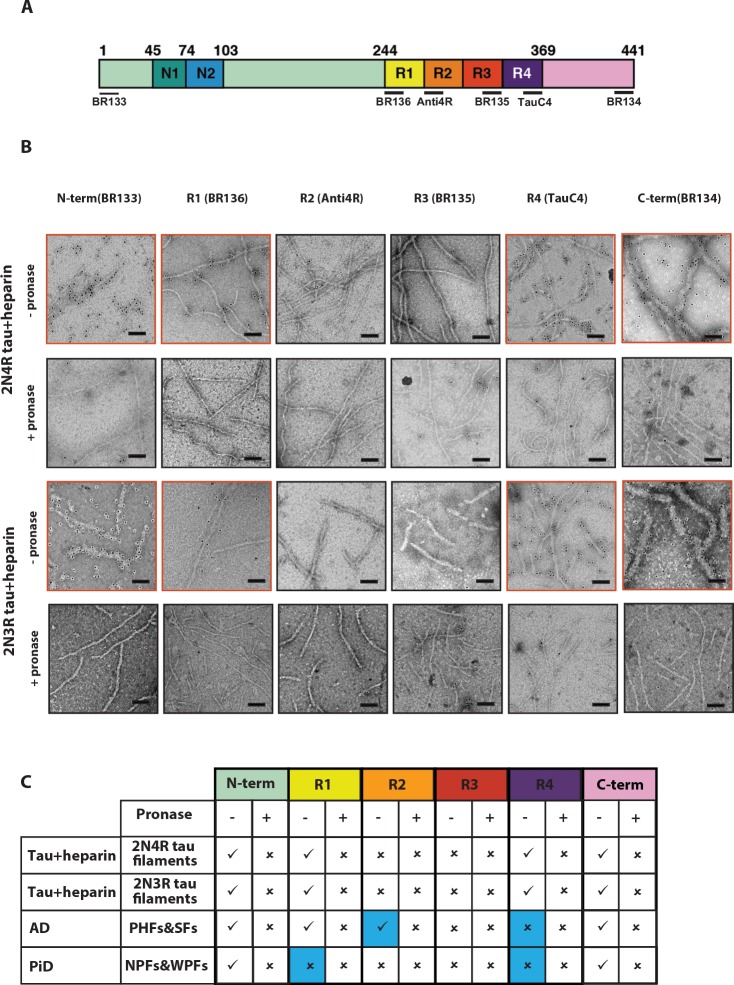
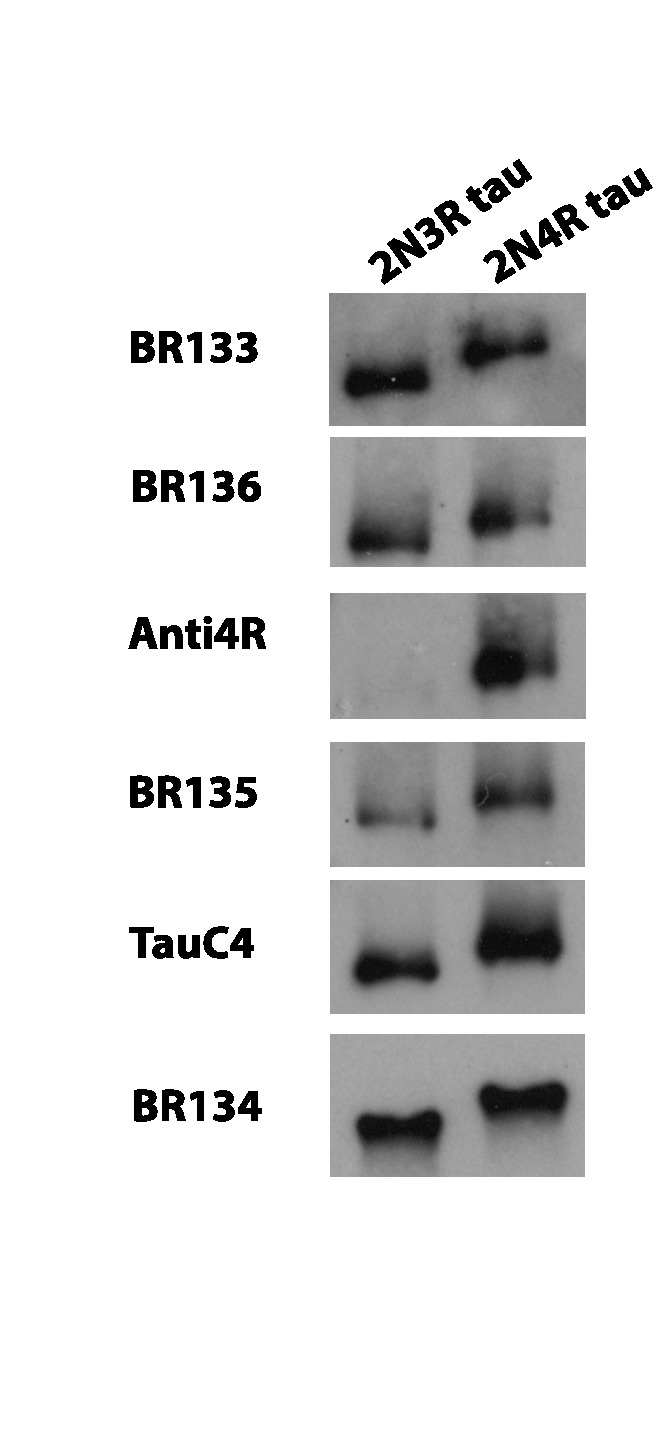
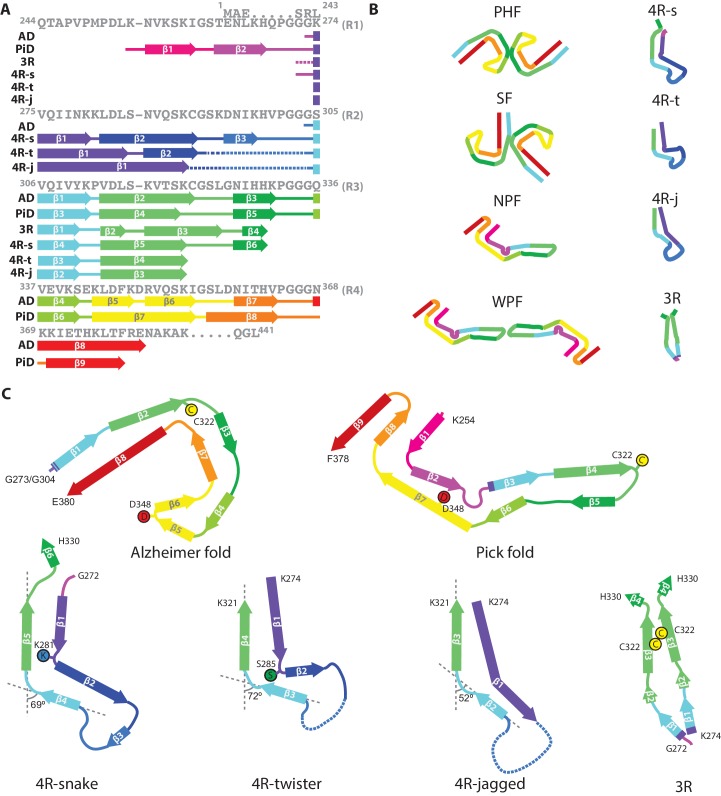
Assembly of microtubule-associated protein tau into filamentous inclusions underlies a range of neurodegenerative diseases. Tau filaments adopt different conformations in Alzheimer's and Pick's diseases. Here, we used cryo- and immuno- electron microscopy to characterise filaments that were assembled from recombinant full-length human tau with four (2N4R) or three (2N3R) microtubule-binding repeats in the presence of heparin. 2N4R tau assembles into multiple types of filaments, and the structures of three types reveal similar 'kinked hairpin' folds, in which the second and third repeats pack against each other. 2N3R tau filaments are structurally homogeneous, and adopt a dimeric core, where the third repeats of two tau molecules pack in a parallel manner. The heparin-induced tau filaments differ from those of Alzheimer's or Pick's disease, which have larger cores with different repeat compositions. Our results illustrate the structural versatility of amyloid filaments, and raise questions about the relevance of in vitro assembly.

Keywords: E.coli over-expression; RELION; cryo-EM; helical reconstruction; human; micro-tubule associated protein tau; molecular biophysics; structural biology.


Conflict of interest statement

WZ, BF, AM, JF, RC No competing interests declared, MG, SS Reviewing editor, eLife

Figures

Figure 1.
Figure 1.. Different types of heparin-induced tau filaments.
(A) Cryo-EM image of heparin-induced 2N4R tau filaments. (B) Cryo-EM image of heparin-induced 2N3R tau filaments. 2D class averages of each filament type are shown as insets. Scale bars, 50 nm.
Figure 1—figure supplement 1.
Figure 1—figure supplement 1.. Heparin-induced tau filaments can change from one type into another.
Scale bars, 50 nm.
Figure 1—figure supplement 2.
Figure 1—figure supplement 2.. Cryo-EM image of heparin-induced filaments assembled from a mixture of 2N4R and 2N3R tau.
Scale bars, 50 nm.
Figure 2.
Figure 2.. Cryo-EM structure of 2N4R tau snake filaments.
(A) β-strands and loop regions in the filaments are shown in different colours below the primary sequence of the microtubule-binding repeats (R1–R4). (B) Central slice of the 3D map. The position of the helical axis is indicated by a red cross, extra densities close to outward-facing lysines by yellow arrows, and extra density in front of the hydrophobic patches by a pink arrow. (C) Cryo-EM density with the atomic model. The sharpened, high-resolution map is in blue, and an unsharpened, 4.0 Å low-pass filtered map in grey. (D) Schematic view of the snake filament. (E) Rendered view of secondary structure elements in three successive rungs. (F) As in E, but in a view perpendicular to the helical axis.
Figure 2—figure supplement 1.
Figure 2—figure supplement 1.. Fourier shell correlation curves and side views of the 3D reconstruction of 2N4R tau snake filaments.
(A) Fourier shell correlation curves between two independently refined half-maps (black, solid), of the final model versus the full map (red, solid), of a model refined in the first independent half map versus the first half map (green, solid), and of the same model versus the second independent half map, which was not used for refinement (blue, dashed) (B) Side views of the 3D reconstruction. The detailed view of the helical axis is at higher threshold to show it more clearly.
Figure 3.
Figure 3.. Cryo-EM structure of 2N4R tau twister filaments.
(A) β-strands and loop regions in the filaments are shown in different colours below the primary sequence of the microtubule-binding repeats (R1–R4). (B) Central slice of the 3D map. The position of the helical axis is indicated by a red cross, extra densities close to the outward-facing lysines by yellow arrows, and extra density in front of the hydrophobic patches by pink arrows. (C) Cryo-EM density with the atomic model. The sharpened, high-resolution map is in blue, and an unsharpened, 4.0 Å low-pass filtered map in grey. (D) Schematic view of the twister filament. (E) Rendered view of secondary structure elements in three successive rungs. (F) As in E, but in a view perpendicular to the helical axis.
Figure 3—figure supplement 1.
Figure 3—figure supplement 1.. Fourier shell correlation curves and side views of the 3D reconstruction of 2N4R tau twister filaments.
(A) Fourier shell correlation curves between two independently refined half-maps (black, solid), of the final model versus the full map (red, solid), of a model refined in the first independent half map versus the first half map (green, solid), and of the same model versus the second independent half map, which was not used for refinement (blue, dashed) (B) Side views of the 3D reconstruction. The detailed view of the helical axis is at higher threshold to show it more clearly.
Figure 4.
Figure 4.. Cryo-EM structure of 2N4R tau jagged filaments.
(A) β-strands and loop regions in the filaments are shown in different colours below the primary sequence of the microtubule-binding repeats (R1–R4). (B) Central slice of the 3D map. The position of the helical axis is indicated by a red cross, extra densities close to the outward-facing lysines by yellow arrows, and extra density in front of hydrophobic patches by a pink arrow. (C) Cryo-EM density with the atomic model. The sharpened, high-resolution map is in blue, and an unsharpened, 4.0 Å low-pass filtered map in grey. (D) Schematic view of the jagged filament. (E) Rendered view of the secondary structure elements in three successive rungs. (F) As in E, but in a view perpendicular to the helical axis.
Figure 4—figure supplement 1.
Figure 4—figure supplement 1.. Fourier shell correlation curves and side views of the 3D reconstruction of 2N4R tau jagged filaments.
(A) Fourier shell correlation curves between two independently refined half-maps (black, solid), of the final model versus the full map (red, solid), of a model refined in the first independent half map versus the first half map (green, solid), and of the same model versus the second independent half map, which was not used for refinement (blue, dashed) (B) Side views of the 3D reconstruction. The detailed view of the helical axis is at higher threshold to show it more clearly.
Figure 5.
Figure 5.. Cryo-EM structure of 2N3R tau filaments.
(A) β-strands and loop regions in the filaments are shown in different colours below the primary sequence of the microtubule-binding repeats (R1–R4). (B) Central slice of the 3D map. The position of the helical axis is indicated by a red cross, extra densities close to outward-facing lysines by yellow arrows, and extra density in front of hydrophobic patches by pink arrows. (C) Cryo-EM density with the atomic model. The sharpened, high-resolution map is in blue, an unsharpened, 4.0 Å low-pass filtered map in grey. (D) Schematic view of 2N3R tau filament. (E) Rendered view of the secondary structure elements in three successive rungs. (F) As in E, but in a view perpendicular to the helical axis.
Figure 5—figure supplement 1.
Figure 5—figure supplement 1.. Fourier shell correlation curves and side views of the 3D reconstruction of 2N3R tau filaments.
(A) Fourier shell correlation curves between two independently refined half-maps (black, solid), of the final model versus the full map (red, solid), of a model refined in the first independent half map versus the first half map (green, solid), and of the same model versus the second independent half map, which was not used for refinement (blue, dashed) (B) Side views of the 3D reconstruction. The detailed view of the helical axis is at higher threshold to show it more clearly.
Figure 6.
Figure 6.. Immuno-EM of heparin-induced 2N4R and 2N3R tau filaments.
(A) Schematic of 2N4R tau with N-terminal inserts (N1 and N2) and microtubule-binding repeats (R1, R2, R3, R4) highlighted. The epitopes of antibodies BR133 (residues 1–16), BR136 (244-257), Anti4R (275-291), BR135 (323-335), TauC4 (354–369) and BR134 (428-441) are underlined. (B) Representative immuno-EM images with antibodies BR133, BR136, Anti4R, BR135, TauC4, and BR134 of heparin-induced 2N4R and 2N3R tau filaments without (-) and with pronase (+) treatment. Scale bar, 100 nm. (C) Table summarising the results from B, and comparison with the immuno-EM results of AD and PiD. Tick marks indicate antibody decoration of filaments; crosses indicate absence of decoration. The four boxes where the human diseases differ from the in vitro heparin-induced filaments are highlighted in blue.
Figure 6—figure supplement 1.
Figure 6—figure supplement 1.. Western blots.
Western blots of recombinant 2N3R and 2N4R tau using BR133, BR136, Anti4R, BR135, TauC4 and BR134.
Figure 7.
Figure 7.. Comparison of known tau filament structures.
(A) β-strands and loop regions in the filaments are shown in different colours below the primary sequence of the microtubule-binding repeats (R1–R4). (B) Schematic representation of the different tau folds: the paired helical filament (PHF) and straight filament (SF) from Alzheimer's disease (AD); the narrow Pick filament (NPF) and wide Pick filament (WPF) from Pick's disease (PiD); the heparin-induced 2N4R snake (4 R-s), twister (4 R-t) and jagged (4 R-j); and the 2N3R heparin-induced filaments (3R). (C) Comparison of the structures of heparin-induced filaments of 2N4R and 2N3R tau with those of tau protofilaments from AD and PiD.

References

    1. Adams PD, Afonine PV, Bunkóczi G, Chen VB, Davis IW, Echols N, Headd JJ, Hung LW, Kapral GJ, Grosse-Kunstleve RW, McCoy AJ, Moriarty NW, Oeffner R, Read RJ, Richardson DC, Richardson JS, Terwilliger TC, Zwart PH. PHENIX: a comprehensive Python-based system for macromolecular structure solution. Acta Crystallographica Section D Biological Crystallography. 2010;66:213–221. doi: 10.1107/S0907444909052925. - DOI - PMC - PubMed
    1. Al-Bassam J, Ozer RS, Safer D, Halpain S, Milligan RA. MAP2 and tau bind longitudinally along the outer ridges of microtubule protofilaments. Journal of Cell Biology. 2002;157:1187–1196. doi: 10.1083/jcb.200201048. - DOI - PMC - PubMed
    1. Andronesi OC, von Bergen M, Biernat J, Seidel K, Griesinger C, Mandelkow E, Baldus M. Characterization of Alzheimer's-like paired helical filaments from the core domain of tau protein using solid-state NMR spectroscopy. Journal of the American Chemical Society. 2008;130:5922–5928. doi: 10.1021/ja7100517. - DOI - PubMed
    1. Annamalai K, Liberta F, Vielberg MT, Close W, Lilie H, Gührs KH, Schierhorn A, Koehler R, Schmidt A, Haupt C, Hegenbart U, Schönland S, Schmidt M, Groll M, Fändrich M. Common fibril structures imply systemically conserved protein misfolding pathways in vivo. Angewandte Chemie International Edition. 2017;56:7510–7514. doi: 10.1002/anie.201701761. - DOI - PubMed
    1. Arrasate M, Pérez M, Armas-Portela R, Avila J. Polymerization of tau peptides into fibrillar structures. the effect of FTDP-17 mutations. FEBS Letters. 1999;446:199–202. doi: 10.1016/S0014-5793(99)00210-0. - DOI - PubMed

Publication types

MeSH terms