. 2019 Mar 7;4(5):e126742.
doi: 10.1172/jci.insight.126742.

β Cell tone is defined by proglucagon peptides through cAMP signaling

Affiliations

β Cell tone is defined by proglucagon peptides through cAMP signaling

Megan E Capozzi et al. JCI Insight. .

Abstract

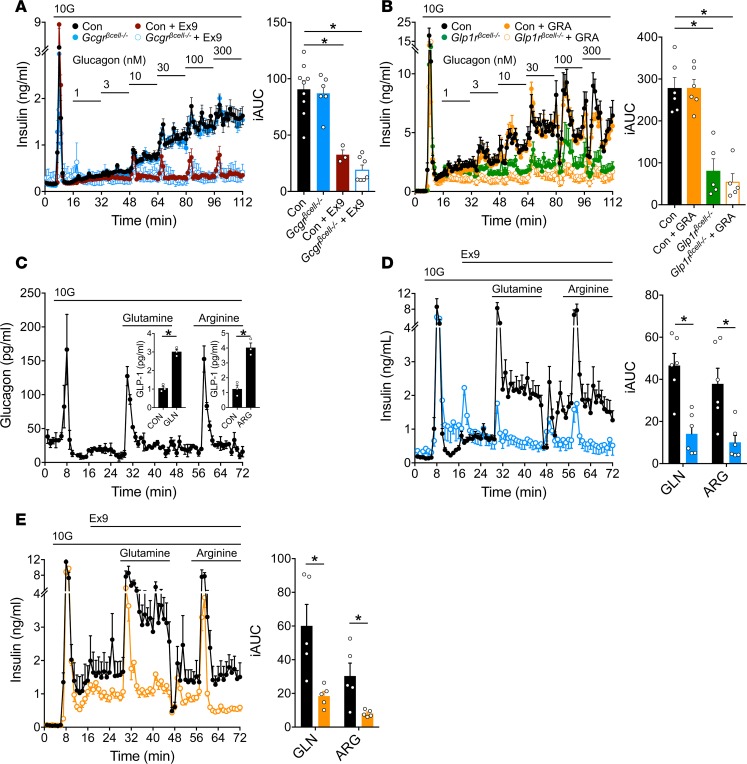
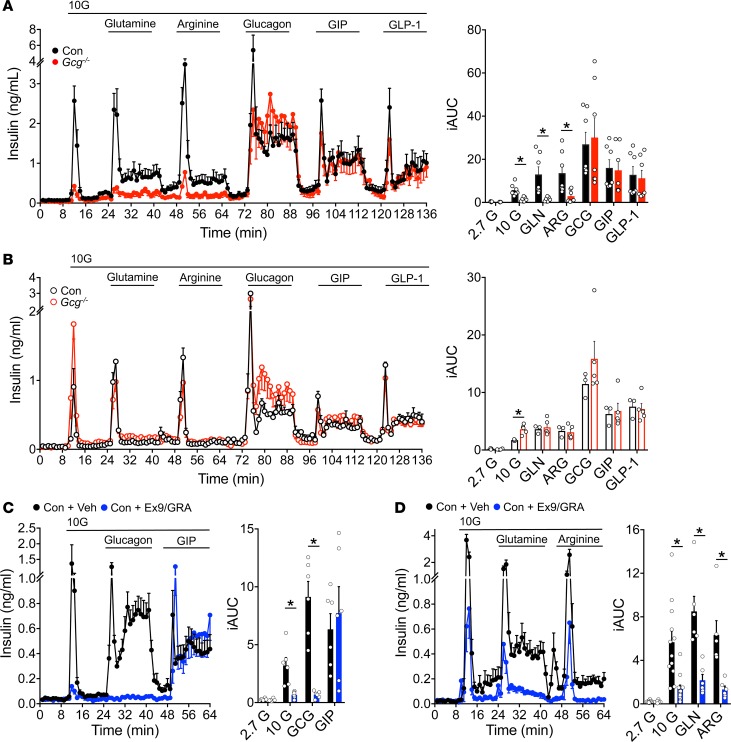
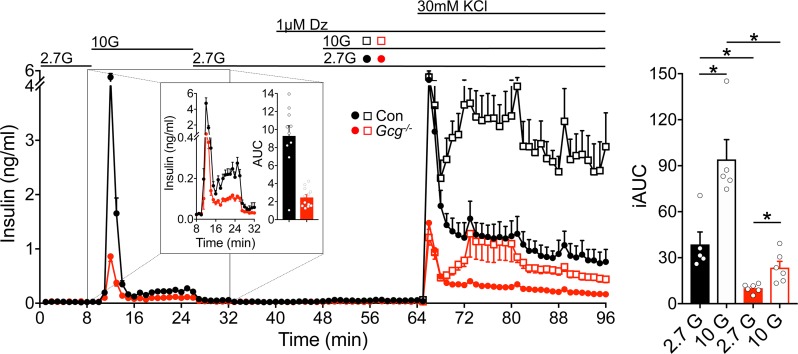
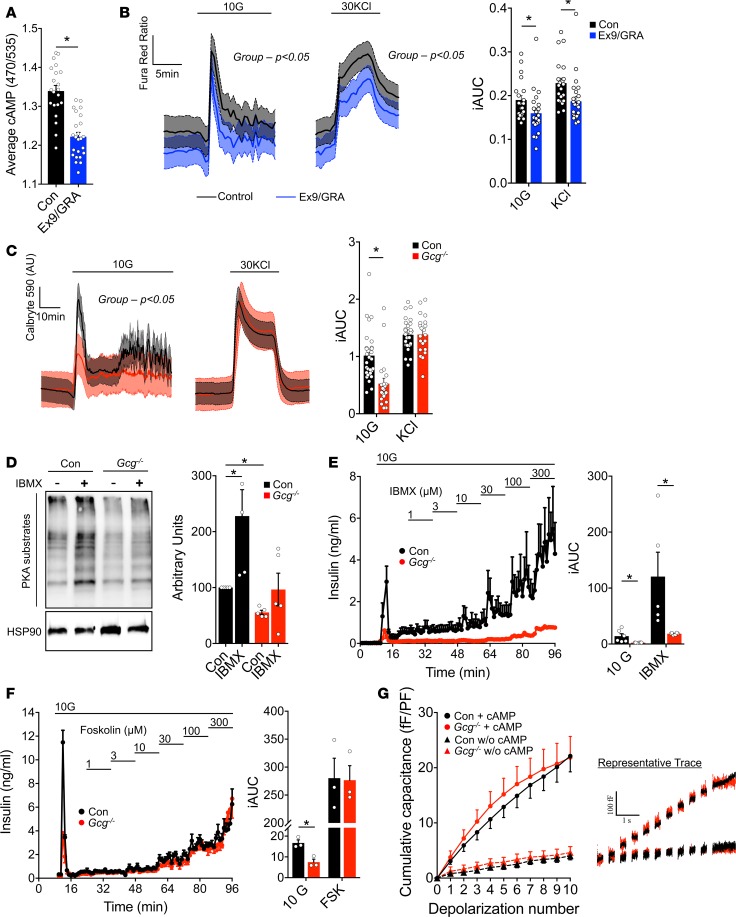
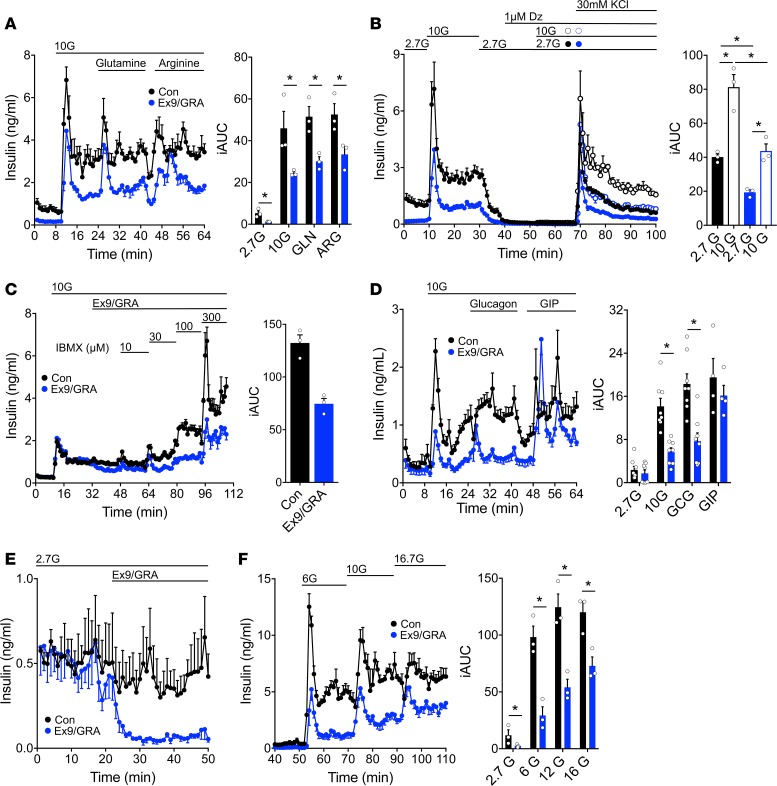
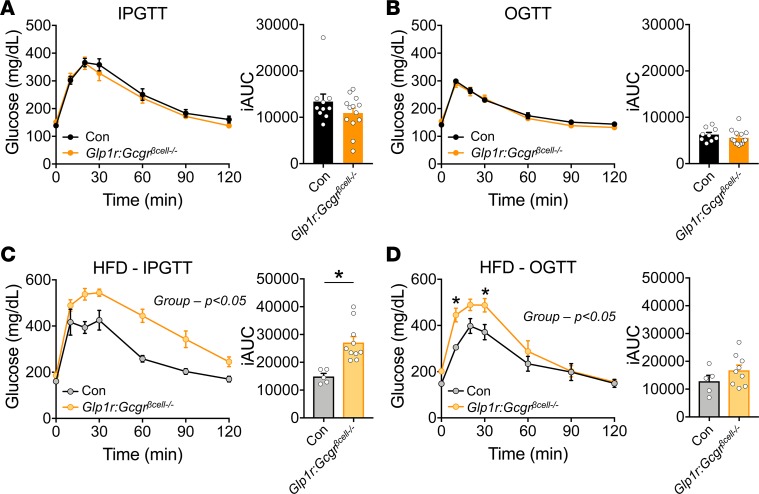
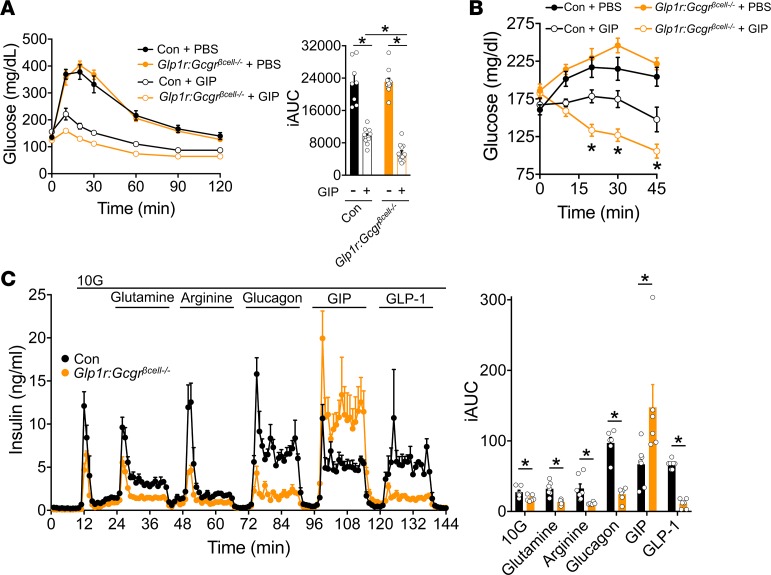
Paracrine interactions between pancreatic islet cells have been proposed as a mechanism to regulate hormone secretion and glucose homeostasis. Here, we demonstrate the importance of proglucagon-derived peptides (PGDPs) for α to β cell communication and control of insulin secretion. Signaling through this system occurs through both the glucagon-like peptide receptor (Glp1r) and glucagon receptor (Gcgr). Loss of PGDPs, or blockade of their receptors, decreases insulin secretion in response to both metabolic and nonmetabolic stimulation of mouse and human islets. This effect is due to reduced β cell cAMP and affects the quantity but not dynamics of insulin release, indicating that PGDPs dictate the magnitude of insulin output in an isolated islet. In healthy mice, additional factors that stimulate cAMP can compensate for loss of PGDP signaling; however, input from α cells is essential to maintain glucose tolerance during the metabolic stress induced by high-fat feeding. These findings demonstrate an essential role for α cell regulation of β cells, raising the possibility that abnormal paracrine signaling contributes to impaired insulin secretion in diabetes. Moreover, these findings support reconsideration of the role for α cells in postprandial glucose control.

Keywords: Endocrinology; G-protein coupled receptors; Insulin; Islet cells; Metabolism.


Conflict of interest statement

Conflict of interest: The authors have declared that no conflict of interest exists.

Figures

Figure 1
Figure 1. Proglucagon products stimulate insulin secretion through both the Glp1r and Gcgr.
(A) Insulin secretion in response to increasing doses of glucagon in control (Con; MIP-CreERT) or Gcgrβcell–/– islets with or without 1 μM exendin 9–39 (Ex9) (Con, Gcgrβcell–/–, Con + Ex9, Gcgrβcell–/– + Ex9; n = 9, 8, 3, 7). (B) Insulin secretion in response to increasing doses of glucagon from Con or Glp1rβcell–/– islets with or without 10 μg/ml GRA (Con, Con + GRA, Glp1rβcell–/–, Glp1rβcell–/– + GRA; n = 6, 6, 5, 5). (C) Glucagon and total GLP-1 secretion in response to 10 mM glutamine and 1 mM arginine (n = 3). (D) Insulin secretion in response to 10 mM glutamine and 1 mM arginine from Con or Gcgrβcell–/– islets treated with 1 μM Ex9 (n = 6). (E) Insulin secretion in response to 10 mM glutamine and 1 mM arginine from WT or Glp1rβcell–/– islets treated with 10 μg/ml GRA (n = 5). *P < 0.05. Data are shown as mean ± SEM. Data were analyzed with a 2-way ANOVA for the iAUCs (A, B, D, and E) or a 2-tailed Student’s t test (C).
Figure 2
Figure 2. Proglucagon products are necessary for nutrient-stimulated insulin secretion.
(A) Insulin secretion in response 10 mM glucose, 10 mM glutamine, 1 mM arginine, 10 nM glucagon, 3 nM GIP, and 0.3 nM GLP-1 from WT or Gcgnull islets (n = 7). (B) Insulin secretion in response 10 mM glucose, 10 mM glutamine, 1 mM arginine, 10 nM glucagon, 3 nM GIP, and 0.3 nM GLP-1 from WT + Ad-CMV-Cre (n = 3) or Gcgnull + Ad-CMV-Cre islets (n = 5). (C) Insulin secretion in response to 10 mM glucose, 10 nM glucagon, and 3 nM GIP from WT islets with or without 1 μM Ex9 and 10 μg/ml GRA (n = 6). (D) Insulin secretion in response to 10 mM glucose, 10 mM glutamine, and 1 mM arginine from WT islets with or without 1 μM Ex9 and 10 μg/ml GRA (n = 6). *P < 0.05. Data are shown as mean ± SEM. Data were analyzed by a 2-way ANOVA of the iAUCs.
Figure 3
Figure 3. Lack of proglucagon peptide input reduces insulin secretion in response to both triggering and amplification signals.
Insulin secretion in response to different concentrations of 2.7 mM glucose, 10 mM glucose, 400 μM diazoxide (Dz), or Dz with 30 mM KCl, as indicated from WT (n = 5) or Gcgnull islets (n = 6). Data are shown as mean ± SEM. Data were analyzed by a 2-way ANOVA of the iAUCs or a 2-tailed Student’s t test (inset).
Figure 4
Figure 4. Impaired proglucagon input reduces cAMP signaling in β cells.
(A) Average cAMP levels from WT islets acutely exposed to either control (n = 21) or Ex9/GRA (n = 24) conditions. (B) Cytosolic Ca2+ levels in WT islets acutely exposed to either control (n = 21) or Ex9/GRA (n = 24) conditions in response to 10 mM glucose or 30 mM KCl. (C) Cytosolic Ca2+ levels in WT (n = 30) and Gcg–/– (n = 21) islets in response to 10 mM glucose or 30 mM KCl. (D) Phosphorylation of PKA substrates and HSP90 protein levels from WT (n = 7) or Gcg–/– islets (n = 7). (E) Insulin secretion in response to increasing doses of IBMX in WT (n = 6) or Gcg–/– islets (n = 6) at 10 mM glucose. (F) Insulin secretion in response to increasing doses of FSK in WT or Gcg–/– islets (n = 3) at 10 mM glucose. (G) Cumulative capacitance from sequential depolarization in individual β cells from WT or Gcg–/– islets with or without cAMP (left) and representative trace of depolarizations (right). (Con + cAMP, Gcg–/– + cAMP, Con, Gcg–/–; n = 38, 38, 34, 37) *P < 0.05. Data are shown as mean ± SEM. Data were analyzed by a 2-way ANOVA of the iAUCs.
Figure 5
Figure 5. Proglucagon products set the tone for insulin secretion in human islets.
(A) Insulin secretion from human islets with or without 1 μM Ex9 and 10 μg/ml GRA stimulated with 10 mM glutamine or 1 mM arginine (n = 3). (B) Insulin secretion in response to different combinations of 2.7 mM glucose, 10 mM glucose, 1 μM diazoxide (Dz), or Dz with 30 mM KCl, as indicated, from human islets with or without 1 μM Ex9 and 10 μg/ml GRA (n = 3). (C) Insulin secretion in response to increasing doses of IBMX in human islets with or without 1 μM Ex9 and 10 μg/ml GRA (n = 3). (D) Insulin secretion from human islets with or without 1 μM Ex9 and 10 μg/ml GRA (n = 3) stimulated with 10 nM glucagon or 50 nM GIP. (E) Insulin secretion from human islets with or without 1 μM Ex9 and 10 μg/ml GRA (n = 3) in response to low-glucose conditions. (F) Insulin secretion from human islets in response to increasing glucose concentrations with or without 1 μM Ex9 and 10 μg/ml GRA (n = 3). *P < 0.05. Data are shown as mean ± SEM. Data were analyzed by a 2-way ANOVA of the iAUCs (A, B, D, and F) or a 2-tailed Student’s t test (C).
Figure 6
Figure 6. Loss of PGDP input into β cells combined with high-fat feeding leads to glucose intolerance.
(A) i.p. glucose tolerance (1.5 mg/kg) and iAUC of 12- to 16-week-old chow-fed control (Con; MIP-CreERT, n = 10) and Gcgr:Glp1rβcell–/– (n = 13) mice. (B) Oral glucose tolerance (1.5 mg/kg) and iAUC of 12- to 16-week-old chow-fed Con (n = 9) and Gcgr:Glp1rβcell–/– (n = 14) mice. (C) i.p. glucose tolerance (1.5 mg/kg) and iAUC of 20- to 24-week-old high-fat diet–fed (HFD-fed) Con (n = 5) and Gcgr:Glp1rβcell–/– (n = 10) mice. (D) Oral glucose tolerance (1.5 mg/kg) and iAUC of 20- to 24-week-old HFD-fed Con (n = 5) and Gcgr:Glp1rβcell–/– (n = 10) mice. *P < 0.05 vs. Con. Data are shown as mean ± SEM. Data were analyzed by a 2-way ANOVA of glycemic curves or a 2-tailed Student’s t test of the iAUCs.
Figure 7
Figure 7. Gcgr:Glp1rβcell–/– mice show an increased sensitivity to GIP in vivo and ex vivo.
(A) i.p. glucose tolerance and iAUC from control (n = 11) and Gcgr:Glp1rβcell–/– (n = 13) mice on a chow-diet treated with PBS or D-Ala-GIP (4 nmol/kg) 10 minutes before glucose (1.5 mg/kg). (B) Glycemia in ambient fed control (n = 9) and Gcgr:Glp1rβcell–/– (n = 14) mice on chow diet after i.p. injection of PBS or D-Ala-GIP (4 nmol/kg). (C) Insulin secretion in response 10 mM glucose, 10 mM glutamine, 1 mM arginine, 10 nM glucagon, 3 nM GIP, and 0.3 nM GLP-1 from control (n = 7) or Gcgr:Glp1rβcell–/– islets (n = 6). *P < 0.05. Data are shown as mean ± SEM. Data were analyzed by a 2-way ANOVA of glycemic curves (A and B) and the iAUCs (A and C).

References

    1. Prentki M, Nolan CJ. Islet beta cell failure in type 2 diabetes. J Clin Invest. 2006;116(7):1802–1812. doi: 10.1172/JCI29103. - DOI - PMC - PubMed
    1. Gromada J, Franklin I, Wollheim CB. Alpha-cells of the endocrine pancreas: 35 years of research but the enigma remains. Endocr Rev. 2007;28(1):84–116. doi: 10.1210/er.2006-0007. - DOI - PubMed
    1. Henquin JC, Dufrane D, Nenquin M. Nutrient control of insulin secretion in isolated normal human islets. Diabetes. 2006;55(12):3470–3477. doi: 10.2337/db06-0868. - DOI - PubMed
    1. Campbell JE, Drucker DJ. Pharmacology, physiology, and mechanisms of incretin hormone action. Cell Metab. 2013;17(6):819–837. doi: 10.1016/j.cmet.2013.04.008. - DOI - PubMed
    1. Kawamori D, et al. Insulin signaling in alpha cells modulates glucagon secretion in vivo. Cell Metab. 2009;9(4):350–361. doi: 10.1016/j.cmet.2009.02.007. - DOI - PMC - PubMed

Publication types