. 2019 Feb 4;20(3):673.
doi: 10.3390/ijms20030673.

Diabetes Impairs Angiogenesis and Induces Endothelial Cell Senescence by Up-Regulating Thrombospondin-CD47-Dependent Signaling

Affiliations

Diabetes Impairs Angiogenesis and Induces Endothelial Cell Senescence by Up-Regulating Thrombospondin-CD47-Dependent Signaling

Milad S Bitar. Int J Mol Sci. .

Abstract

Endothelial dysfunction, impaired angiogenesis and cellular senescence in type 2 diabetes constitute dominant risk factors for chronic non-healing wounds and other cardiovascular disorders. Studying these phenomena in the context of diabetes and the TSP1-CD-47 signaling dictated the use of the in vitro wound endothelial cultured system and an in vivo PVA sponge model of angiogenesis. Herein we report that diabetes impaired the in vivo sponge angiogenic capacity by decreasing cell proliferation, fibrovascular invasion and capillary density. In contrast, a heightened state of oxidative stress and elevated expression of TSP1 and CD47 both at the mRNA and protein levels were evident in this diabetic sponge model of wound healing. An in vitro culturing system involving wound endothelial cells confirmed the increase in ROS generation and the up-regulation of TSP1-CD47 signaling as a function of diabetes. We also provided evidence that diabetic wound endothelial cells (W-ECs) exhibited a characteristic feature that is consistent with cellular senescence. Indeed, enhanced SA-β-gal activity, cell cycle arrest, increased cell cycle inhibitors (CKIs) p53, p21 and p16 and decreased cell cycle promoters including Cyclin D1 and CDK4/6 were all demonstrated in these cells. The functional consequence of this cascade of events was illustrated by a marked reduction in diabetic endothelial cell proliferation, migration and tube formation. A genetic-based strategy in diabetic W-ECs using CD47 siRNA significantly ameliorated in these cells the excessiveness in oxidative stress, attenuation in angiogenic potential and more importantly the inhibition in cell cycle progression and its companion cellular senescence. To this end, the current data provide evidence linking the overexpression of TSP1-CD47 signaling in diabetes to a number of parameters associated with endothelial dysfunction including impaired angiogenesis, cellular senescence and a heightened state of oxidative stress. Moreover, it may also point to TSP1-CD47 as a potential therapeutic target in the treatment of the aforementioned pathologies.

Keywords: cellular senescence TSP1-CD47; diabetes; endothelial dysfunction; impaired angiogenesis; oxidative stress..


Conflict of interest statement

The author declares that they have no competing interests.

Figures

Figure 1
Figure 1
Diabetic W-ECs showed low proliferation rate, decreased survival and increased apoptosis. (A) GK rats had impaired glucose tolerance (e.g., higher AUC over 2 h) following i.p. glucose administration (2 g/kg) when compared with Wistar controls. (B) HOMA-IR-assessed by fasting plasma glucose and insulin levels was higher in GK rats, indicating insulin resistance. (C) Cell viability was determined in diabetic and control W-ECs using WST-1-based assay. (D) Rate of proliferation was quantified by measuring BrdU incorporation into W-ECs. (E) Division index of diabetic and control W-ECs was measured by CFSE dilution. (F) Trypan blue staining and HA-cDNA fragments (G) were used to detect the rate of apoptosis in both diabetic and control W-ECs. (HK) Key signaling molecules involved in cell survival, p-Akt/Akt, cell proliferation, p-ERK/ERK and cell apoptosis, p-p38/p38 were quantified using a Western blotting-based technique. Abbreviations: W-ECs, wound endothelial cells; AUC, area under the curve; HOMA-IR, homeostasis model assessment of insulin resistance; WST, 4-[3-(4-Iodophenyl)-2-(4-nitrophenyl)-2H-5-tetrazolio]-1,3-benzene Disulfonate; HA-cDNA; cytoplasmic histone-associated DNA fragments; BrdU, bromodeoxyuridine; CT, control; DB, diabetic. Values are means ± SEM (n = 6) * Significantly different from corresponding control values at p ≤ 0.05.
Figure 1
Figure 1
Diabetic W-ECs showed low proliferation rate, decreased survival and increased apoptosis. (A) GK rats had impaired glucose tolerance (e.g., higher AUC over 2 h) following i.p. glucose administration (2 g/kg) when compared with Wistar controls. (B) HOMA-IR-assessed by fasting plasma glucose and insulin levels was higher in GK rats, indicating insulin resistance. (C) Cell viability was determined in diabetic and control W-ECs using WST-1-based assay. (D) Rate of proliferation was quantified by measuring BrdU incorporation into W-ECs. (E) Division index of diabetic and control W-ECs was measured by CFSE dilution. (F) Trypan blue staining and HA-cDNA fragments (G) were used to detect the rate of apoptosis in both diabetic and control W-ECs. (HK) Key signaling molecules involved in cell survival, p-Akt/Akt, cell proliferation, p-ERK/ERK and cell apoptosis, p-p38/p38 were quantified using a Western blotting-based technique. Abbreviations: W-ECs, wound endothelial cells; AUC, area under the curve; HOMA-IR, homeostasis model assessment of insulin resistance; WST, 4-[3-(4-Iodophenyl)-2-(4-nitrophenyl)-2H-5-tetrazolio]-1,3-benzene Disulfonate; HA-cDNA; cytoplasmic histone-associated DNA fragments; BrdU, bromodeoxyuridine; CT, control; DB, diabetic. Values are means ± SEM (n = 6) * Significantly different from corresponding control values at p ≤ 0.05.
Figure 2
Figure 2
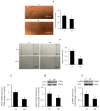
Diabetes suppresses angiogenic capacity in W-ECs. (A) Photomicrographs of tube formation of W-ECs that were seeded on growth factor-reduced Matrigel; accompanied by a barograph figure denoting the quantitative measure of the branching point number. (B) Photomicrographs of cell migration (e.g., scratch of cells with a pipette tip) followed by light microscope-based measurement of the distance of wound covered by cells; accompanied by a barograph figure indicating the quantitative measure of migration speed expressed as percent of closure. (C,D) VEGF expression in terms of mRNA and protein levels was measured using qRT-PCR and Western blotting-based techniques. (E) p-eNOS, a measure of eNOS activity, was determined by Western blotting. Abbreviation: W-EC, wound endothelial cells; VEGF, vascular endothelial growth factor; p-eNOS, phospho-endothelial nitric oxide synthase; CT, control; DB, diabetic. Values are means ± SEM (n = 6) * Significantly different from corresponding control values at p ≤ 0.05.
Figure 3
Figure 3
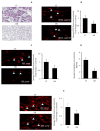
Diabetes suppresses angiogenic capacity in PVA sponge model of wound healing. (A) Representative photomicrographs of H&E stained sponge sections revealing fibrovascular invasion with the arrows denoting blood vessels containing red blood cells; magnification for CT is 60 µm and for DB is 200 µm. (B) Representative photomicrographs of VEGF immunofluorescence staining, accompanied by a barograph figure denoting the quantitative measure of VEGF fluorescence intensity. (C) Representative photomicrographs of CD 31 immunofluorescence staining, an indicator of microvascular density, accompanied by a barograph figure denoting the quantitative measure of CD 31 fluorescence intensity. (D) Hemoglobin contents in the sponges as determined by the Drabkin reagent. (E) Representative photomicrographs of PCNA immunofluorescence staining, an indicator of cell proliferation, accompanied by a barograph figure denoting the quantitative measure of PCNA fluorescence intensity. Abbreviation: PCNA, Proliferating Cell Nuclear Antigen, VEGF, vascular endothelial growth factor; CT, control; DB, diabetic. Values are means ± SEM (n = 6) * Significantly different from corresponding control values at p ≤ 0.05.
Figure 4
Figure 4
Diabetic W-ECs exhibited a characteristic feature consistent with cellular senescence and cell-cycle arrest. (A) Representative images of SA-β-gal staining (left; senescent cells stained with green); accompanied by a barograph figure denoting senescent cells as fold change vs. control. (B) mRNA levels of IGFBP5, PAI-1 and TNF-α quantified by qRT-PCR and expressed as a fold change vs. control. (C) IL-6 and IL-8 (D) in cultured medium of control and diabetic W-ECs quantified by ELISA and expressed as pg/mL. (E) Percentage of cells at the S phase measured using flow cytometry and cell cycle PI-based staining. Relative mRNA expression in control and diabetic W-ECs for cell cycle inhibitors (p53, p21, p16, (F)), cell cycle promoters (CDK4, CDK6, cyclin D1, (G)) and S-phase gene transcription (Ki67, CDK1, CDk2, (H)) expressed as a fold change vs. control. Abbreviation: TNF-α, tumor necrosis factor-alpha; IGFBP5, insulin-like growth factor binding protein5; PAI-1, prothrombotic-1; IL-6, interleukin-6; IL-8, interleukin-8, propodium iodide, CDK, cyclin dependent kinase; W-ECs, wound endothelial cells, CT, control; DB, diabetic. Values are means ± SEM (n = 6) * Significantly different from corresponding control values at p ≤ 0.05.
Figure 4
Figure 4
Diabetic W-ECs exhibited a characteristic feature consistent with cellular senescence and cell-cycle arrest. (A) Representative images of SA-β-gal staining (left; senescent cells stained with green); accompanied by a barograph figure denoting senescent cells as fold change vs. control. (B) mRNA levels of IGFBP5, PAI-1 and TNF-α quantified by qRT-PCR and expressed as a fold change vs. control. (C) IL-6 and IL-8 (D) in cultured medium of control and diabetic W-ECs quantified by ELISA and expressed as pg/mL. (E) Percentage of cells at the S phase measured using flow cytometry and cell cycle PI-based staining. Relative mRNA expression in control and diabetic W-ECs for cell cycle inhibitors (p53, p21, p16, (F)), cell cycle promoters (CDK4, CDK6, cyclin D1, (G)) and S-phase gene transcription (Ki67, CDK1, CDk2, (H)) expressed as a fold change vs. control. Abbreviation: TNF-α, tumor necrosis factor-alpha; IGFBP5, insulin-like growth factor binding protein5; PAI-1, prothrombotic-1; IL-6, interleukin-6; IL-8, interleukin-8, propodium iodide, CDK, cyclin dependent kinase; W-ECs, wound endothelial cells, CT, control; DB, diabetic. Values are means ± SEM (n = 6) * Significantly different from corresponding control values at p ≤ 0.05.
Figure 5
Figure 5
Diabetes induces a heightened state of oxidative stress in cultured W-ECs and in PVA sponge model of wound healing. Representative fluorescence images of DHE staining in W-ECs (A) and in PVA sponge model of angiogenesis (B); accompanied by a barograph figure denoting DHE staining as fold change vs. control. (C,D) NADPH oxidase activity in a membrane fraction of W-ECs was assessed using the lucigenin chemiluminescence- or the Amplex red/horseradish peroxidase fluorescence-based assay. (E) Nox1 mRNA expression in W-ECs and PVA sponge model of wound healing was determined using qRT-PCR-based assay. Abbreviation: DHE, dihydroethidium; SOD, superoxide dismutase; W-ECs, wound endothelial cells, CT, control; DB, diabetic. Values are means ± SEM (n = 6) * Significantly different from corresponding control values at p ≤ 0.05.
Figure 6
Figure 6
Diabetes up-regulates TSP1-CD47-dependent signaling in both W-ECs and in PVA sponge model of wound healing. (AC) mRNA and protein levels of TSP1 and CD47 were assessed in control and diabetic W-ECs using qRT-PCR and Western blotting-based technique. (D) Rate of TSP1 production in cultured W-ECs was quantified using ELISA-based assay. Representative photomicrographs of TSP-1 (E) or CD47 (F) immunofluorescence staining, accompanied by a barograph figure denoting the quantitative measure of TSP-1 (E) or CD47 (F) fluorescence intensity. (G) mRNA expression of TSP-1 and CD47 in sponge model of wound healing was measured using qRT-PCR. Abbreviation: TSP1, thrombospondin-1 W-ECs, wound endothelial cells, CT, control; DB, diabetic. Values are means ± SEM (n = 6) * Significantly different from corresponding control values at p ≤ 0.05.
Figure 6
Figure 6
Diabetes up-regulates TSP1-CD47-dependent signaling in both W-ECs and in PVA sponge model of wound healing. (AC) mRNA and protein levels of TSP1 and CD47 were assessed in control and diabetic W-ECs using qRT-PCR and Western blotting-based technique. (D) Rate of TSP1 production in cultured W-ECs was quantified using ELISA-based assay. Representative photomicrographs of TSP-1 (E) or CD47 (F) immunofluorescence staining, accompanied by a barograph figure denoting the quantitative measure of TSP-1 (E) or CD47 (F) fluorescence intensity. (G) mRNA expression of TSP-1 and CD47 in sponge model of wound healing was measured using qRT-PCR. Abbreviation: TSP1, thrombospondin-1 W-ECs, wound endothelial cells, CT, control; DB, diabetic. Values are means ± SEM (n = 6) * Significantly different from corresponding control values at p ≤ 0.05.
Figure 7
Figure 7
Diabetes impairs angiogenesis and induces endothelial cell senescence/oxidative stress by up-regulating TSP1-CD47-depndent signaling. Angiogenic capacity as reflected by cell proliferation (A), cell migration (B) and tube formation (C) was measured in cultured diabetic W-ECs harboring either CD47-siRNA or its corresponding scrambled siRNA. (D) Senescence as reflected by SA-β-gal activity was determined in in cultured W-ECs harboring either CD47-siRNA or its corresponding scrambled siRNA. Cell cycle regulators including CKIs (E); p53, p21, p16), cell cycle promoters (F); Ki67, CDK1, CDK2) and S-phase gene transcription (G); CDK4, CDK6, Cyclin D1) were quantified in cultured W-ECs harboring either CD47-siRNA or its corresponding scrambled siRNA using qRT-PCR-based assay. Oxidative stress, as reflected by Nox1 mRNA expression (H) or NADPH oxidase activity (I) was quantified in cultured W-ECs harboring either CD47-siRNA or its corresponding scrambled siRNA using qRT-PCR-based assay (e.g., Nox1 mRNA) or the 100,000× g cell fraction and the fluorescence probe Amplex red (NADPH oxidase activity). Abbreviation: W-ECs, wound endothelial cells; CKIs, cell cycle inhibitors, CK, cyclin-depend kinase; CT control; DB, diabetic; Si-CD47, diabetic wound endothelial cells-treated with CD47-siRNA. Values are means ± SEM (n = 6) * Significantly different from corresponding control values at p ≤ 0.05. ** Significantly different from corresponding diabetic control receiving scrambled siRNA at p ≤ 0.05.

References

    1. Palmer A.K., Tchkonia T., LeBrasseur N.K., Chini E.N., Xu M., Kirkland J.L. Cellular Senescence in Type 2 Diabetes: A Therapeutic Opportunity. Diabetes. 2015;64:2289–2298. doi: 10.2337/db14-1820. - DOI - PMC - PubMed
    1. Beckman J.A., Creager M.A., Libby P. Diabetes and atherosclerosis: Epidemiology, pathophysiology, and management. Jama. 2002;287:2570–2581. doi: 10.1001/jama.287.19.2570. - DOI - PubMed
    1. Brem H., Tomic-Canic M. Cellular and molecular basis of wound healing in diabetes. J. Clin. Investig. 2007;117:1219–1222. doi: 10.1172/JCI32169. - DOI - PMC - PubMed
    1. Kannel W.B., McGee D.L. Diabetes and glucose tolerance as risk factors for cardiovascular disease: The Framingham study. Diabetes Care. 1979;2:120–126. doi: 10.2337/diacare.2.2.120. - DOI - PubMed
    1. Jeffcoate W.J., Harding K.G. Diabetic foot ulcers. Lancet. 2003;361:1545–1551. doi: 10.1016/S0140-6736(03)13169-8. - DOI - PubMed

MeSH terms