. 2019 Mar 7;4(5):e124989.
doi: 10.1172/jci.insight.124989.

Tumor cell oxidative metabolism as a barrier to PD-1 blockade immunotherapy in melanoma

Affiliations

Tumor cell oxidative metabolism as a barrier to PD-1 blockade immunotherapy in melanoma

Yana G Najjar et al. JCI Insight. .

Abstract

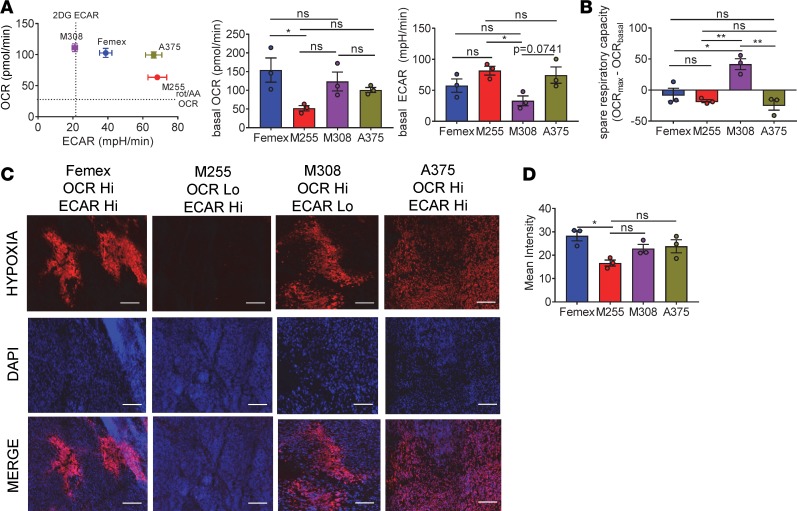
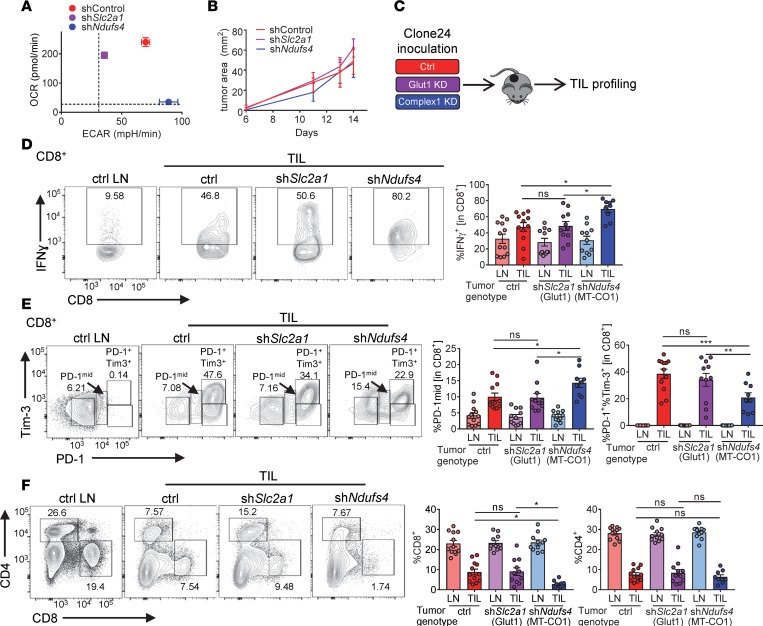
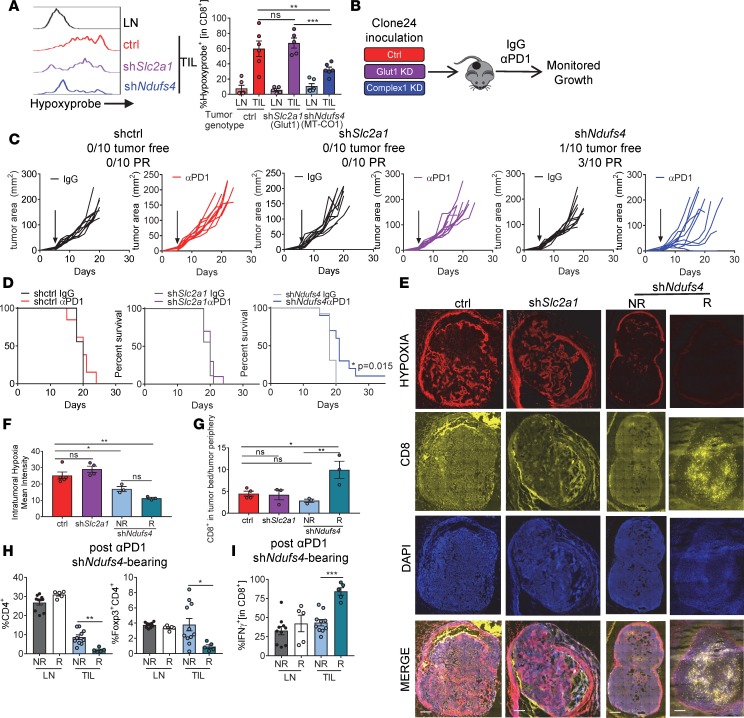
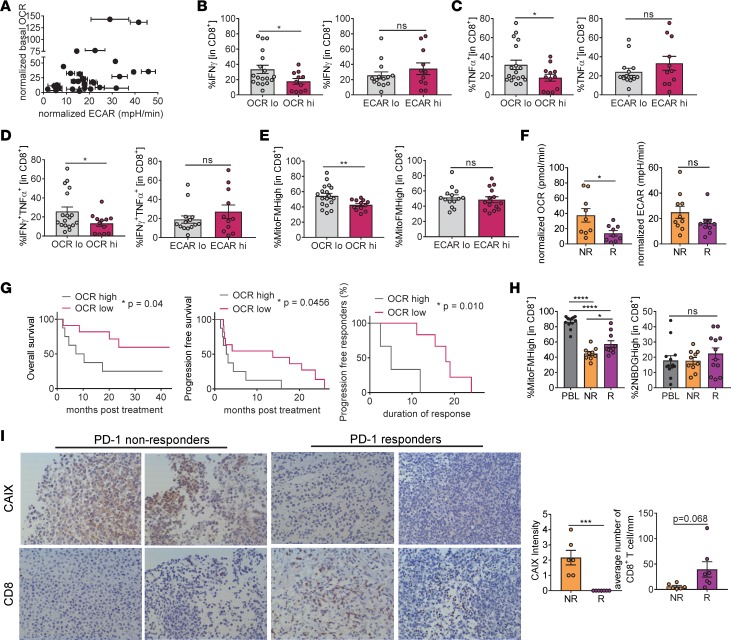
The tumor microenvironment presents physical, immunologic, and metabolic barriers to durable immunotherapy responses. We have recently described roles for both T cell metabolic insufficiency as well as tumor hypoxia as inhibitory mechanisms that prevent T cell activity in murine tumors, but whether intratumoral T cell activity or response to immunotherapy varies between patients as a function of distinct metabolic profiles in tumor cells remains unclear. Here, we show that metabolic derangement can vary widely in both degree and type in patient-derived cell lines and in ex vivo analysis of patient samples, such that some cells demonstrate solely deregulated oxidative or glycolytic metabolism. Further, deregulated oxidative, but not glycolytic, metabolism was associated with increased generation of hypoxia upon implantation into immunodeficient animals. Generation of murine single-cell melanoma cell lines that lacked either oxidative or glycolytic metabolism showed that elevated tumor oxygen consumption was associated with increased T cell exhaustion and decreased immune activity. Moreover, melanoma lines lacking oxidative metabolism were solely responsive to anti-PD-1 therapy among those tested. Prospective analysis of patient sample immunotherapy revealed that oxidative, but not glycolytic, metabolism was associated with progression on PD-1 blockade. Our data highlight a role for oxygen as a crucial metabolite required for the tumor-infiltrating T cells to differentiate appropriately upon PD-1 blockade, and suggest that tumor oxidative metabolism may be a target to improve immunotherapeutic response.

Keywords: Cancer immunotherapy; Glucose metabolism; Immunology; T cells.


Conflict of interest statement

Conflict of interest: The authors declare that no conflict of interest exists.

Figures

Figure 1
Figure 1. Melanoma cell lines are metabolically heterogeneous and produce various degrees of hypoxia in vivo.
(A) Representative OCR versus ECAR of human melanoma cell lines (left) and tabulated baseline OCR and ECAR (right) from multiple experiments. (B) Tabulated respiratory capacity (maximal, uncoupled respiration by FCCP stimulation) from cells as in A. (C) Pimonidazole staining of full tumor sections from NSG mice bearing human melanoma cell line tumors measuring 5 mm across. Scale bars: 100 μm. (D) Tabulated results of the internal hypoxyprobe intensity from set brightness normalized for each day of imaging. Data represent 3 independent experiments. *P < 0.05, **P < 0.01 by 1-way ANOVA. ns, not significant. Error bars indicate SEM.
Figure 2
Figure 2. Oxidative metabolism in tumor cells promotes increased T cell dysfunction.
(A) Representative OCR versus ECAR of clone 24 melanoma cells transfected with scrambled control, Slc2a1 (Glut1), or Ndufs4 (complex I) shRNA. (B) Tumor growth curves of C57BL/6J inoculated with 250,000 of clone 24 melanoma cells as in A intradermally. (C) Schematic of TIL profiling from mice bearing clone 24 tumors. (D) Representative flow cytogram (left) and tabulated data from multiple experiments (right) of PMA- and ionomycin-induced IFN-γ from CD8+ T cells from clone 24–bearing mice. LN, lymph node; TIL, tumor-infiltrating lymphocyte (n = 12 per group). (E) Representative flow cytogram (left) and tabulated data from multiple experiments (right) of PD-1 and Tim-3 expression as in D. (F) Representative flow cytogram (left) and tabulated data from multiple experiments (right) of CD4+ and CD8+ T cells as in D. Data represent 5 independent experiments. *P < 0.05, **P < 0.01, ***P < 0.001 by 2-way ANOVA (A) or 1-way ANOVA (CE). ns, not significant. Error bars indicate SEM.
Figure 3
Figure 3. Inhibiting oxidative metabolism in tumor cells reduces intratumoral hypoxia and increases sensitivity to PD-1 blockade therapy.
(A) Representative pimonidazole staining and tabulated data from multiple experiments of CD8+ T cells isolated from clone 24 knockdown tumors (n = 6 per group). (B) Schematic of C57BL/6J mouse inoculated with 250,000 of clone 24 knockdown cells intradermally, and then treated with 200 μg anti–PD-1 or isotype controls thrice weekly when tumors reached 1–3 mm. (C) Tumor growth from mice treated as in B. Tumor-free indicates a complete regression. PR indicates mice that showed tumor regression for at least 2 measurements. Each line represents 1 animal. (D) Survival curve of mice treated as in B. (E) Pimonidazole, CD8, and DAPI staining of full tumor sections from mice bearing clone 24 knockdown tumors (left). Scale bars: 500 μm. (F) Tabulated results of the internal hypoxyprobe intensity from a set brightness normalized for each day of imaging (n = 4 per group). (G) Ratio of T cell counts in tumor bed versus periphery of tumor (n = 4 per group). (H) Tabulated flow cytometry data from multiple experiments of CD4+ and CD4+Foxp3+ T cells from clone 24 Ndufs4–knockdown mice treated with 200 μg anti–PD-1 (n = 5–10 per group). (I) Tabulated flow cytometry data from multiple experiments of IFN-γ in CD8+ T cells from mice as in H. Data represent 3 independent experiments. *P < 0.05, **P < 0.01, ***P < 0.001 by 1-way ANOVA (AC and FI) or log-rank test (D). ns, not significant. Error bars indicate SEM.
Figure 4
Figure 4. Oxidative metabolism of tumor cells and hypoxia are associated with decreased antitumor immunity and poor clinical response to PD-1 blockade therapy in patients.
(A) Normalized OCR versus normalized ECAR of isolated tumor cells from melanoma patient biopsies. Values normalized based on rotenone/antimycin A for OCR and 2DG for ECAR (n = 30). (B) Tabulated flow cytometry data of IFN-γ production from CD8+ T cells isolated as in A as a function of high OCR or ECAR. (C) Tabulated flow cytometry data of TNF-α from CD8+ T cells as in B. (D) Tabulated flow cytometry data of IFN-γ and TNF-α from CD8+ T cells as in B. (E) Tabulated flow cytometry data of MitoTracker FM from CD8+ T cells as in B. (F) Tabulated normalized OCR and tabulated normalized ECAR of isolated tumor cells from melanoma patients that progressed on (NR, nonresponder) or responded to (R, responder defined as stable disease, partial or complete response) (n = 19). (G) Overall survival, progression-free survival, and duration of response of patients treated with either pembrolizumab or nivolumab monotherapy based on tumor cell oxidative metabolism. (H) Representative flow cytogram (left) and tabulated data from multiple experiments (right) of MitoTracker FM and 2NBDG of CD8+ T cells from patients as in F. (I) Representative immunohistochemistry at ×20 magnification (left) and tabulated CAIX scoring and CD8+ T cell numbers of FFPE sections from patients as in F. *P < 0.05, **P < 0.01, ***P < 0.001, ****P < 0.001 by unpaired t test (BF, H, and I) or Wilcoxon’s test (G). ns, not significant. Error bars indicate SEM.

References

    1. Ribas A, Wolchok JD. Cancer immunotherapy using checkpoint blockade. Science. 2018;359(6382):1350–1355. doi: 10.1126/science.aar4060. - DOI - PMC - PubMed
    1. Rozeman EA, Dekker TJA, Haanen JBAG, Blank CU. Advanced melanoma: current treatment options, biomarkers, and future perspectives. Am J Clin Dermatol. 2018;19(3):303–317. doi: 10.1007/s40257-017-0325-6. - DOI - PubMed
    1. Patel SP, Kurzrock R. PD-L1 expression as a predictive biomarker in cancer immunotherapy. Mol Cancer Ther. 2015;14(4):847–856. doi: 10.1158/1535-7163.MCT-14-0983. - DOI - PubMed
    1. Munn DH, Bronte V. Immune suppressive mechanisms in the tumor microenvironment. Curr Opin Immunol. 2016;39:1–6. doi: 10.1016/j.coi.2015.10.009. - DOI - PMC - PubMed
    1. Wegiel B, Vuerich M, Daneshmandi S, Seth P. Metabolic switch in the tumor microenvironment determines immune responses to anti-cancer therapy. Front Oncol. 2018;8:284. - PMC - PubMed

Publication types

MeSH terms