. 2019 Mar 4;129(4):1641-1653.
doi: 10.1172/JCI123049.

RABL6A inhibits tumor-suppressive PP2A/AKT signaling to drive pancreatic neuroendocrine tumor growth

Affiliations

RABL6A inhibits tumor-suppressive PP2A/AKT signaling to drive pancreatic neuroendocrine tumor growth

Shaikamjad Umesalma et al. J Clin Invest. .

Abstract

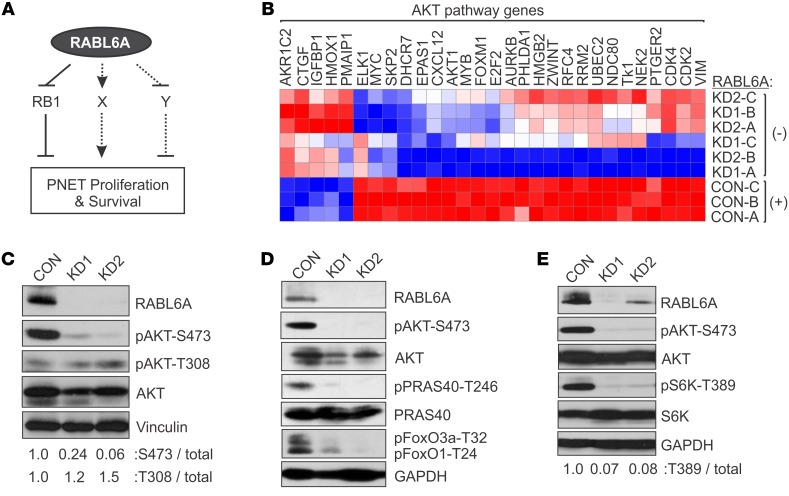
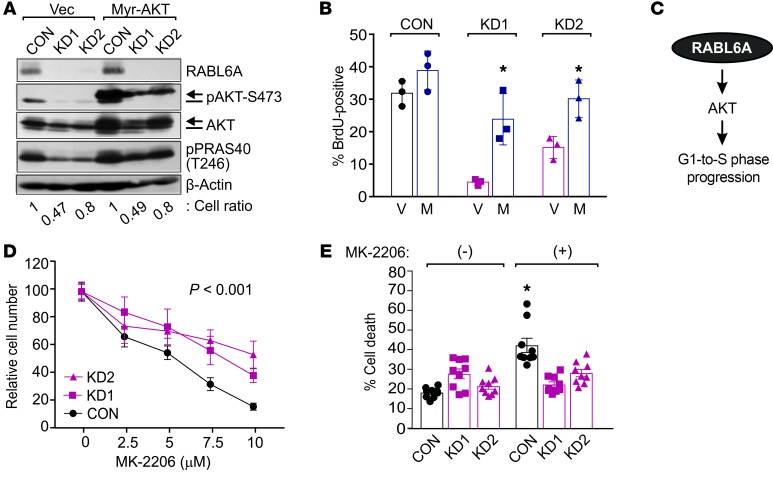
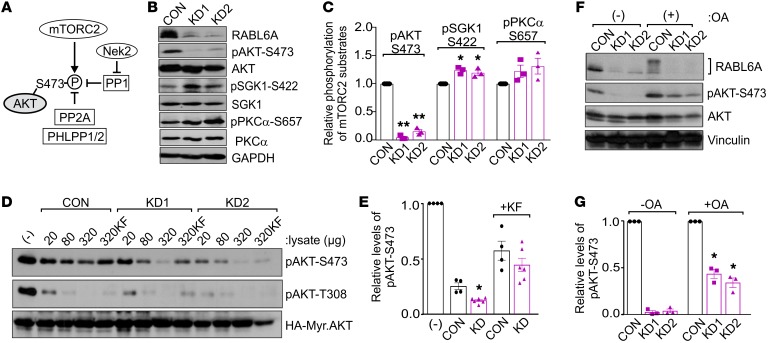
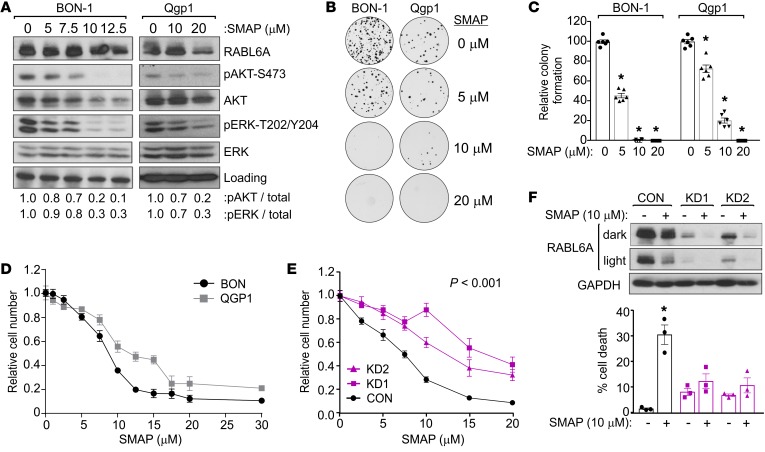
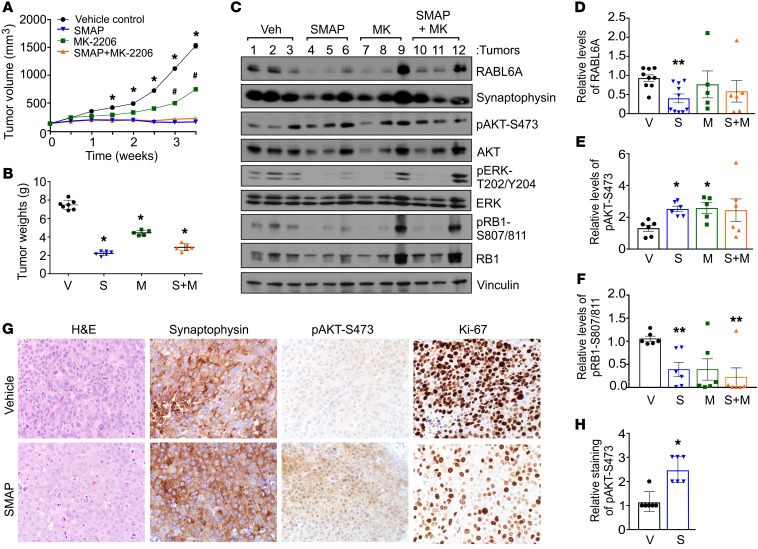
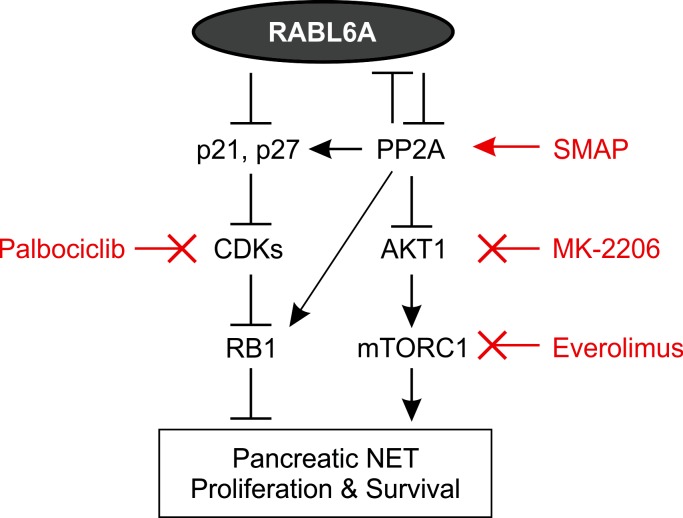
Hyperactivated AKT/mTOR signaling is a hallmark of pancreatic neuroendocrine tumors (PNETs). Drugs targeting this pathway are used clinically, but tumor resistance invariably develops. A better understanding of factors regulating AKT/mTOR signaling and PNET pathogenesis is needed to improve current therapies. We discovered that RABL6A, a new oncogenic driver of PNET proliferation, is required for AKT activity. Silencing RABL6A caused PNET cell-cycle arrest that coincided with selective loss of AKT-S473 (not T308) phosphorylation and AKT/mTOR inactivation. Restoration of AKT phosphorylation rescued the G1 phase block triggered by RABL6A silencing. Mechanistically, loss of AKT-S473 phosphorylation in RABL6A-depleted cells was the result of increased protein phosphatase 2A (PP2A) activity. Inhibition of PP2A restored phosphorylation of AKT-S473 in RABL6A-depleted cells, whereas PP2A reactivation using a specific small-molecule activator of PP2A (SMAP) abolished that phosphorylation. Moreover, SMAP treatment effectively killed PNET cells in a RABL6A-dependent manner and suppressed PNET growth in vivo. The present work identifies RABL6A as a new inhibitor of the PP2A tumor suppressor and an essential activator of AKT in PNET cells. Our findings offer what we believe is a novel strategy of PP2A reactivation for treatment of PNETs as well as other human cancers driven by RABL6A overexpression and PP2A inactivation.

Keywords: Cancer; Cell Biology; Drug therapy; Oncology; Phosphoprotein phosphatases.


Conflict of interest statement

Conflict of interest: The Icahn School of Medicine has filed patents covering composition of matter on the small molecules disclosed herein for the treatment of human cancer and other diseases and for methods of use for using these small-molecule PP2A activators (patent no. 9,937,186 B2). RAPPTA Therapeutics LLC has optioned this intellectual property for the clinical and commercial development of this series of small-molecule PP2A activators. GN has an ownership interest in RAPPTA Therapeutics LLC.

Figures

Figure 1
Figure 1. RABL6A depletion impairs AKT-S473 phosphorylation and AKT-mTOR signaling in PNETs.
(A) Schematic showing that RABL6A promotes PNET cell proliferation and survival through multiple mechanisms, including inhibition of RB1 signaling as well as regulation of other undefined (X, Y) pathways. Arrow, activating event; perpendicular bar, inhibitory event. (B) BON-1 cells expressing vector control (CON: with RABL6A) or shRNAs targeting RABL6A (KD1 and KD2: without RABL6A) were examined by microarray analyses. Heat map shows that RABL6A depletion significantly alters the expression of genes involved in AKT signaling; data from 3 experiments, designated A–C. Genes were categorized by IPA software and displayed 2-fold or greater changes in expression (P < 0.05). Red, relatively increased expression; blue, relatively decreased expression. (C) Representative Western blots showing that RABL6A knockdown (KD1, KD2) in BON-1 cells specifically reduces the activating phosphorylation of AKT at S473, not T308. Vinculin served as loading control. Relative phosphorylation of each residue relative to total AKT was quantified by ImageJ. (D) Representative Western blots showing that inactivation of AKT in RABL6A knockdown BON-1 cells coincides with reduced phosphorylation of AKT substrates, PRAS40-T246 and FoxO1-T24/FoxO3a-T32, with GAPDH as loading control. (E) Representative Western blots showing that inactivation of AKT in RABL6A knockdown BON-1 cells coincides with reduced activation of mTORC1, as measured by decreased S6K phosphorylation at T389. GAPDH was the loading control. S6K-T389 phosphorylation relative to total S6K was quantified by ImageJ. Experiments in CE represent at least 3 independent experimental repeats.
Figure 2
Figure 2. RABL6A-AKT signaling is required for PNET cell cycle progression and response to AKT inhibitors.
(A) BON-1 cells expressing vector (Vec) or constitutively activated myristoylated AKT (Myr-AKT) were infected with control (CON) or RABL6A shRNAs (KD1, KD2). Representative Western blots of phosphorylated AKT-S473 detect endogenous AKT (bar, lower band) and Myr-AKT (arrow, upper band only in lanes 4-6). Heightened activity of Myr-AKT was assessed by levels of PRAS40-T246 phosphorylation. β-actin served as the loading control. Cell ratios (i.e., relative cell numbers normalized to CON cells) are indicated for each sample. (B) The percentage of BrdU-positive cells was quantified in BON-1 control and RABL6A knockdown cells expressing vector (V) versus Myr-AKT (M). Data were quantified from 3 independent experiments; *P < 0.02 for V versus M comparison, 2-way ANOVA. (C) Schematic of RABL6A promoting G1-to-S phase progression and PNET cell proliferation by activating AKT signaling. (D) Dose response curves, shown as relative cell number, in BON-1 control and RABL6A knockdown cells treated for 5 days with increasing concentrations of the AKT inhibitor, MK-2206. Data represent the mean ± SEM for triplicate samples from 3 separate experiments, in which results were normalized to values for untreated cells within each group. *P < 0.001 for KD1 or KD2 compared with CON, 2-way ANOVA and adjusted for multiple comparisons using the Bonferroni method. Overall differences between the curves were assessed by generalized linear regressions. (E) Percentage of cell death in BON-1 control and RABL6A knockdown cells following treatment with MK-2206 (10 μM) for 3 days. Data represent the mean ± SEM from 3 independent experiments. *P < 0.001 for (+) versus (–) comparison, 2-way ANOVA and adjusted for multiple comparisons using the Bonferroni method.
Figure 3
Figure 3. RABL6A increases AKT-S473 phosphorylation through inhibition of PP2A.
(A) Schematic of the kinases and phosphatases that regulate AKT-S473 phosphorylation. P, phosphorylation; arrows, activating events; perpendicular bars, inhibiting events. (B) Western blots of BON-1 control (CON) and RABL6A knockdown (KD1 and KD2) cells showing selective loss of pAKT-S473 in RABL6A-depleted cells versus moderately increased phosphorylation of other mTORC2 substrates, SGK1 and PKCα. GAPDH was the loading control. (C) Relative phosphorylation of mTORC2 substrates in BON-1 CON, KD1, and KD2 cells was quantified by ImageJ. Data represent the mean ± SD from 3 independent experiments (*P < 0.05 and **P < 0.001 compared with CON, 2-way ANOVA and adjusted for multiple comparisons using the Bonferroni method). (D) Western blots of pAKT-S473 and pAKT-T308 following in vitro phosphatase assays using phosphorylated HA-tagged Myr-AKT as substrate to which the indicated amounts (μg) of BON-1 CON, KD1, or KD2 lysates were added. As controls, buffer (–) or the general phosphatase inhibitor potassium fluoride (KF), was added to substrate prior to the phosphatase reaction. (E) Relative levels of pAKT-S473, normalized to total HA-Myr-Akt, were quantified by ImageJ analysis of blots from 3 or more experiments in which 320 μg cell lysate was tested. *P < 0.005 KD (KD1 and KD2) versus CON, 2-way ANOVA adjusted for multiple comparisons using the Bonferroni test. (F) Western blots of pAKT-S473, AKT, and RABL6A following okadaic acid (OA) treatment (100 nM, 20 hours) in BON-1 CON and KD cells showing significant restoration of pAKT-S473 by PP2A inhibition. Vinculin was loading control. (G) Relative phosphorylation of AKT-S473 was quantified from 3 experiments. *P < 0.005 compared with untreated counterparts, 2-way ANOVA adjusted for multiple comparisons using the Bonferroni method. Western blots in B, D, and F are representative of 3 or more experiments.
Figure 4
Figure 4. PP2A reactivation with SMAP reduces AKT-S473 phosphorylation, downregulates RABL6A, and induces PNET cell death in a RABL6A-dependent manner.
(A) Western blots (repeated 3 or more times) of lysates from BON-1 and Qgp1 cells treated 20 hours with SMAP showing effective reduction of pAKT-S473 and pERK-T202/Y204. Loading, vinculin (BON-1), and GAPDH (Qgp1). (B) Representative images from clonogenic assays of BON-1 and Qgp1 cells treated with 0 (vehicle), 5, 10, or 20 μM SMAP for 3 weeks. (C) Quantification of clonogenic assay results, normalized to 100% for vehicle-treated control cells, from 2 separate experiments performed in triplicate. *P < 0.001, 2-way ANOVA and adjusted for multiple comparisons using the Bonferroni method. Identical results were obtained in 4 additional repeats per cell line for cells plated at different densities. (D) Representative experiment (repeated twice) showing dose response curves for BON-1 and Qgp1 cells following exposure for 3 days to indicated concentrations of SMAP. Data represent the mean ± SD for triplicate samples and were normalized to values from untreated cells. (E) Relative cell number (assayed by Cell-Quant) of BON-1 cells expressing CON, KD1, or KD2 shRNAs after exposure for 3 days to increasing concentrations of SMAP. Data (from 3 experiments done in triplicate) were normalized to untreated controls. *P < 0.001 for KD1 and KD2 compared with CON, 2-way ANOVA and adjusted for multiple comparisons using the Bonferroni method. Overall differences between curves were assessed using generalized linear regression. (F) BON-1 CON, KD1, and KD2 cells were treated with 10 μM SMAP for 3 days. Dark and light exposures of Western blots show PP2A activation decreased RABL6A levels and altered its migration on gels. *P < 0.05 for untreated versus treated samples, Student’s t test. Error bars in E and F indicate SEM for data from 3 independent experiments.
Figure 5
Figure 5. Therapeutic reactivation of PP2A suppresses PNET growth in vivo.
(A) BON-1 cells (5 × 10⁶) were injected subcutaneously into NOD.SCID mice. Once tumors reached an average volume of 200 mm3, drug treatments were initiated. Tumor volumes were measured over a 4-week period in which mice were treated by oral gavage with vehicle control, SMAP (5 mg/kg, twice a day), MK-2206 (30 mg/kg, 3 times a week), and a combination of SMAP plus MK-2206. SEM for at least n = 5 mice per group; *P < 0.03 for vehicle versus SMAP or SMAP+MK-2206; #P < 0.05 for vehicle versus MK-2206; 2-way ANOVA and adjusted for multiple comparisons using Bonferroni method. (B) Comparison of tumor weights from vehicle (V), SMAP (S), MK-2206 (M), and SMAP plus MK-2206 (S+M) groups after the final treatment. Error bars, SEM; *P < 0.001, 2-way ANOVA and adjusted for multiple comparisons using the Bonferroni method. (C) Representative Western blot analyses of the indicated proteins in lysates of xenografted BON-1 tumors harvested from the treated mice. (DF) Quantification of relative levels of RABL6A, pAKT-S473, and pRB1-S807/811 in xenograft tumors, respectively, obtained by ImageJ analysis of Western blots (as shown in C). Mean ± SEM; *P < 0.05; **P < 0.01; 2-way ANOVA and adjusted for multiple comparisons using the Bonferroni method. (G) Representative H&E and IHC staining for the indicated proteins in BON-1 xenograft tumors from vehicle control and SMAP-treated mice. Images were taken at ×400. (H) Quantification of pAKT-S473 staining (assessed as weak = 1, moderate = 2, strong = 3) in tumors from vehicle-treated (V) and SMAP-treated (S) mice. Mean ± SEM; *P < 0.001, Student’s t test.
Figure 6
Figure 6. RABL6A oncogenic signaling in PNETs.
Schematic showing that RABL6A inhibits the PP2A tumor suppressor, thereby activating AKT-mTOR signaling to drive PNET proliferation and survival. In turn, PP2A can inhibit expression of RABL6A, possibly via dephosphorylation and destabilization of the protein. Earlier work showed that RABL6A can promote PNET pathogenesis by inhibiting RB1, which was associated with downregulation of CDK inhibitors (p21 and p27) and increased RB1 phosphorylation (23). PP2A-mediated dephosphorylation of p27 and RB1 increases their activities, representing additional mechanisms by which PP2A may antagonize RABL6A. Although not shown, AKT also inhibits RB1 signaling through several mechanisms. The pathways depicted here, as well as drug response assays performed in this study, predict that high RABL6A expression in patient PNETs will sensitize tumors to clinically relevant drugs that inhibit CDKs (Palbociclib), activate PP2A (SMAP), inhibit AKT (MK-2206), and inhibit mTORC1 (Everolimus). Arrows, activating events. Perpendicular bars, inhibitory events.

References

    1. Vinik AI, et al. NANETS consensus guidelines for the diagnosis of neuroendocrine tumor. Pancreas. 2010;39(6):713–734. doi: 10.1097/MPA.0b013e3181ebaffd. - DOI - PubMed
    1. Yao JC, et al. One hundred years after “carcinoid”: epidemiology of and prognostic factors for neuroendocrine tumors in 35,825 cases in the United States. J Clin Oncol. 2008;26(18):3063–3072. doi: 10.1200/JCO.2007.15.4377. - DOI - PubMed
    1. Frilling A, Sotiropoulos GC, Li J, Kornasiewicz O, Plöckinger U. Multimodal management of neuroendocrine liver metastases. HPB (Oxford) 2010;12(6):361–379. doi: 10.1111/j.1477-2574.2010.00175.x. - DOI - PMC - PubMed
    1. Ehehalt F, Saeger HD, Schmidt CM, Grützmann R. Neuroendocrine tumors of the pancreas. Oncologist. 2009;14(5):456–467. doi: 10.1634/theoncologist.2008-0259. - DOI - PubMed
    1. Strosberg JR, et al. The North American Neuroendocrine Tumor Society Consensus Guidelines for Surveillance and Medical Management of Midgut Neuroendocrine Tumors. Pancreas. 2017;46(6):707–714. doi: 10.1097/MPA.0000000000000850. - DOI - PMC - PubMed

Publication types

MeSH terms