. 2019 Mar 21;4(6):e126125.
doi: 10.1172/jci.insight.126125.

An SFTPC BRICHOS mutant links epithelial ER stress and spontaneous lung fibrosis

Affiliations

An SFTPC BRICHOS mutant links epithelial ER stress and spontaneous lung fibrosis

Jeremy Katzen et al. JCI Insight. .

Abstract

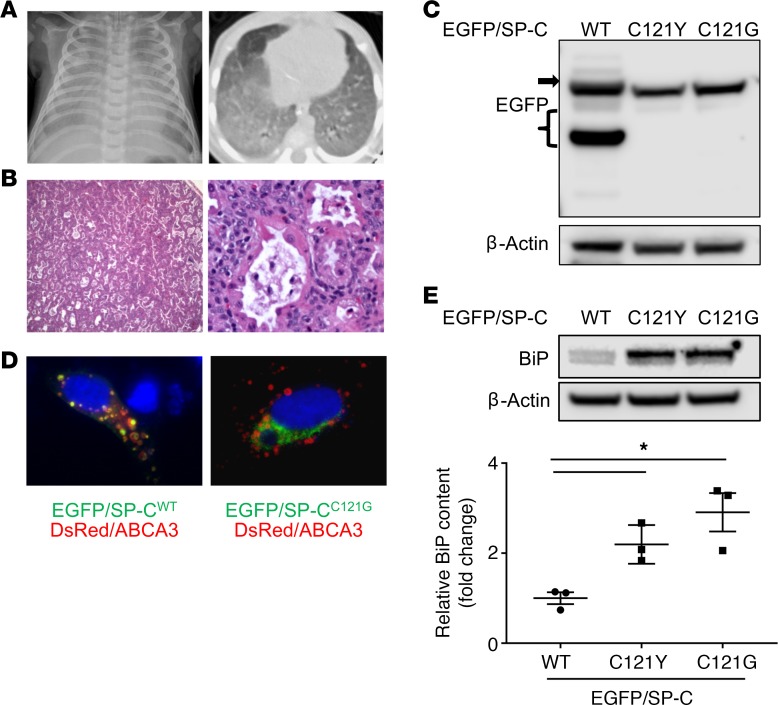
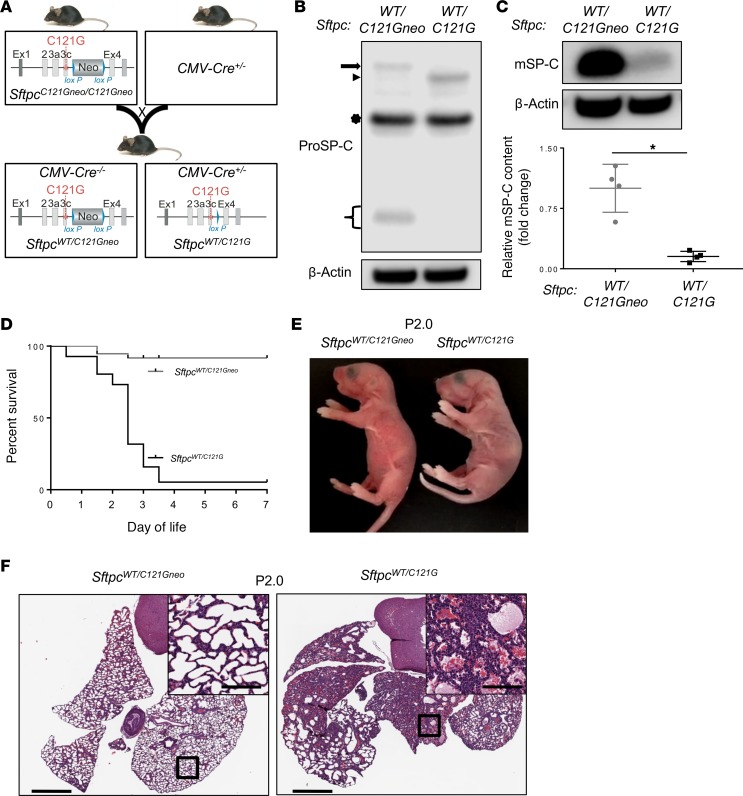
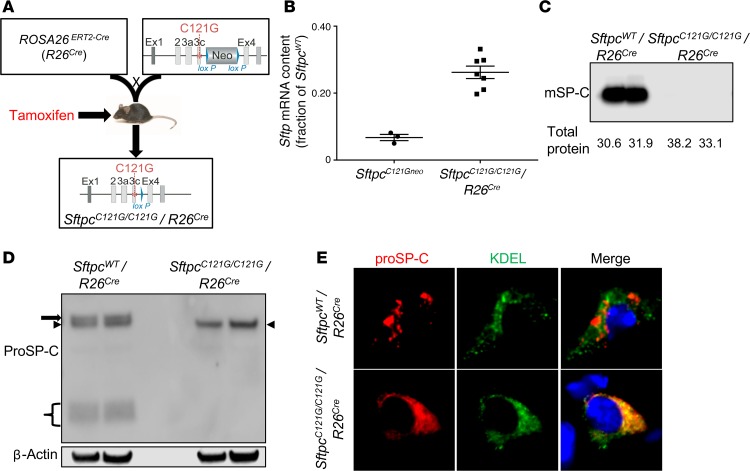
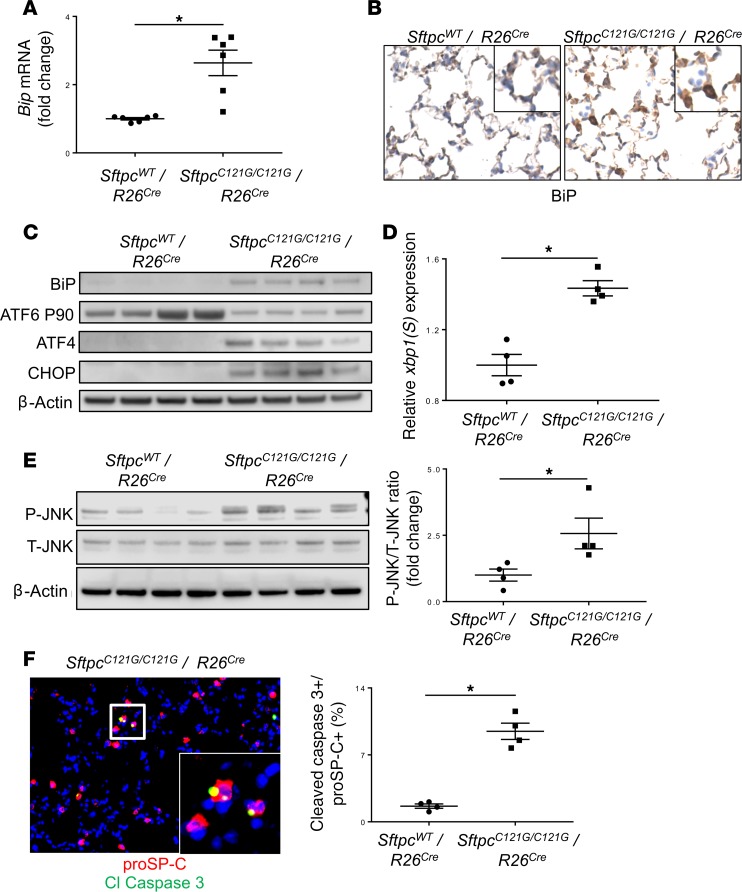
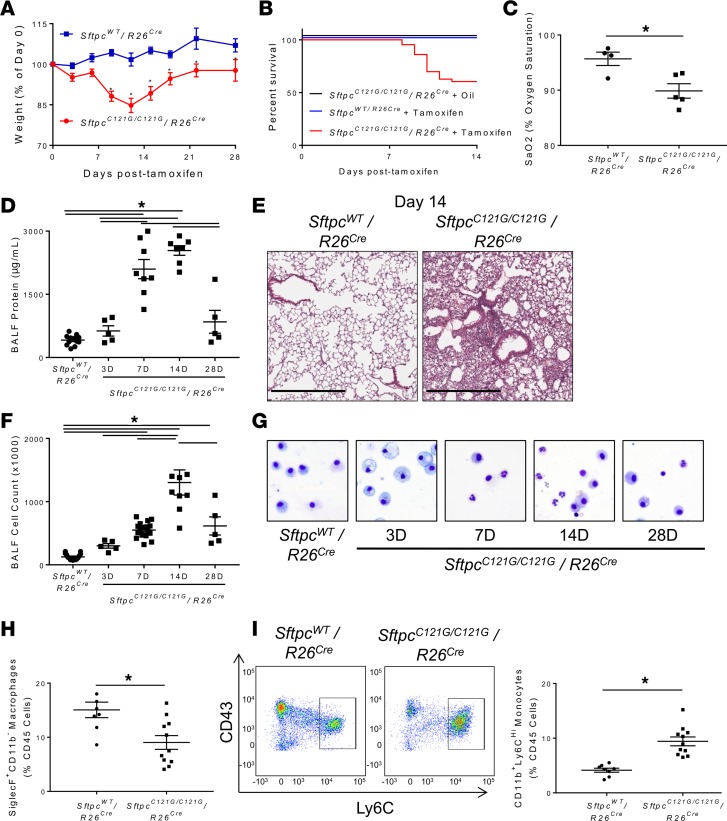
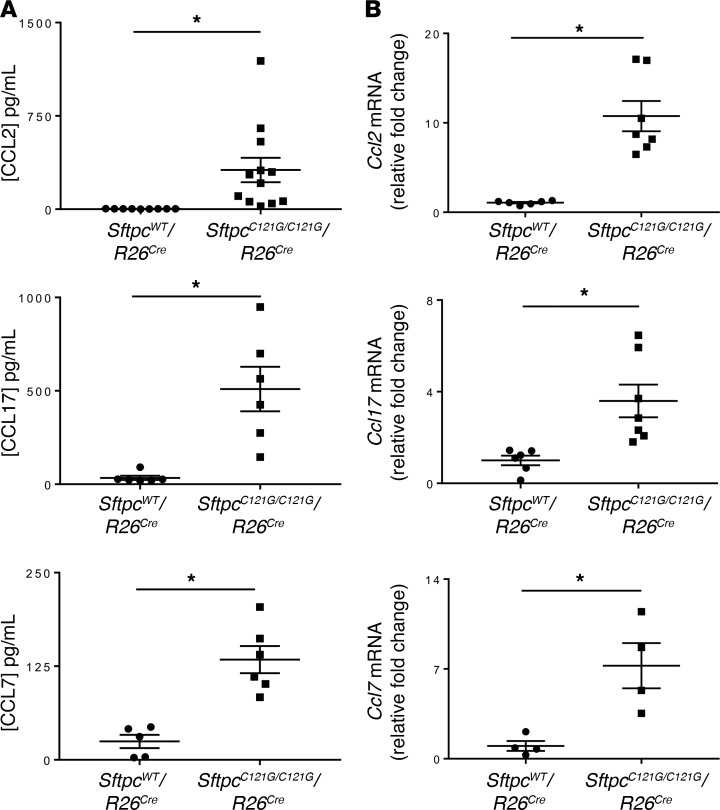
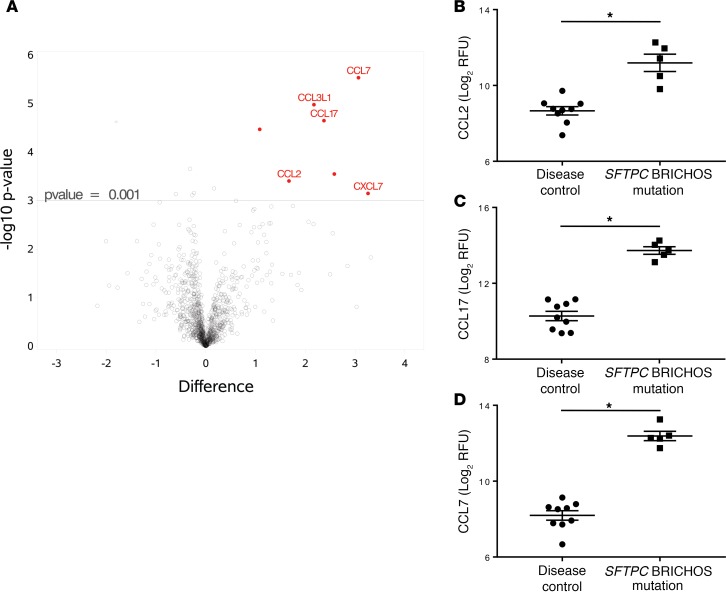
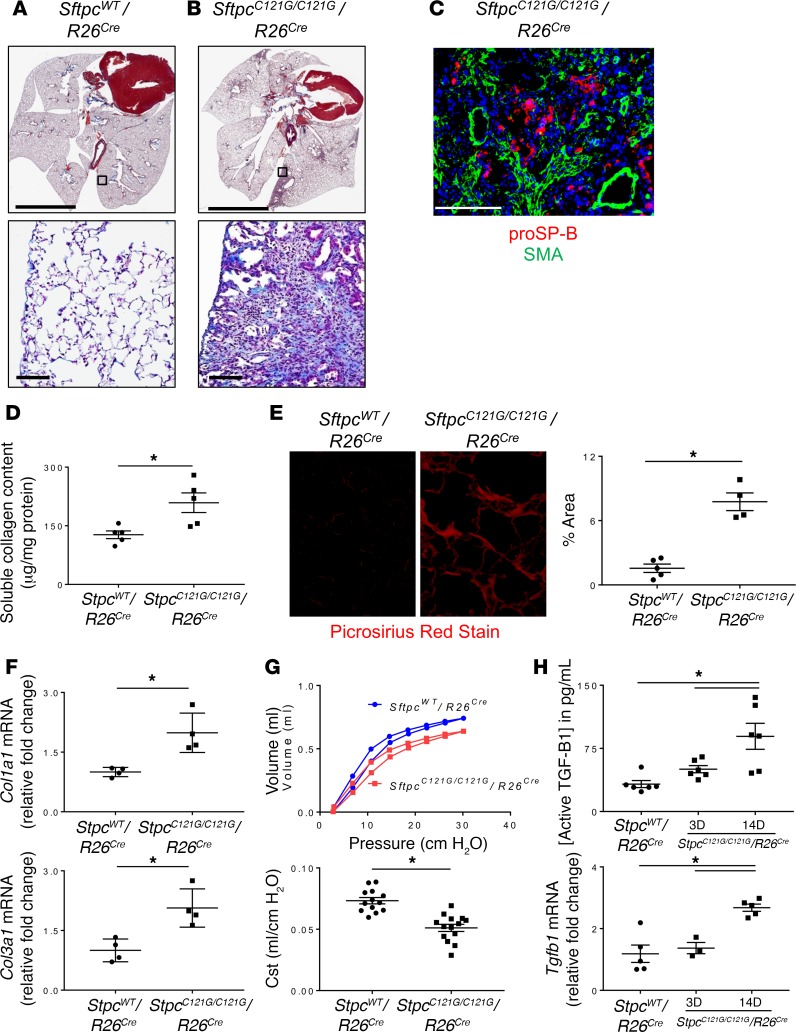
Alveolar type 2 (AT2) cell endoplasmic reticulum (ER) stress is a prominent feature in adult and pediatric interstitial lung disease (ILD and ChILD), but in vivo models linking AT2 cell ER stress to ILD have been elusive. Based on a clinical ChILD case, we identified a critical cysteine residue in the surfactant protein C gene (SFTPC) BRICHOS domain whose mutation induced ER stress in vitro. To model this in vivo, we generated a knockin mouse model expressing a cysteine-to-glycine substitution at codon 121 (C121G) in the Sftpc gene. SftpcC121G expression during fetal development resulted in a toxic gain-of-function causing fatal postnatal respiratory failure from disrupted lung morphogenesis. Induced SftpcC121G expression in adult mice resulted in an ER-retained pro-protein causing AT2 cell ER stress. SftpcC121G AT2 cells were a source of cytokines expressed in concert with development of polycellular alveolitis. These cytokines were subsequently found in a high-dimensional proteomic screen of bronchoalveolar lavage fluid from ChILD patients with the same class of SFTPC mutations. Following alveolitis resolution, SftpcC121G mice developed spontaneous pulmonary fibrosis and restrictive lung impairment. This model provides proof of concept linking AT2 cell ER stress to fibrotic lung disease coupled with translationally relevant biomarkers.

Keywords: Cell stress; Fibrosis; Protein misfolding; Pulmonology.


Conflict of interest statement

Conflict of interest: RRD is on the Boehringer Ingelheim Pediatric Interstitial Lung Disease Advisory Board.

Figures

Figure 1
Figure 1. In vitro modeling of a clinical SFTPCC121Y mutation identifies mistrafficked pro-protein and epithelial ER stress with mutagenesis of codon 121 in SFTPC.
(A) Chest imaging of a 3-month-old patient with heterozygous SFTPCC121Y mutation shows bilateral diffuse hazy opacity on chest radiograph (left) and diffuse ground glass opacities on chest CT (right). (B) H&E staining of patient lung biopsy demonstrates diffuse abnormality in lobular architecture, with mild enlargement of airspaces and mild to moderate interstitial widening, airspaces filled by foamy macrophages, scattered neutrophils, and eosinophilic material suggestive of proteinosis (original magnification, ×4 left and ×20 right). (C) HEK293 cells were transiently transfected with either EGFP/SP-CWT or EGFP/SP-CC121 mutants as indicated, and cell lysates harvested at 48 hours were subjected to Western blotting for EGFP. An SP-C primary translation product (black arrow) was detected in all transfections; however, no processing intermediates (black bracket) were observed with either EGFP/SP-CC121 mutation. Representative of 3 independent experiments. (D) HEK293 cells transiently cotransfected with either EGFP/SP-CWT or EGFP/SP-CC121G and DsRed/ABCA3 and subjected to immunfluorescence microscopy, demonstrating colocalization of EGFP/SP-CWT with DsRed/ABCA3, but a reticular expression pattern of EGFP/SP-CC121G without DsRed/ABCA3 colocalization (original magnification, ×60). (E) Cell lysates of HEK293 cells 48 hours after transfection with either EGFP/SP-CWT or EGFP/SP-CC121 mutants as indicated were subjected to Western analysis for BiP (top). Representative Western blot of n = 3. Quantitative densitometry (bottom) normalized to β-actin showing increases in BiP with the cysteine mutants compared to EGFP/SP-CWT. n = 3. *P < 0.05 vs. EGFP/SP-CWT by 1-way ANOVA with Dunnett’s multiple comparison test.
Figure 2
Figure 2. Constitutive expression of the SftpcC121G mutation in vivo causes a lethal toxic gain of function.
(A) Schematic for generation of mice constitutively expressing SftpcC121G alleles. Breeding of the SftpcC121Gneo/C121Gneo line to CMV-Cre mice yields litters with heterozygous constitutive expression of the SftpcC121G mutation (SftpcWT/C121G). (B) Western blotting of lung homogenates from day P2.5 for proSP-C expression shows aberrant banding pattern, with heterozygous SftpcC121G expression with decreased processing intermediates (arrow, SftpcWT/C121Gneo proSP-C highest-molecular-weight translational product; arrowhead, SftpcWT/C121G highest-molecular-weight translational product; star, nonspecific bands; brackets, processing intermediates). (C) Top: Representative Western blot of lung homogenates from P2.5 for mature SP-C (mSP-C). Bottom: Dot plots of mean and SEM of mSP-C densitometry expressed as fold change to SftpcWT/C121Gneo. *P < 0.05 using unpaired 2-tailed t test with normalization to β-actin loading control. (D) Kaplan-Meir survival analysis showing high lethality with constitutive SftpcC121Gexpression (n = 41 and 37 for SftpcWT/C121G and SftpcWT/C121Gneo, respectively). P < 0.001 by log-rank (Mantel-Cox) test. (E) Representative photographs of P.2.0 pups show development of cyanosis in the SftpcWT/C121G animal. (F) Representative lung histology (×4 magnification) of P2.0 SftpcWT/C121G pups with heterogeneous areas (×10 magnification inset) of thickened septae with proteinaceous fluid in the alveolar space. Scale bars: 500 μm, 200 μm (insets).
Figure 3
Figure 3. In vivo inducible expression of the SftpcC121G mutation in adult mice causes an ER-retained SP-C pro-protein.
(A) Strategy for generation of tamoxifen-inducible mice in which tamoxifen treatment of the SftpcC121G/C121G R26Cre line results in removal of an inhibitory intronic PGK-neo cassette. (B) qRT-PCR analysis for Sftpc expression in purified AT2 cells from homozygous SftpcC121Gneo/C121Gneo and SftpcC121G/C121G R26Cre mice at 7 days after treatment with tamoxifen. Data normalized to 18S RNA are expressed as Sftpc mRNA as a fraction of SftpcWT R26Cre mice. (C) Western blotting of BALF large aggregate fraction from SftpcC121G/C121G R26Cre and SftpcWT R26Cre mice on day 7 after tamoxifen showing the absence of mature SP-C (mSP-C) in the SftpcC121G/C121G R26Cre mice. (D) Western blotting of AT2 cell lysates from SftpcWT R26Cre or SftpcC121G/C121G R26Cre mice 7 days after tamoxifen shows SftpcC121G/C121G R26Cre AT2 cells with an ER retained pro-protein (arrowhead) without posttranslational palmitoylation (arrow) or processing intermediates (brackets) observed in SftpcWT R26Cre AT2 cells. (E) Double-label immunofluorescence staining of whole lung sections for proSP-C (red) and the ER marker KDEL demonstrates reticular proSP-C staining with significant colocalization with KDEL in SftpcC121G/C121G R26Cre mice, compared with the punctate pattern of proSP-C staining distinct from KDEL observed in the SftpcWT R26Cre mice (original magnification, ×60).
Figure 4
Figure 4. Expression of the SP-C C121G pro-protein causes activation of multiple epithelial ER stress pathways and induces AT2 cell apoptosis.
(A) qRT-PCR for BiP expression in purified AT2 cells from SftpcWT R26Cre controls and SftpcC121G/C121G R26Cre mice at 7 days after tamoxifen treatment. Data normalized to 18S RNA are expressed as fold change in BiP normalized to control mice. *P < 0.05 vs. control using unpaired 2-tailed t test. (B) Representative immunohistochemical staining for BiP in lung sections (magnification, ×20) from control and SftpcC121G/C121G R26Cre mice at 7 days after tamoxifen shows increased BiP staining in AT2 cells (inset magnification, ×60). (C) Western blotting of AT2 cell lysates at 7 days after tamoxifen for BiP, ATF6 (P90), ATF4, CHOP, and β-actin. (D) qRT-PCR for XBP1 splicing ratio in AT2 cells at 7 days after tamoxifen shows an increase in the spliced fraction in SftpcC121G/C121G R26Cre AT2 cells compared with controls. *P < 0.05 vs. control using unpaired 2-tailed t test. (E) Western blot (left) of AT2 cell lysates at 7 days after tamoxifen for phosphorylated JNK (P-JNK), total JNK (T-JNK), and β-actin. Densitometry ratio (right) of P-JNK/T-JNK, reveals increase in P-JNK in SftpcC121G/C121G R26Cre mice compared with control. *P < 0.05 vs. control using unpaired 2-tailed t test. (F) Representative ×20 fluorescence micrograph from SftpcC121G/C121G R26Cre lung 7 days after tamoxifen stained with proSP-C (red) and cleaved caspase-3 (green) (left). Dot plots of double-positive (cleaved caspase-3+/proSP-C+) cells expressed as a percentage of total proSP-C+ AT2 cells are shown with means and SEM (right). *P < 0.05 vs. control using unpaired 2-tailed t test.
Figure 5
Figure 5. Expression of mutant SftpcC121G causes lung injury with polycellular alveolitis.
(A) Weight loss curve in surviving SftpcC121G/C121G R26Cre mice and SftpcWT R26Cre controls treated with tamoxifen. *P < 0.05 vs. control group using unpaired 2-tailed t test. (B) Kaplan-Meier survival curve of SftpcC121G/C121G R26Cre mice treated with tamoxifen (n = 43) or vehicle (oil) (n = 16) and SftpcWT R26Cre mice treated with tamoxifen (n = 32). End points were defined as death or body weight <75% on 2 consecutive days. P < 0.001 by log-rank (Mantel-Cox) test. (C) Pulse oximetry of SftpcC121G/C121G R26Cre mice and controls 7 days after tamoxifen. *P < 0.05 vs. control using unpaired 2-tailed t test. (D) BALF protein content following tamoxifen. Controls represent pooled samples from all 4 time points. *P < 0.05 by 1-way ANOVA with post hoc Tukey’s test. (E) Representative ×10 magnification H&E histology at 14 days after tamoxifen. Scale bars: 500 μm. (F) Dot plots with mean and SEM of BALF cell count following tamoxifen. Controls represent pooled samples from all 4 time points. *P < 0.05 by 1-way ANOVA with post hoc Tukey’s test. (G) Representative Giemsa-stained BALF cytospins from control and SftpcC121G/C121G R26Cre mice after tamoxifen (magnification, ×20). (H) Dot plots with mean and SEM of percentage of total lung digest immune cells (CD45+) that were alveolar macrophages (SiglecF+CD11b) at 3 days after tamoxifen. *P < 0.05 vs. control using unpaired 2-tailed t test. (I) Representative control and SftpcC121G/C121G R26Cre flow cytometry gating for CD11b+Ly6Chi monocytes at day 3 after tamoxifen (left). Dot plots with mean and SEM of percentage of total lung digest immune cells (CD45+) that were CD11b+Ly6Chi monocytes. *P < 0.05 vs. control using unpaired 2-tailed t test.
Figure 6
Figure 6. SftpcC121G AT2 cells are a source of cytokines associated with macrophage/monocyte recruitment.
(A) Dot plots with mean and SEM of BALF CCL2 (top), CCL17 (middle), and CCL7 (bottom) protein in SftpcC121G/C121G R26Cre mice and SftpcWT R26Cre controls 7 days after tamoxifen treatment determined by Luminex assay (CCL2 and CCL17) and ELISA (CCL7). *P < 0.05 versus controls by 1-way ANOVA (see Supplemental Table 2), followed by post hoc Tukey’s test. (B) qRT-PCR determination of Ccl2 (top), Ccl17 (middle), and Ccl7 (bottom) mRNA expression in AT2 cells 7 days following tamoxifen. Dot plots with mean and SEM. *P < 0.05 vs. control using unpaired 2-tailed t test.
Figure 7
Figure 7. Pediatric SFTPC BRICHOS mutation patients elaborate multiple cytokines associated with macrophage/monocyte recruitment found in SftpcC121G mice.
(A) Volcano plot of SOMAscan proteomics platform analysis of BALF from SFTPC BRICHOS mutations cases (n = 5) and disease control (n = 9). Minus log10–transformed P value on y axis, and log2 difference on x axis. Conservative selection of cytokines associated with immune cell recruitment with relative florescence units (RFU) difference greater than 1 on a log2 scale and P < 0.001 (shown in red). (BD) Individual dot plots of mean ± SEM log2 RFU for (B) CCL2, (C) CCL17, and (D) CCL7. *P < 0.05 for SFTPC BRICHOS mutation cases versus disease control using unpaired 2-tailed t test.
Figure 8
Figure 8. Mice expressing the SftpcC121G mutation develop spontaneous fibrotic lung remodeling.
Representative trichrome staining of SftpcWT R26Cre (A) and SftpcC121G/C121G R26Cre (B) lung section 28 days after tamoxifen treatment showing patchy areas of fibrotic remodeling in SftpcC121G/C121G R26Cre mice. Scale bars in ×0.5-magnification upper panels: 5 mm; scale bars in ×10-magnification lower panels: 100 μm. (C) Double-label immunohistochemistry of SftpcC121G/C121G R26Cre lungs showing proSP-B+ AT2 cells (red) with adjacent smooth muscle actin (SMA; green) myofibroblasts (magnification, ×20; scale bar: 100 μm). (D) Soluble collagen in right lung homogenates measured by Sircol assay. Shown are dot-plots with mean and SEM. *P < 0.05 vs. control using unpaired 2-tailed t test. (E) Left: Representative picrosirius red–stained ×20-magnification fields. Right: Quantification performed using ImageJ expressed as picrosirius staining as percentage of section area with dot plots, and mean and SEM shown. *P < 0.05 vs. control using unpaired 2-tailed t test. (F) Whole lung expression of Col1a1 (top) and Col3a1 (bottom) mRNA assayed by qRT-PCR and expressed as fold change from controls. Dot plots and mean and SEM are shown. *P < 0.05 vs. control using unpaired 2-tailed t test. (G) Pooled flow volume loops (top) (n = 10) and calculated static compliance (Cst; bottom) from pulmonary function testing at 28 days after tamoxifen. *P < 0.05 vs. control using unpaired 2-tailed t test. (H) Top: Active TGF-β1 levels in BALF at indicated times after tamoxifen were measured using Luminex; shown are dot plots with mean and SEM. *P < 0.05 vs. control using unpaired 2-tailed t test. Bottom: qRT-PCR for Tgfb1 mRNA expression in AT2 cells isolated at 3 and 14 days after tamoxifen. Data expressed as fold change from control group are presented as dot plots with mean and SEM shown. *P < 0.05 versus controls by 1-way ANOVA with post hoc Tukey’s test.

References

    1. Travis WD, et al. An official American Thoracic Society/European Respiratory Society statement: update of the international multidisciplinary classification of the idiopathic interstitial pneumonias. Am J Respir Crit Care Med. 2013;188(6):733–748. doi: 10.1164/rccm.201308-1483ST. - DOI - PMC - PubMed
    1. Kurland G, et al. An official American Thoracic Society clinical practice guideline: classification, evaluation, and management of childhood interstitial lung disease in infancy. Am J Respir Crit Care Med. 2013;188(3):376–394. doi: 10.1164/rccm.201305-0923ST. - DOI - PMC - PubMed
    1. Raghu G, Chen SY, Hou Q, Yeh WS, Collard HR. Incidence and prevalence of idiopathic pulmonary fibrosis in US adults 18-64 years old. Eur Respir J. 2016;48(1):179–186. doi: 10.1183/13993003.01653-2015. - DOI - PubMed
    1. Soares JJ, et al. Childhood interstitial lung diseases: an 18-year retrospective analysis. Pediatrics. 2013;132(4):684–691. doi: 10.1542/peds.2013-1780. - DOI - PMC - PubMed
    1. Barkauskas CE, Noble PW. Cellular mechanisms of tissue fibrosis. 7. New insights into the cellular mechanisms of pulmonary fibrosis. Am J Physiol, Cell Physiol. 2014;306(11):C987–C996. doi: 10.1152/ajpcell.00321.2013. - DOI - PMC - PubMed

Publication types

MeSH terms