. 2019 Jun;34(6):1101-1114.
doi: 10.1002/jbmr.3691. Epub 2019 Mar 19.

Slc20a2, Encoding the Phosphate Transporter PiT2, Is an Important Genetic Determinant of Bone Quality and Strength

Affiliations

Slc20a2, Encoding the Phosphate Transporter PiT2, Is an Important Genetic Determinant of Bone Quality and Strength

Sarah Beck-Cormier et al. J Bone Miner Res. 2019 Jun.

Abstract

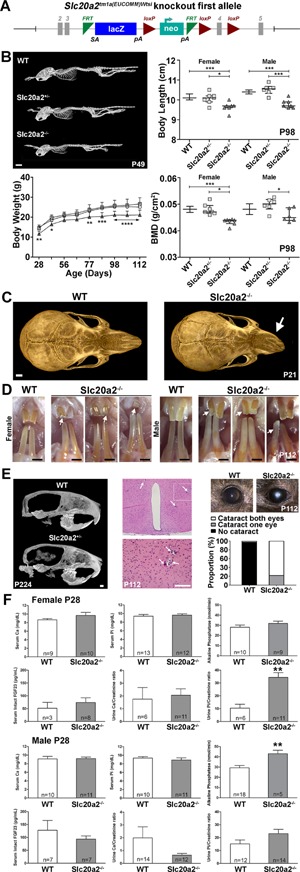
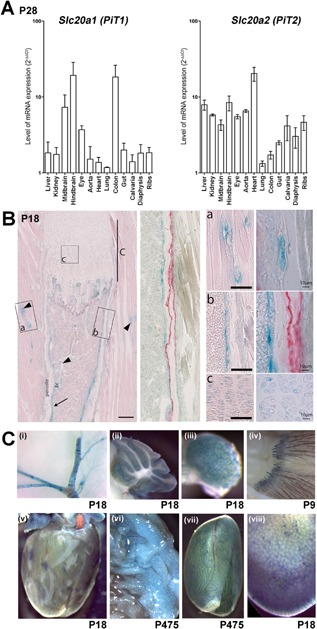
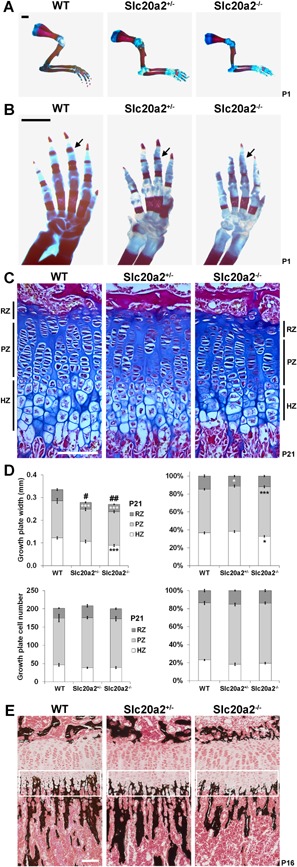
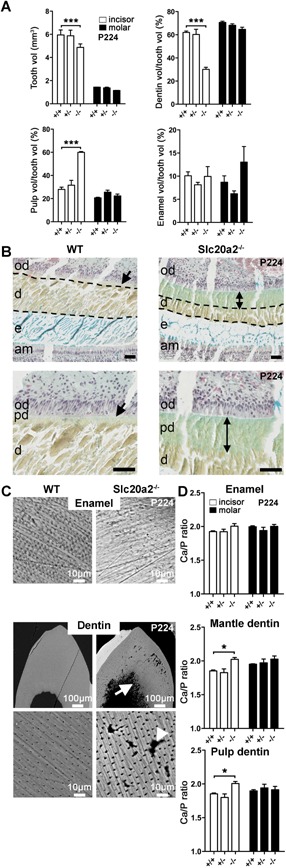
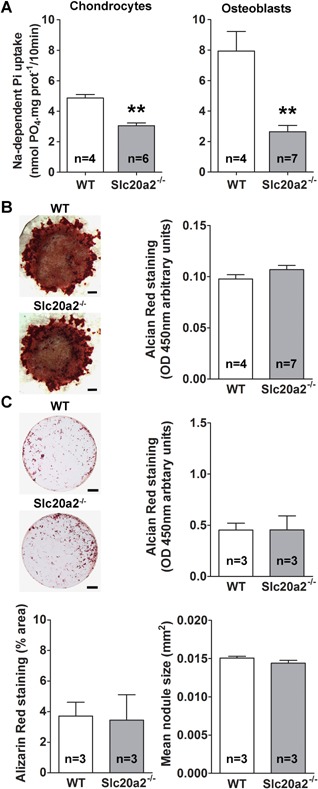
Osteoporosis is characterized by low bone mineral density (BMD) and fragility fracture and affects over 200 million people worldwide. Bone quality describes the material properties that contribute to strength independently of BMD, and its quantitative analysis is a major priority in osteoporosis research. Tissue mineralization is a fundamental process requiring calcium and phosphate transporters. Here we identify impaired bone quality and strength in Slc20a2-/- mice lacking the phosphate transporter SLC20A2. Juveniles had abnormal endochondral and intramembranous ossification, decreased mineral accrual, and short stature. Adults exhibited only small reductions in bone mass and mineralization but a profound impairment of bone strength. Bone quality was severely impaired in Slc20a2-/- mice: yield load (-2.3 SD), maximum load (-1.7 SD), and stiffness (-2.7 SD) were all below values predicted from their bone mineral content as determined in a cohort of 320 wild-type controls. These studies identify Slc20a2 as a physiological regulator of tissue mineralization and highlight its critical role in the determination of bone quality and strength. © 2019 The Authors. Journal of Bone and Mineral Research Published by Wiley Periodicals Inc.

Keywords: ANIMAL MODELS (GENETIC ANIMAL MODELS); BONE MATRIX (MATRIX MINERALIZATION); DISORDERS OF CALCIUM/PHOSPHATE METABOLISM (OTHER); GENETIC RESEARCH (HUMAN ASSOCIATION STUDIES); ORTHOPAEDICS (BIOMECHANICS).


Figures

Figure 1
Figure 1
Primary phenotype of Slc20a2–/– mice. (A) Slc20a2 knockout‐first conditional ready allele (reporter‐tagged insertion allele). The gene‐trap knockout is generated using a targeting cassette containing lacZ and neomycin marker genes. (B) μCT images of P49 female WT, Slc20a2+/–, and Slc20a2–/– mice. Scale bar = 5 mm. Body length in female and male WT, Slc20a2+/–, and Slc20a2–/– mice at P98 (medial with interquartile range, n = 6 to 1474 per sex, per genotype, *p < 0.05, ***p < 0.001; Kruskal‐Wallis test followed by Dunn's post hoc test). Body weight in female WT, Slc20a2+/–, and Slc20a2–/– mice between P28 and P112 (mean ± SD, n = 6 to 34, per genotype per age, *p < 0.05, **p < 0.01, ***p < 0.001, ****p < 0.0001 versus WT; ANOVA followed by Tukey's post hoc test). DXA BMD in female and male WT, Slc20a2+/–, and Slc20a2–/– mice at P98 (median with interquartile range, n = 6 to 1469 per sex, per genotype, *p < 0.05, ***p < 0.001; Kruskal‐Wallis test followed by Dunn's post hoc test). (C) Apical μCT images of skulls from P21 WT and Slc20a2–/– mice. Scale bar = 1 mm. Arrows indicate abnormal nasal bones in Slc20a2–/– mice. (D) Images of incisors from male and female P112 WT and Slc20a2–/– mice. Scale bars = 1 mm. (E) Midline sagittal μCT images of skulls from WT and Slc20a2–/– mice at P224. Scale bar = 1 mm. Low‐power and high‐power coronal sections of the brain in Slc20a2–/– mice at P112; arrows indicate soft tissue calcification. Scale bar = 100 µm. Images of the eye in WT and Slc20a2–/– mice at P112 and the incidence of cataract. (F) Serum and urinary calcium (Ca) and phosphate (Pi) and serum intact FGF23 and ALP activity in female and male WT and Slc20a2–/– mice at P28 (mean ± SE, n = 3 to 14 per genotype per age, **p < 0.01, ***p < 0.001 versus WT; Mann‐Whitney U test).
Figure 2
Figure 2
Primary phenotype of Slc20a2–/– mice. (A) Relative Slc20a1 and Slc20a2 mRNA expression (mean ± SE) in skeletal and nonskeletal tissues. Levels of Slc20a1 and Slc20a2 mRNAs in tissues were determined relative to expression in stomach after normalization to GusB and Tubulin (n = 3). (B) LacZ expression from the Slc20a2tm11a(EUCOMM)Wtsi allele in rib sections from P18 Slc20a2–/– mice: (a) skeletal muscle blood vessels; (b) cortical bone; and (c) growth plate cartilage. (C) Lac Z expression in (i) brain arteries, (ii) cerebellum, (iii) ovary, (iv) hair follicles, (v) heart, (vi) adipose tissue, (vii) testis, and (viii) liver from P18 to P457 Slc20a2+/– mice.
Figure 3
Figure 3
Decreased bone strength and stiffness in Slc20a2–/– mice. (A) Representative load displacement curves from three‐point bend testing of humeri from P112 WT, Slc20a2+/–, and Slc20a2–/– female mice showing yield load, maximum load, fracture load, and the gradient of the linear elastic phase (stiffness). Graphs showing yield, maximum load, and fracture load, and stiffness (mean ± SE, n = 6, per genotype, **p < 0.01, ***p < 0.001 versus WT; ANOVA followed by Tukey's post hoc test). (B) μCT images of the proximal tibial metaphysis and mid‐diaphyseal tibial cortical bone from P112 WT, Slc20a2+/–, and Slc20a2–/– female mice. Scale bar = 1 mm. (C) Graphs showing BV/TV, Tb.N, Tb.Th, Ct.Diameter, Ct.Th, and cortical BMD (mean ± SE, n = 6 per genotype, *p < 0.05, ***p < 0.001, versus WT; ANOVA followed by Tukey's post hoc test). (D) Representative BSE‐SEM images of the distal femur from P112 WT, Slc20a2+/–, and Slc20a2–/– mice. Scale bars = 1 mm (n = 4 to 5 per sex, per genotype). BV/TV = trabecular bone volume per tissue volume; Tb.N = trabecular number; Tb.Th = trabecular thickness; Ct.Diameter = external cortical diameter; Ct.Th = cortical thickness.
Figure 4
Figure 4
Decreased bone quality and micromineralization density in Slc20a2–/– mice. (A) Quantitative X‐ray microradiography images of femurs from P112 WT, Slc20a2+/–, and Slc20a2–/– female mice. Scale bars = 1 mm. Pseudocolored images represent grayscale images using a 16‐color interval scheme with low BMC in blue, and high BMC in red. (B) Graph shows femur length (mean ± SE, n = 6 per genotype) and relative frequency histogram shows relative BMC. (C) Representative quantitative BSE‐SEM images of proximal humerus trabecular bone and humerus cortical bone from P112 WT, Slc20a2+/–, and Slc20a2–/– female mice. Scale bars = 250 µm. Grayscale images were pseudocolored using an eight‐color interval scheme with low mineralization density in blue and high mineralization density in red/pink. (D) Relative frequency histograms of trabecular (left) and cortical (right) bone micromineralization densities (BMD) (n = 4 per genotype, ***p < 0.001 versus WT; Kolmogorov‐Smirnov test). (E) Bone quality analysis. Graphs demonstrating the physiological relationship between relative bone mineral content (median gray level determined by quantitative X‐ray microradiography) and yield load, maximum load, fracture load, and stiffness in femurs from P112 female WT mice of identical genetic background (n = 320). The line shows the linear regression and the gray box indicates ± 2SD or 95% confidence intervals. Mean values for female heterozygous Slc20a+/– mice are shown as orange circles and for female homozygous Slc20a2–/– mice as pink circles; in data from 320 WT, BMC correlated significantly with yield load (p = 0.005), maximum load (p < 0.00001), fracture load (p = 0.00003), and stiffness (p = 0.003).
Figure 5
Figure 5
Impaired postnatal skeletal development in Slc20a2–/– mice. (A) Forelimbs from P1 WT, Slc20a2+/–, and Slc20a2–/– mice stained with Alizarin red (bone) and Alcian blue (cartilage). Scale bar = 1 mm. (B) Forelimb digits stained with Alizarin red and Alcian blue. Scale bar = 1 mm. Black arrows indicate delayed formation of primary ossification centers in P1 Slc20a2+/– and Slc20a2–/– mice. (C) Decalcified sections of proximal tibia from P21 WT, Slc20a2+/–, and Slc20a2–/– mice stained with Alcian blue (cartilage) and van Gieson (bone matrix). Scale bar = 100 µm. (D) Upper left graph shows growth plate, RZ, PZ, and HZ heights. Upper right graph shows relative values, where each zone is shown as a percentage of total growth plate height (mean ± SE, n = 8 per genotype, *p < 0.05, ***p < 0.001 versus height of zone in WT, #p < 0.05, ##p < 0.01 versus total growth plate height in WT; ANOVA followed by Tukey's post hoc test). Lower left graph shows chondrocyte cell number in RZ, PZ, and HZ. Lower right shows relative values, where cell number in each zone is shown as a percentage of total cell number (mean ± SEM, n = 8 per genotype). (E) Undecalcified sections of P16 proximal tibia stained with Von Kossa (mineral deposition in black). HZ ROI is indicated by white rectangle. Scale bar = 100 µm. RZ = reserve zone; PZ = proliferating zone; HZ = hypertrophic zone.
Figure 6
Figure 6
Impaired tooth development and mineralization in Slc20a2–/– mice. (A) Incisor (white bars) and first molar (black bars) μCT parameters from P224 WT, Slc20a2+/–, and Slc20a2–/– male mice. Graphs showing total tooth (Tooth vol), pulp (Pulp vol/tooth vol), dentin (Dentin vol/tooth vol), and enamel (Enamel vol/tooth vol) volumes relative to total tooth volume (mean ± SEM, n = 3 per genotype, ***p < 0.0001, versus WT; two‐way ANOVA followed by Bonferroni post hoc test). (B) Low and higher power images of sagittal sections of P224 mandibular incisors from WT and Slc20a2–/– male mice stained with Movat. Scale bars = 50 μm. Double arrows indicate increased predentin thickness in Slc20a2–/– mice. Dotted lines indicate decreased dentine thickness in Slc20a2–/– mice. (am = ameloblasts, e = enamel, d = dentin, od = odontoblasts, pd = predentin). (C) SEM images of enamel and dentin in resin‐embedded mandibular incisors form P224 WT and Slc20a2–/– male mice. Scale bars = 10 to 100 μm. White arrow indicates calcospherites in incisors of Slc20a2–/– mice. White arrowhead indicates interglobular spaces in incisors of Slc20a2–/– mice. (D) EDX analysis of incisors (white bars) and first molars (black bars) from P224 WT, Slc20a2+/–, and Slc20a2–/– male mice. Graphs showing calcium:phosphate ratio (Ca/P) in enamel (upper), mantle dentin (middle), and circumpulpal (Pulp) dentin (lower) (mean ± SE, n = 3 per genotype, *p < 0.01; versus WT; two‐way ANOVA followed by Bonferroni post hoc test). EDX = energy‐dispersive X‐ray spectroscopy.
Figure 7
Figure 7
Primary chondrocyte and osteoblast cultures. (A) Sodium‐dependent phosphate uptake in primary rib chondrocytes (left) or calvarial osteoblasts (right) from WT and Slc20a2–/– mice (mean ± SE, n = 4 to 7 per genotype, **p < 0.01; versus WT; Mann‐Whitney U test). (B) Representative images of Alizarin red–stained high‐density chondrocyte pellets from P7 WT and Slc20a2–/– mice showing mineral deposition after 10 days in culture. Scale bars = 500 µm (n = 4 to 7 per genotype). Graph shows quantitation of eluted Alizarin red stain. (C) Representative images of Alizarin red–stained colony‐forming calvarial osteoblasts from P6 WT and Slc20a2–/– mice showing mineral deposition after 29 days in culture. Scale bars = 500 mm (n = 3 per genotype). Graphs show quantitation of eluted Alizarin red, fractional area of Alizarin red staining, and mean size of mineralized nodules (mean ± SE, n = 3 per genotype; Mann‐Whitney U test).
Figure 8
Figure 8
Cranial μCT analysis of PFBC patients and normal control individuals. (A) Bone density measurements in left and right OCs from PFBC patients (n = 21) and matched controls (n = 22). (mean ± SE, Student's t test, **p ≤ 0.01). (B) Left and right PB thickness measurements in PFBC patients (n = 21) and matched controls (n = 22). (mean ± SE, Student's t test, **p ≤ 0.01). OC = occipital condyle; PB = parietal bone.

References

    1. Johnell O, Kanis JA. An estimate of the worldwide prevalence and disability associated with osteoporotic fractures. Osteoporos Int. 2006;17(12):1726–33. - PubMed
    1. Compston J. Bone quality: what is it and how is it measured? Arq Bras Endocrinol Metabol. 2006;50(4):579–85. - PubMed
    1. Anderson HC, Garimella R, Tague SE. The role of matrix vesicles in growth plate development and biomineralization. Front Biosci. 2005;10:822–37. - PubMed
    1. Bottini M, Mebarek S, Anderson KL, et al. Matrix vesicles from chondrocytes and osteoblasts: their biogenesis, properties, functions and biomimetic models. Biochim Biophys Acta Gen Subj. 2018;1862(3):532–46. - PMC - PubMed
    1. Boonrungsiman S, Gentleman E, Carzaniga R, et al. The role of intracellular calcium phosphate in osteoblast‐mediated bone apatite formation. Proc Natl Acad Sci U S A. 2012;109(35):14170–5. - PMC - PubMed

Publication types

MeSH terms

Substances